
|
|||||
|
 | |
| |
| |
| |
| |
| |
|
Gene: ETHE1 |
Gene summary for ETHE1 |
| Gene information | Species | Human | Gene symbol | ETHE1 | Gene ID | 23474 |
| Gene name | ETHE1 persulfide dioxygenase | |
| Gene Alias | HSCO | |
| Cytomap | 19q13.31 | |
| Gene Type | protein-coding | GO ID | GO:0006518 | UniProtAcc | A0A0S2Z580 |
Top |
Malignant transformation analysis |
| Identification of the aberrant gene expression in precancerous and cancerous lesions by comparing the gene expression of stem-like cells in diseased tissues with normal stem cells |
| Entrez ID | Symbol | Replicates | Species | Organ | Tissue | Adj P-value | Log2FC | Malignancy |
| 23474 | ETHE1 | HTA11_3410_2000001011 | Human | Colorectum | AD | 2.49e-03 | 3.13e-01 | 0.0155 |
| 23474 | ETHE1 | HTA11_2487_2000001011 | Human | Colorectum | SER | 1.18e-37 | 2.14e+00 | -0.1808 |
| 23474 | ETHE1 | HTA11_1938_2000001011 | Human | Colorectum | AD | 9.20e-20 | 1.40e+00 | -0.0811 |
| 23474 | ETHE1 | HTA11_78_2000001011 | Human | Colorectum | AD | 2.10e-10 | 8.95e-01 | -0.1088 |
| 23474 | ETHE1 | HTA11_347_2000001011 | Human | Colorectum | AD | 3.66e-58 | 1.82e+00 | -0.1954 |
| 23474 | ETHE1 | HTA11_411_2000001011 | Human | Colorectum | SER | 2.72e-14 | 2.32e+00 | -0.2602 |
| 23474 | ETHE1 | HTA11_2112_2000001011 | Human | Colorectum | SER | 3.68e-15 | 1.99e+00 | -0.2196 |
| 23474 | ETHE1 | HTA11_3361_2000001011 | Human | Colorectum | AD | 4.00e-33 | 1.69e+00 | -0.1207 |
| 23474 | ETHE1 | HTA11_83_2000001011 | Human | Colorectum | SER | 5.99e-30 | 1.82e+00 | -0.1526 |
| 23474 | ETHE1 | HTA11_696_2000001011 | Human | Colorectum | AD | 1.00e-47 | 1.94e+00 | -0.1464 |
| 23474 | ETHE1 | HTA11_866_2000001011 | Human | Colorectum | AD | 2.02e-23 | 1.05e+00 | -0.1001 |
| 23474 | ETHE1 | HTA11_1391_2000001011 | Human | Colorectum | AD | 1.26e-33 | 1.70e+00 | -0.059 |
| 23474 | ETHE1 | HTA11_2992_2000001011 | Human | Colorectum | SER | 6.36e-20 | 2.13e+00 | -0.1706 |
| 23474 | ETHE1 | HTA11_5212_2000001011 | Human | Colorectum | AD | 7.43e-33 | 2.60e+00 | -0.2061 |
| 23474 | ETHE1 | HTA11_5216_2000001011 | Human | Colorectum | SER | 3.35e-14 | 1.93e+00 | -0.1462 |
| 23474 | ETHE1 | HTA11_546_2000001011 | Human | Colorectum | AD | 5.17e-11 | 1.12e+00 | -0.0842 |
| 23474 | ETHE1 | HTA11_9341_2000001011 | Human | Colorectum | SER | 1.14e-04 | 8.75e-01 | -0.00410000000000005 |
| 23474 | ETHE1 | HTA11_7862_2000001011 | Human | Colorectum | AD | 6.89e-16 | 1.08e+00 | -0.0179 |
| 23474 | ETHE1 | HTA11_866_3004761011 | Human | Colorectum | AD | 2.70e-05 | 5.55e-01 | 0.096 |
| 23474 | ETHE1 | HTA11_4255_2000001011 | Human | Colorectum | SER | 7.21e-07 | 1.21e+00 | 0.0446 |
| Page: 1 2 3 4 5 6 7 8 9 10 |
| Tissue | Expression Dynamics | Abbreviation |
| Colorectum (GSE201348) |  | FAP: Familial adenomatous polyposis |
| CRC: Colorectal cancer | ||
| Colorectum (HTA11) |  | AD: Adenomas |
| SER: Sessile serrated lesions | ||
| MSI-H: Microsatellite-high colorectal cancer | ||
| MSS: Microsatellite stable colorectal cancer | ||
| Esophagus | 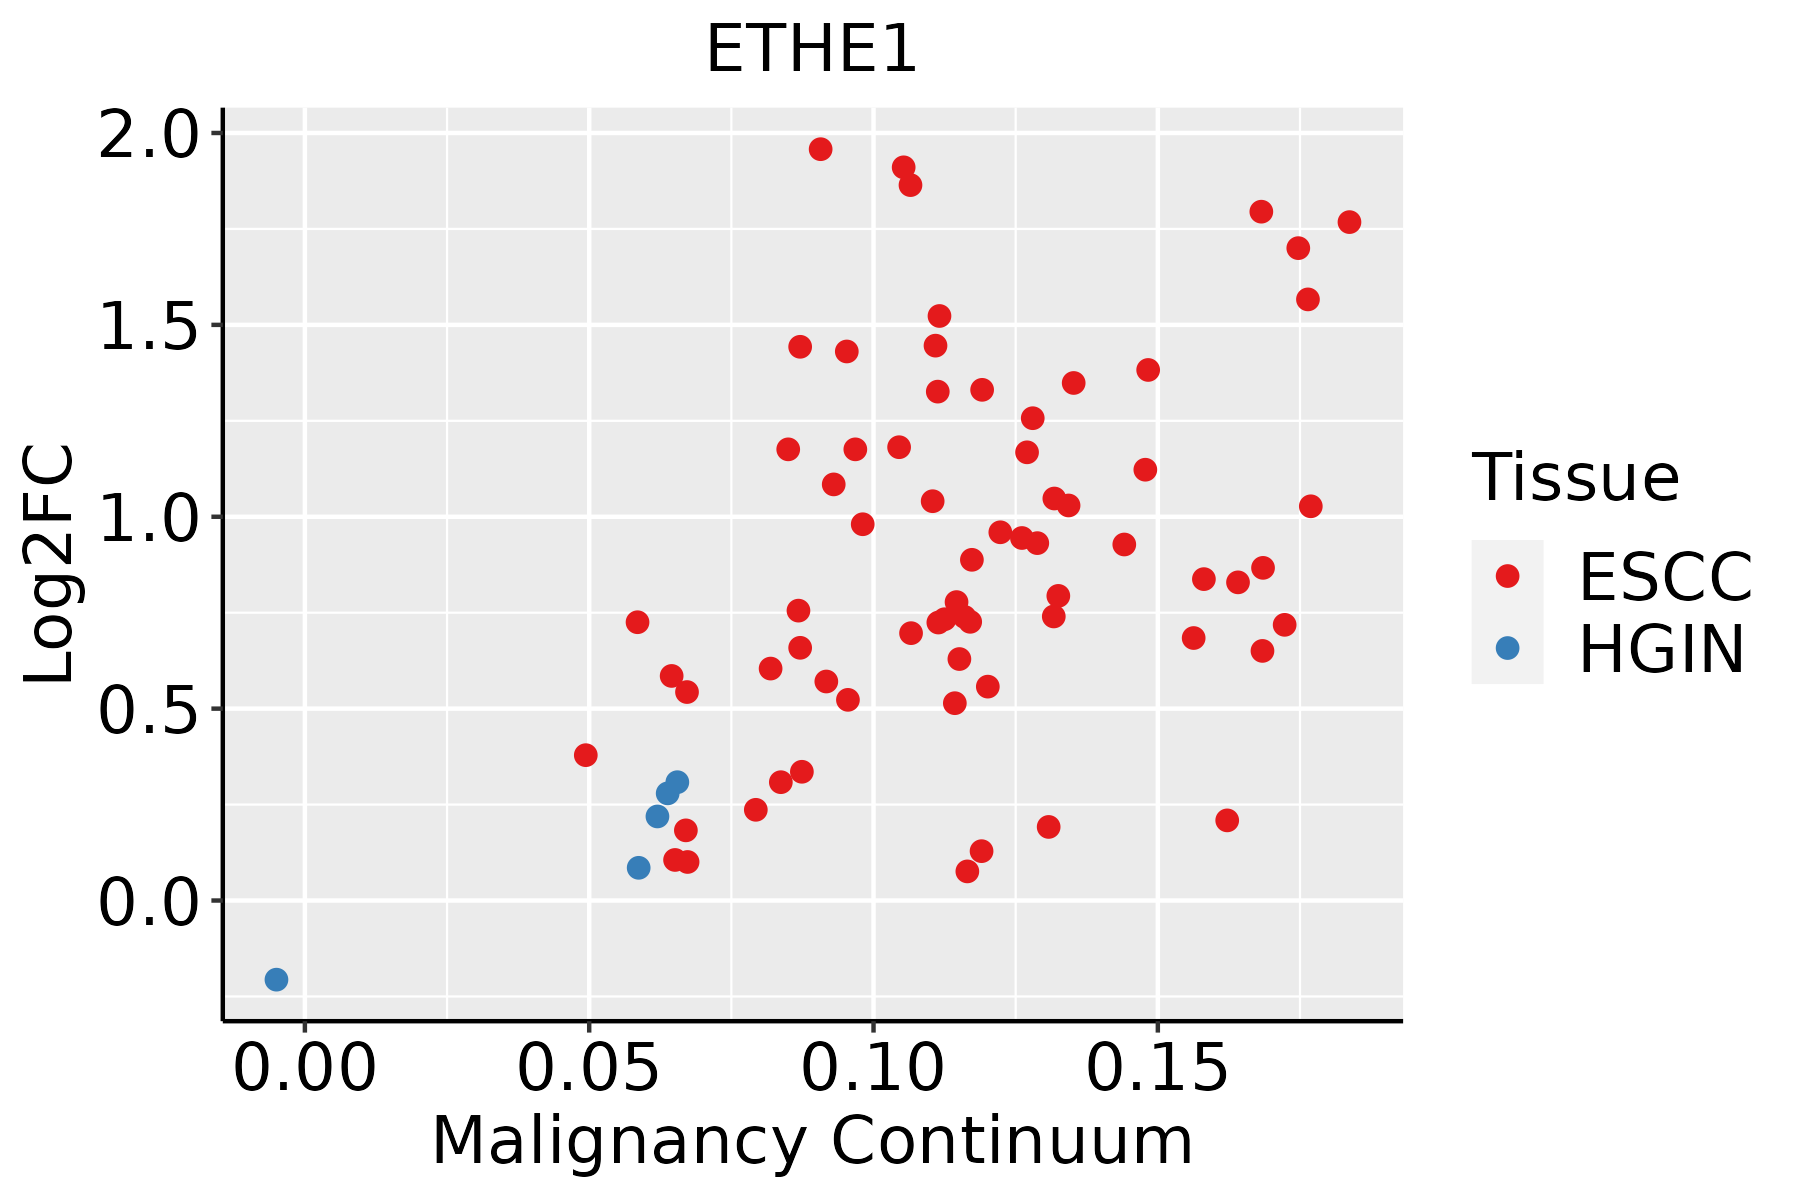 | ESCC: Esophageal squamous cell carcinoma |
| HGIN: High-grade intraepithelial neoplasias | ||
| LGIN: Low-grade intraepithelial neoplasias | ||
| GC |  | CAG: Chronic atrophic gastritis |
| CAG with IM: Chronic atrophic gastritis with intestinal metaplasia | ||
| CSG: Chronic superficial gastritis | ||
| GC: Gastric cancer | ||
| SIM: Severe intestinal metaplasia | ||
| WIM: Wild intestinal metaplasia | ||
| Liver | 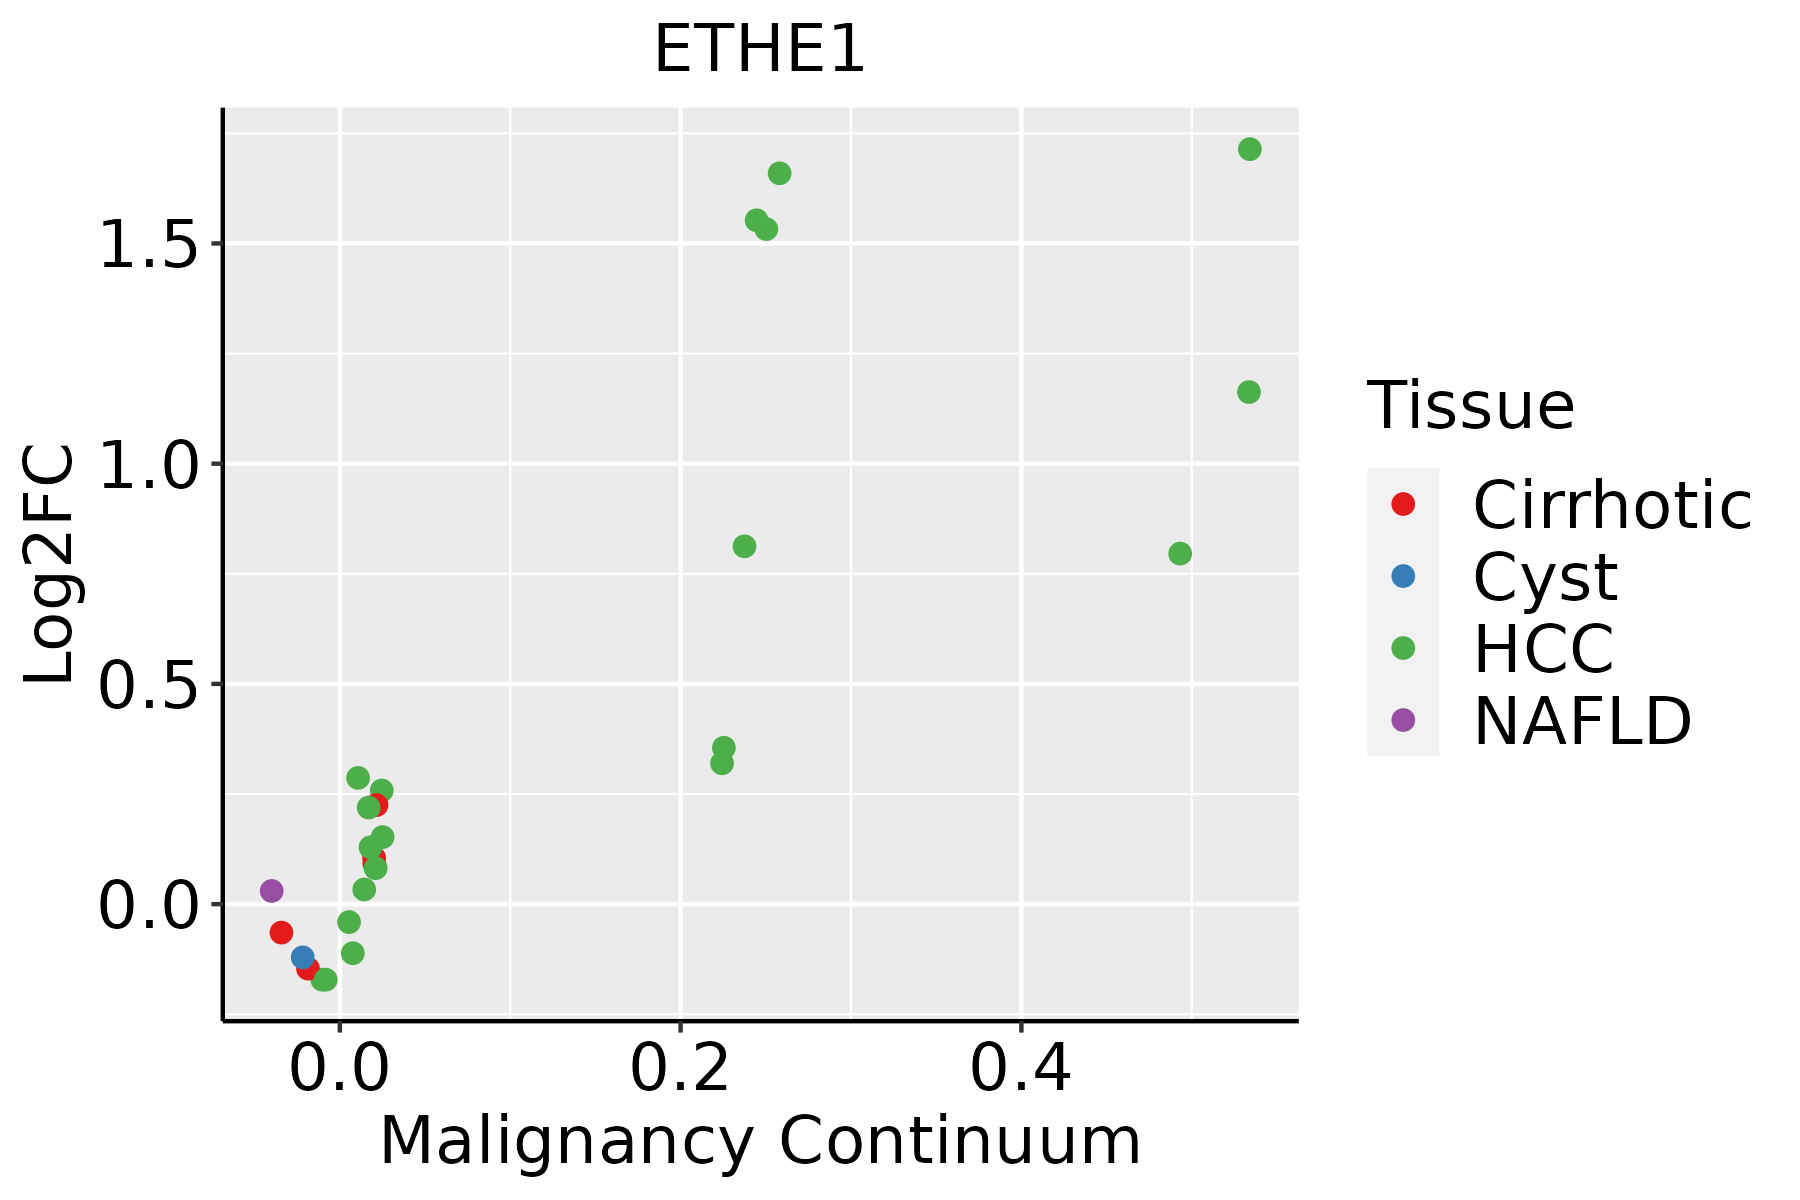 | HCC: Hepatocellular carcinoma |
| NAFLD: Non-alcoholic fatty liver disease | ||
| Oral Cavity |  | EOLP: Erosive Oral lichen planus |
| LP: leukoplakia | ||
| NEOLP: Non-erosive oral lichen planus | ||
| OSCC: Oral squamous cell carcinoma | ||
| Skin | 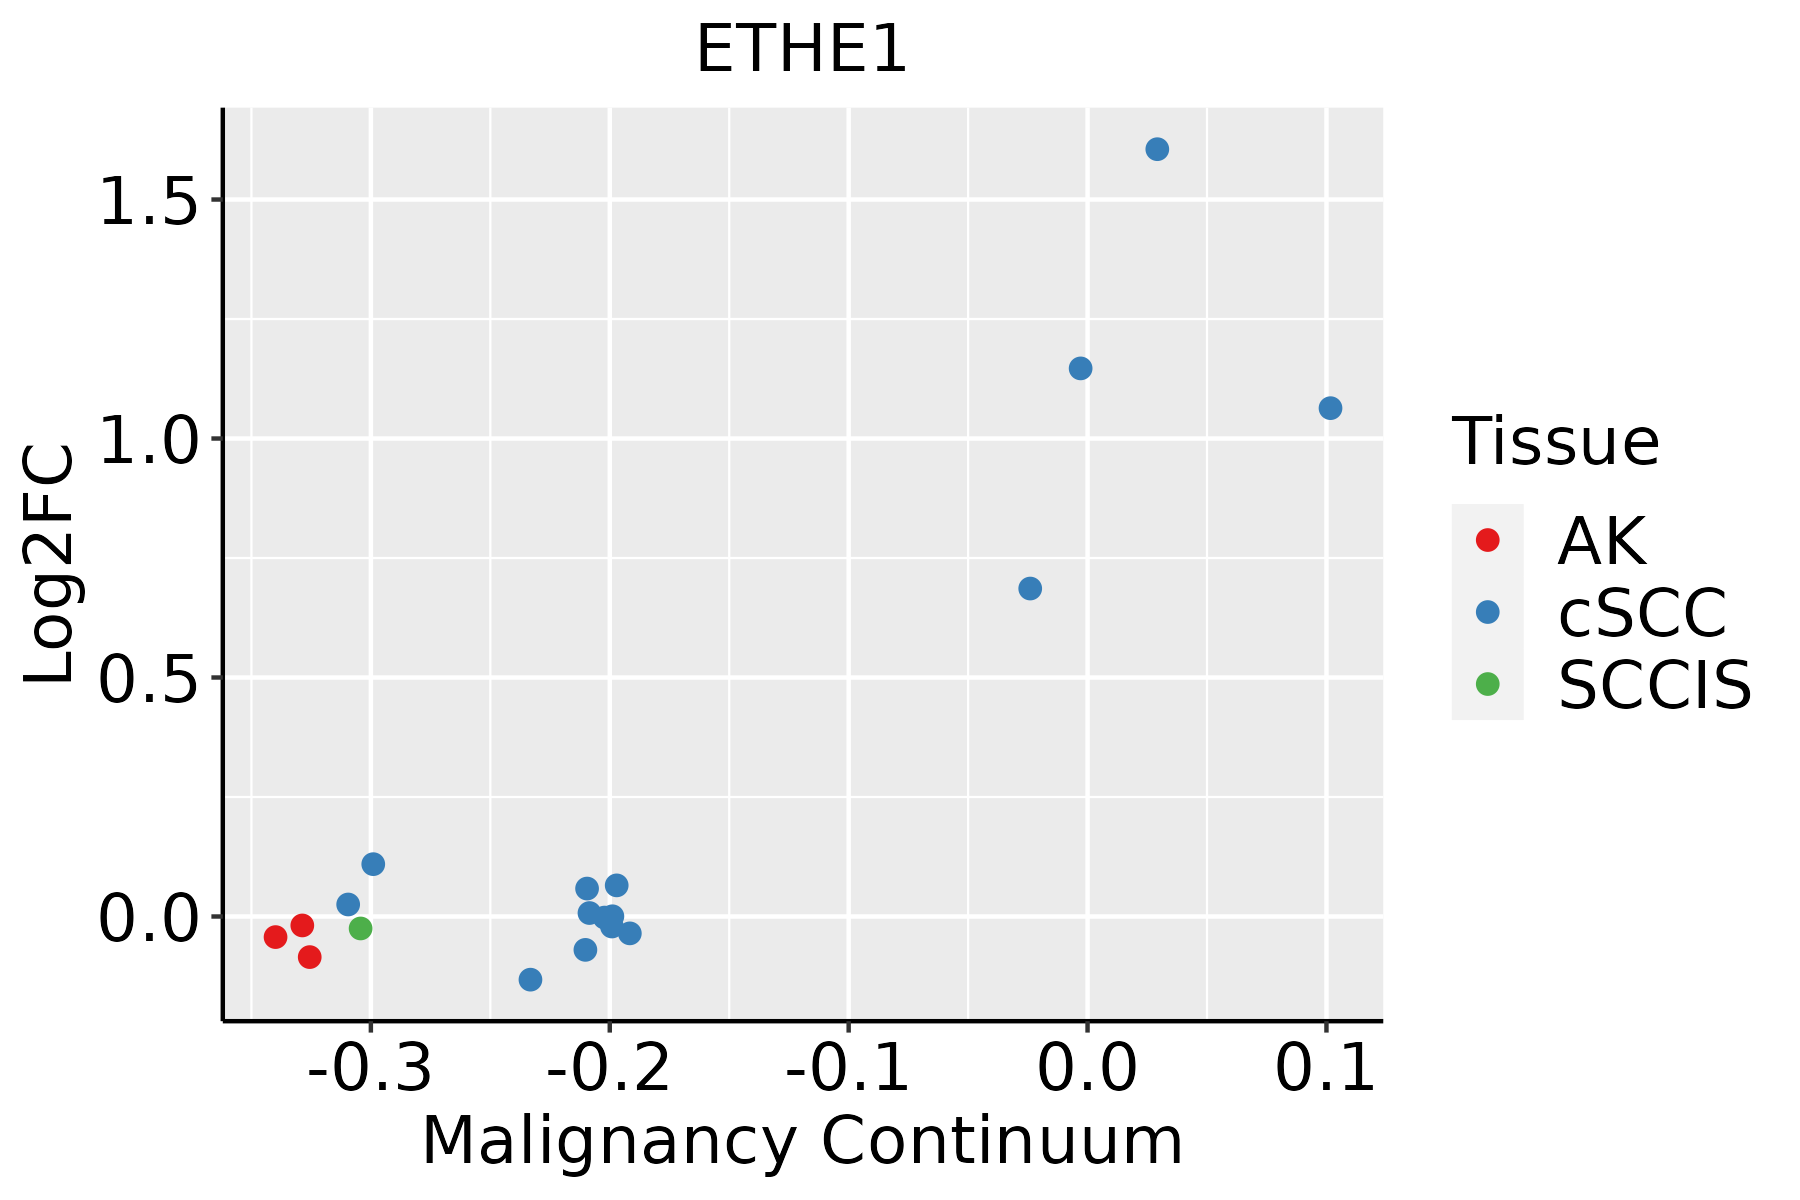 | AK: Actinic keratosis |
| cSCC: Cutaneous squamous cell carcinoma | ||
| SCCIS:squamous cell carcinoma in situ | ||
| Thyroid |  | ATC: Anaplastic thyroid cancer |
| HT: Hashimoto's thyroiditis | ||
| PTC: Papillary thyroid cancer |
| ∗log2FC in expression of this searched gene in stem-like cells from each diseased tissue sample relative to stem-like cells in normal samples in each tissue plotted against the malignancy continuum. Samples are colored based on if they are from different disease stage. |
Top |
Malignant transformation related pathway analysis |
| Find out the enriched GO biological processes and KEGG pathways involved in transition from healthy to precancer to cancer |
| Tissue | Disease Stage | Enriched GO biological Processes |
| Colorectum | AD |  |
| Colorectum | SER |  |
| Colorectum | MSS |  |
| Colorectum | MSI-H |  |
| Colorectum | FAP |  |
| ∗Top 15 enriched GO BP terms are showed in the bar plot of each disease state in each tissue. Each row represents a significant GO biological process which is colored according to the -log10(p.adjust). |
| Page: 1 2 3 4 5 6 7 8 9 |
| GO ID | Tissue | Disease Stage | Description | Gene Ratio | Bg Ratio | pvalue | p.adjust | Count |
| GO:0006790 | Colorectum | AD | sulfur compound metabolic process | 101/3918 | 339/18723 | 6.46e-05 | 1.07e-03 | 101 |
| GO:0006575 | Colorectum | AD | cellular modified amino acid metabolic process | 59/3918 | 188/18723 | 4.80e-04 | 5.27e-03 | 59 |
| GO:00067901 | Colorectum | SER | sulfur compound metabolic process | 73/2897 | 339/18723 | 1.75e-03 | 1.81e-02 | 73 |
| GO:00065751 | Colorectum | MSS | cellular modified amino acid metabolic process | 55/3467 | 188/18723 | 2.16e-04 | 3.01e-03 | 55 |
| GO:00067902 | Colorectum | MSS | sulfur compound metabolic process | 85/3467 | 339/18723 | 1.52e-03 | 1.39e-02 | 85 |
| GO:00067906 | Esophagus | ESCC | sulfur compound metabolic process | 201/8552 | 339/18723 | 2.64e-07 | 3.94e-06 | 201 |
| GO:00065757 | Esophagus | ESCC | cellular modified amino acid metabolic process | 112/8552 | 188/18723 | 8.31e-05 | 6.06e-04 | 112 |
| GO:000674912 | Esophagus | ESCC | glutathione metabolic process | 42/8552 | 64/18723 | 1.01e-03 | 5.12e-03 | 42 |
| GO:000679011 | Liver | Cirrhotic | sulfur compound metabolic process | 129/4634 | 339/18723 | 3.06e-08 | 1.04e-06 | 129 |
| GO:000657511 | Liver | Cirrhotic | cellular modified amino acid metabolic process | 70/4634 | 188/18723 | 9.04e-05 | 9.69e-04 | 70 |
| GO:00067494 | Liver | Cirrhotic | glutathione metabolic process | 27/4634 | 64/18723 | 1.63e-03 | 1.05e-02 | 27 |
| GO:000679021 | Liver | HCC | sulfur compound metabolic process | 212/7958 | 339/18723 | 5.60e-14 | 3.39e-12 | 212 |
| GO:000657521 | Liver | HCC | cellular modified amino acid metabolic process | 119/7958 | 188/18723 | 6.47e-09 | 1.67e-07 | 119 |
| GO:000674911 | Liver | HCC | glutathione metabolic process | 44/7958 | 64/18723 | 1.95e-05 | 2.09e-04 | 44 |
| GO:00067905 | Oral cavity | OSCC | sulfur compound metabolic process | 168/7305 | 339/18723 | 4.50e-05 | 3.84e-04 | 168 |
| GO:00065756 | Oral cavity | OSCC | cellular modified amino acid metabolic process | 91/7305 | 188/18723 | 5.33e-03 | 2.07e-02 | 91 |
| GO:000657512 | Oral cavity | LP | cellular modified amino acid metabolic process | 64/4623 | 188/18723 | 2.43e-03 | 1.73e-02 | 64 |
| GO:000679012 | Oral cavity | LP | sulfur compound metabolic process | 106/4623 | 339/18723 | 3.36e-03 | 2.25e-02 | 106 |
| GO:00065758 | Skin | cSCC | cellular modified amino acid metabolic process | 73/4864 | 188/18723 | 7.11e-05 | 6.85e-04 | 73 |
| GO:00067498 | Skin | cSCC | glutathione metabolic process | 26/4864 | 64/18723 | 7.34e-03 | 3.47e-02 | 26 |
| Page: 1 2 |
| Pathway ID | Tissue | Disease Stage | Description | Gene Ratio | Bg Ratio | pvalue | p.adjust | qvalue | Count |
| hsa009202 | Colorectum | SER | Sulfur metabolism | 8/1580 | 10/8465 | 4.56e-05 | 5.22e-04 | 3.79e-04 | 8 |
| hsa009203 | Colorectum | SER | Sulfur metabolism | 8/1580 | 10/8465 | 4.56e-05 | 5.22e-04 | 3.79e-04 | 8 |
| hsa009208 | Colorectum | CRC | Sulfur metabolism | 5/1091 | 10/8465 | 5.07e-03 | 2.72e-02 | 1.84e-02 | 5 |
| hsa009209 | Colorectum | CRC | Sulfur metabolism | 5/1091 | 10/8465 | 5.07e-03 | 2.72e-02 | 1.84e-02 | 5 |
| hsa0092010 | Esophagus | ESCC | Sulfur metabolism | 9/4205 | 10/8465 | 1.01e-02 | 2.38e-02 | 1.22e-02 | 9 |
| hsa0092011 | Esophagus | ESCC | Sulfur metabolism | 9/4205 | 10/8465 | 1.01e-02 | 2.38e-02 | 1.22e-02 | 9 |
| Page: 1 |
Top |
Cell-cell communication analysis |
| Identification of potential cell-cell interactions between two cell types and their ligand-receptor pairs for different disease states |
| Ligand | Receptor | LRpair | Pathway | Tissue | Disease Stage |
| Page: 1 |
Top |
Single-cell gene regulatory network inference analysis |
| Find out the significant the regulons (TFs) and the target genes of each regulon across cell types for different disease states |
| TF | Cell Type | Tissue | Disease Stage | Target Gene | RSS | Regulon Activity |
| ∗The dot plots of a searched regulon are shown for all cell subpopulations in each disease state of each tissue based on the regulon specific score inferred using pySCENIC and by calculating the average expression. |
| Page: 1 |
Top |
Somatic mutation of malignant transformation related genes |
| Annotation of somatic variants for genes involved in malignant transformation |
| Hugo Symbol | Variant Class | Variant Classification | dbSNP RS | HGVSc | HGVSp | HGVSp Short | SWISSPROT | BIOTYPE | SIFT | PolyPhen | Tumor Sample Barcode | Tissue | Histology | Sex | Age | Stage | Therapy Types | Drugs | Outcome |
| ETHE1 | SNV | Missense_Mutation | c.367N>T | p.Gly123Trp | p.G123W | O95571 | protein_coding | deleterious(0) | probably_damaging(1) | TCGA-A2-A04T-01 | Breast | breast invasive carcinoma | Female | <65 | I/II | Chemotherapy | cyclophosphamide | SD | |
| ETHE1 | SNV | Missense_Mutation | novel | c.640C>T | p.Arg214Trp | p.R214W | O95571 | protein_coding | deleterious(0) | probably_damaging(1) | TCGA-EA-A3HU-01 | Cervix | cervical & endocervical cancer | Female | <65 | I/II | Unknown | Unknown | SD |
| ETHE1 | SNV | Missense_Mutation | c.583N>T | p.His195Tyr | p.H195Y | O95571 | protein_coding | deleterious(0) | probably_damaging(0.999) | TCGA-IR-A3LL-01 | Cervix | cervical & endocervical cancer | Female | <65 | I/II | Chemotherapy | cisplatin | CR | |
| ETHE1 | SNV | Missense_Mutation | rs28940289 | c.487N>T | p.Arg163Trp | p.R163W | O95571 | protein_coding | deleterious(0) | probably_damaging(1) | TCGA-AA-3877-01 | Colorectum | colon adenocarcinoma | Female | >=65 | I/II | Unknown | Unknown | SD |
| ETHE1 | SNV | Missense_Mutation | novel | c.678N>A | p.Met226Ile | p.M226I | O95571 | protein_coding | deleterious(0) | possibly_damaging(0.592) | TCGA-CK-4951-01 | Colorectum | colon adenocarcinoma | Female | >=65 | I/II | Unknown | Unknown | PD |
| ETHE1 | SNV | Missense_Mutation | rs779584627 | c.641N>A | p.Arg214Gln | p.R214Q | O95571 | protein_coding | deleterious(0) | probably_damaging(1) | TCGA-A5-A1OF-01 | Endometrium | uterine corpus endometrioid carcinoma | Female | <65 | I/II | Unknown | Unknown | SD |
| ETHE1 | SNV | Missense_Mutation | c.437A>G | p.Asp146Gly | p.D146G | O95571 | protein_coding | deleterious(0.03) | benign(0.25) | TCGA-B5-A11E-01 | Endometrium | uterine corpus endometrioid carcinoma | Female | <65 | I/II | Unknown | Unknown | SD | |
| ETHE1 | SNV | Missense_Mutation | rs772537157 | c.356N>T | p.Ser119Phe | p.S119F | O95571 | protein_coding | tolerated(0.07) | benign(0.003) | TCGA-EO-A22T-01 | Endometrium | uterine corpus endometrioid carcinoma | Female | <65 | I/II | Unknown | Unknown | SD |
| ETHE1 | SNV | Missense_Mutation | novel | c.464N>T | p.Ala155Val | p.A155V | O95571 | protein_coding | deleterious(0.01) | possibly_damaging(0.545) | TCGA-EO-A22X-01 | Endometrium | uterine corpus endometrioid carcinoma | Female | <65 | III/IV | Unspecific | Carboplatin | Complete Response |
| ETHE1 | SNV | Missense_Mutation | novel | c.571N>T | p.Ile191Phe | p.I191F | O95571 | protein_coding | deleterious(0) | possibly_damaging(0.529) | TCGA-44-5645-01 | Lung | lung adenocarcinoma | Female | <65 | I/II | Unknown | Unknown | SD |
| Page: 1 2 |
Top |
Related drugs of malignant transformation related genes |
| Identification of chemicals and drugs interact with genes involved in malignant transfromation |
| (DGIdb 4.0) |
| Entrez ID | Symbol | Category | Interaction Types | Drug Claim Name | Drug Name | PMIDs |
| Page: 1 |

Copyright 2023-Present -The University of Texas Health Science Center at Houston |