
|
|||||
|
 | |
| |
| |
| |
| |
| |
|
Gene: ETFRF1 |
Gene summary for ETFRF1 |
| Gene information | Species | Human | Gene symbol | ETFRF1 | Gene ID | 144363 |
| Gene name | electron transfer flavoprotein regulatory factor 1 | |
| Gene Alias | LYRM5 | |
| Cytomap | 12p12.1 | |
| Gene Type | protein-coding | GO ID | GO:0006091 | UniProtAcc | Q6IPR1 |
Top |
Malignant transformation analysis |
| Identification of the aberrant gene expression in precancerous and cancerous lesions by comparing the gene expression of stem-like cells in diseased tissues with normal stem cells |
| Entrez ID | Symbol | Replicates | Species | Organ | Tissue | Adj P-value | Log2FC | Malignancy |
| 144363 | ETFRF1 | LZE4T | Human | Esophagus | ESCC | 1.47e-07 | 2.42e-01 | 0.0811 |
| 144363 | ETFRF1 | LZE5T | Human | Esophagus | ESCC | 1.28e-07 | 4.15e-01 | 0.0514 |
| 144363 | ETFRF1 | LZE7T | Human | Esophagus | ESCC | 2.07e-09 | 4.31e-01 | 0.0667 |
| 144363 | ETFRF1 | LZE8T | Human | Esophagus | ESCC | 5.45e-16 | 5.25e-01 | 0.067 |
| 144363 | ETFRF1 | LZE20T | Human | Esophagus | ESCC | 6.96e-12 | 3.71e-01 | 0.0662 |
| 144363 | ETFRF1 | LZE22D1 | Human | Esophagus | HGIN | 1.24e-04 | 2.56e-01 | 0.0595 |
| 144363 | ETFRF1 | LZE24T | Human | Esophagus | ESCC | 2.14e-21 | 4.56e-01 | 0.0596 |
| 144363 | ETFRF1 | LZE21T | Human | Esophagus | ESCC | 6.52e-03 | 2.30e-01 | 0.0655 |
| 144363 | ETFRF1 | LZE6T | Human | Esophagus | ESCC | 5.35e-04 | 2.04e-01 | 0.0845 |
| 144363 | ETFRF1 | NAFLD1 | Human | Liver | NAFLD | 5.99e-03 | 3.51e-01 | -0.04 |
| 144363 | ETFRF1 | HCC1 | Human | Liver | HCC | 1.17e-04 | 2.60e+00 | 0.5336 |
| 144363 | ETFRF1 | S014 | Human | Liver | HCC | 1.70e-21 | 6.04e-01 | 0.2254 |
| 144363 | ETFRF1 | S015 | Human | Liver | HCC | 9.18e-14 | 5.75e-01 | 0.2375 |
| 144363 | ETFRF1 | S016 | Human | Liver | HCC | 1.39e-20 | 5.55e-01 | 0.2243 |
| 144363 | ETFRF1 | S027 | Human | Liver | HCC | 3.07e-08 | 5.23e-01 | 0.2446 |
| 144363 | ETFRF1 | S028 | Human | Liver | HCC | 1.27e-21 | 6.82e-01 | 0.2503 |
| 144363 | ETFRF1 | S029 | Human | Liver | HCC | 2.91e-24 | 8.52e-01 | 0.2581 |
| 144363 | ETFRF1 | male-WTA | Human | Thyroid | PTC | 3.28e-16 | 1.87e-01 | 0.1037 |
| 144363 | ETFRF1 | PTC01 | Human | Thyroid | PTC | 1.45e-16 | 3.40e-01 | 0.1899 |
| 144363 | ETFRF1 | PTC04 | Human | Thyroid | PTC | 2.31e-12 | 2.85e-01 | 0.1927 |
| Page: 1 2 |
| Tissue | Expression Dynamics | Abbreviation |
| Liver | 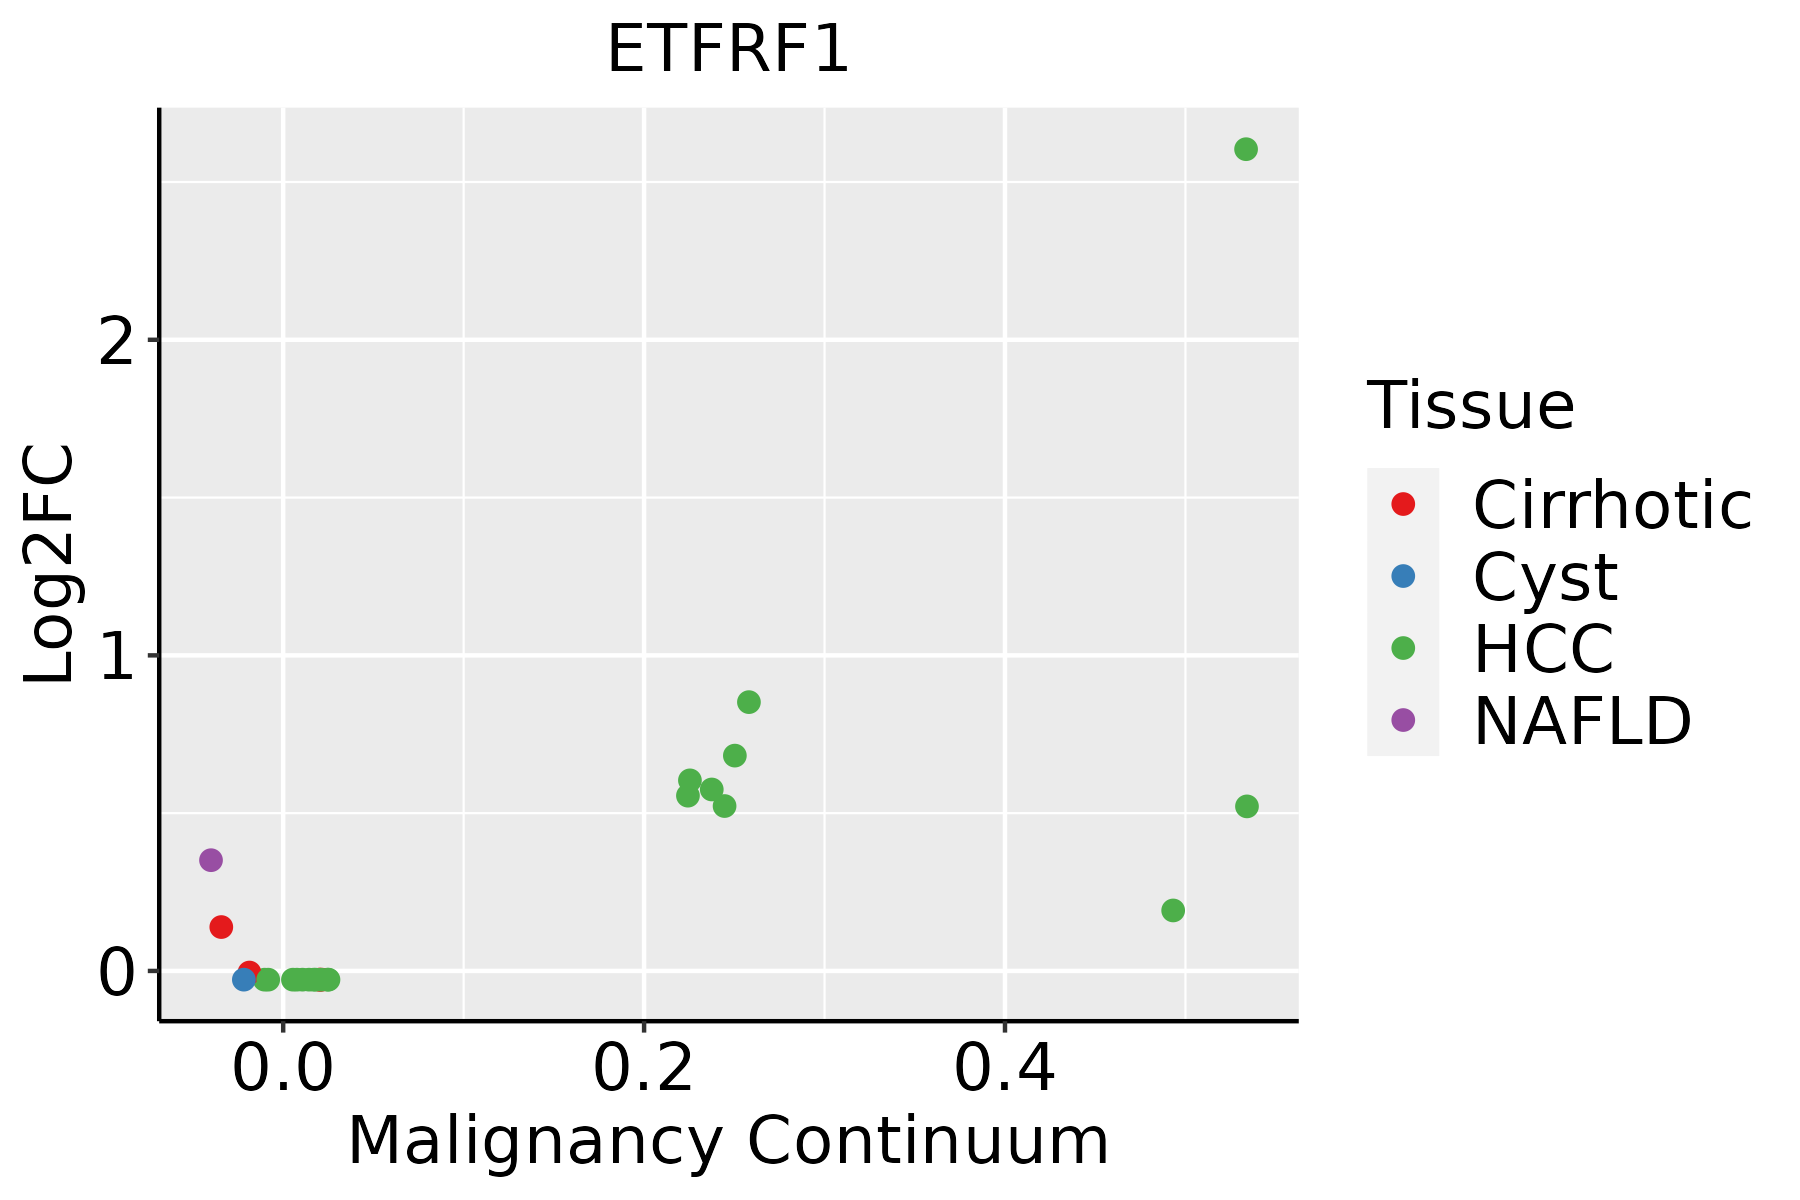 | HCC: Hepatocellular carcinoma |
| NAFLD: Non-alcoholic fatty liver disease | ||
| Thyroid | 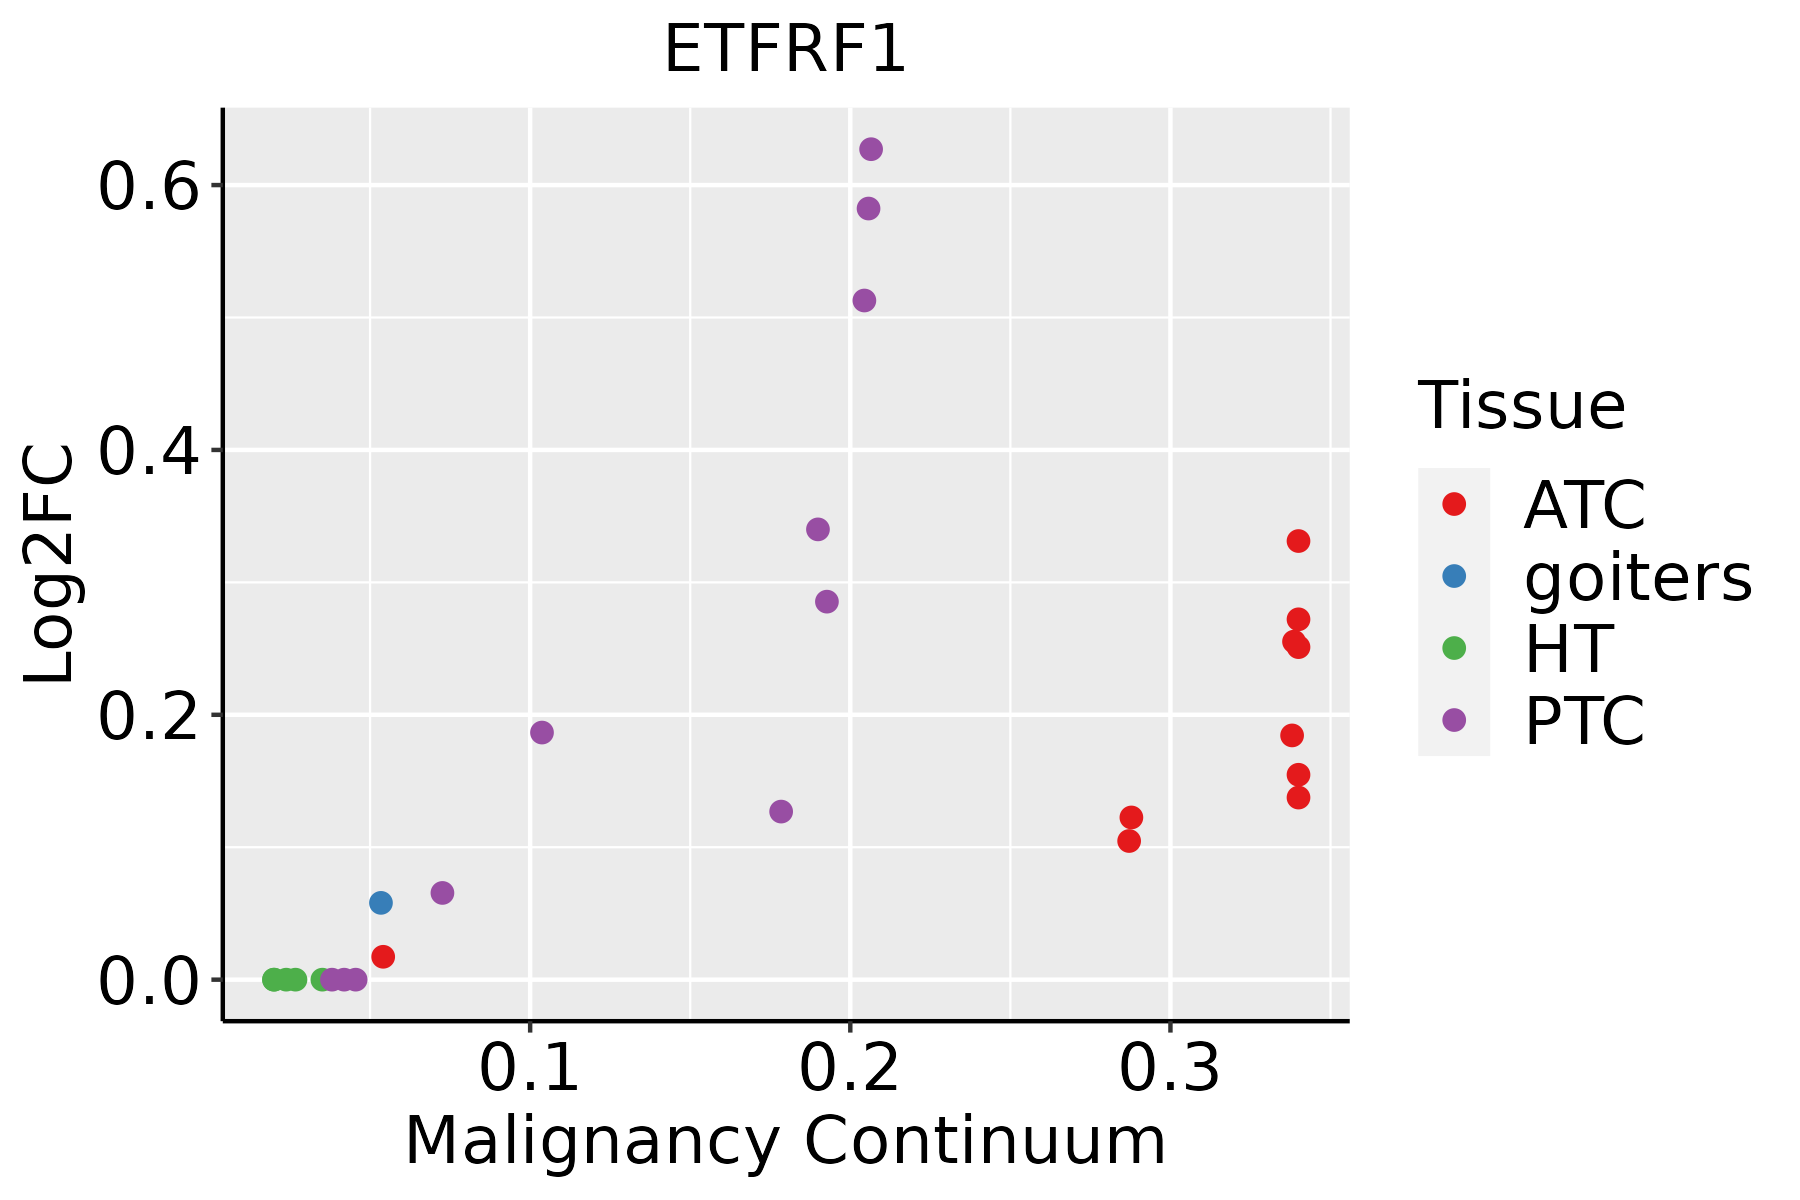 | ATC: Anaplastic thyroid cancer |
| HT: Hashimoto's thyroiditis | ||
| PTC: Papillary thyroid cancer |
| ∗log2FC in expression of this searched gene in stem-like cells from each diseased tissue sample relative to stem-like cells in normal samples in each tissue plotted against the malignancy continuum. Samples are colored based on if they are from different disease stage. |
Top |
Malignant transformation related pathway analysis |
| Find out the enriched GO biological processes and KEGG pathways involved in transition from healthy to precancer to cancer |
| Tissue | Disease Stage | Enriched GO biological Processes |
| Colorectum | AD |  |
| Colorectum | SER |  |
| Colorectum | MSS |  |
| Colorectum | MSI-H |  |
| Colorectum | FAP |  |
| ∗Top 15 enriched GO BP terms are showed in the bar plot of each disease state in each tissue. Each row represents a significant GO biological process which is colored according to the -log10(p.adjust). |
| Page: 1 2 3 4 5 6 7 8 9 |
| GO ID | Tissue | Disease Stage | Description | Gene Ratio | Bg Ratio | pvalue | p.adjust | Count |
| GO:00060917 | Liver | NAFLD | generation of precursor metabolites and energy | 84/1882 | 490/18723 | 7.03e-07 | 3.95e-05 | 84 |
| GO:00159807 | Liver | NAFLD | energy derivation by oxidation of organic compounds | 48/1882 | 318/18723 | 2.78e-03 | 2.54e-02 | 48 |
| GO:00229007 | Liver | NAFLD | electron transport chain | 29/1882 | 175/18723 | 4.87e-03 | 3.84e-02 | 29 |
| GO:000609122 | Liver | HCC | generation of precursor metabolites and energy | 340/7958 | 490/18723 | 4.04e-34 | 2.85e-31 | 340 |
| GO:004533312 | Liver | HCC | cellular respiration | 171/7958 | 230/18723 | 6.35e-23 | 1.26e-20 | 171 |
| GO:001598022 | Liver | HCC | energy derivation by oxidation of organic compounds | 221/7958 | 318/18723 | 1.02e-22 | 1.86e-20 | 221 |
| GO:002290022 | Liver | HCC | electron transport chain | 134/7958 | 175/18723 | 3.32e-20 | 4.68e-18 | 134 |
| GO:002290412 | Liver | HCC | respiratory electron transport chain | 89/7958 | 114/18723 | 8.68e-15 | 5.73e-13 | 89 |
| GO:0006091112 | Thyroid | PTC | generation of precursor metabolites and energy | 252/5968 | 490/18723 | 8.24e-20 | 1.13e-17 | 252 |
| GO:0045333112 | Thyroid | PTC | cellular respiration | 140/5968 | 230/18723 | 9.60e-20 | 1.26e-17 | 140 |
| GO:0015980111 | Thyroid | PTC | energy derivation by oxidation of organic compounds | 176/5968 | 318/18723 | 2.67e-18 | 2.90e-16 | 176 |
| GO:0022904111 | Thyroid | PTC | respiratory electron transport chain | 76/5968 | 114/18723 | 2.34e-14 | 1.50e-12 | 76 |
| GO:0022900111 | Thyroid | PTC | electron transport chain | 104/5968 | 175/18723 | 4.68e-14 | 2.79e-12 | 104 |
| GO:000609134 | Thyroid | ATC | generation of precursor metabolites and energy | 256/6293 | 490/18723 | 6.55e-18 | 7.69e-16 | 256 |
| GO:004533333 | Thyroid | ATC | cellular respiration | 140/6293 | 230/18723 | 1.76e-17 | 1.89e-15 | 140 |
| GO:001598034 | Thyroid | ATC | energy derivation by oxidation of organic compounds | 177/6293 | 318/18723 | 3.60e-16 | 2.92e-14 | 177 |
| GO:002290034 | Thyroid | ATC | electron transport chain | 106/6293 | 175/18723 | 2.20e-13 | 1.06e-11 | 106 |
| GO:002290433 | Thyroid | ATC | respiratory electron transport chain | 76/6293 | 114/18723 | 5.17e-13 | 2.30e-11 | 76 |
| Page: 1 |
| Pathway ID | Tissue | Disease Stage | Description | Gene Ratio | Bg Ratio | pvalue | p.adjust | qvalue | Count |
| Page: 1 |
Top |
Cell-cell communication analysis |
| Identification of potential cell-cell interactions between two cell types and their ligand-receptor pairs for different disease states |
| Ligand | Receptor | LRpair | Pathway | Tissue | Disease Stage |
| Page: 1 |
Top |
Single-cell gene regulatory network inference analysis |
| Find out the significant the regulons (TFs) and the target genes of each regulon across cell types for different disease states |
| TF | Cell Type | Tissue | Disease Stage | Target Gene | RSS | Regulon Activity |
| ∗The dot plots of a searched regulon are shown for all cell subpopulations in each disease state of each tissue based on the regulon specific score inferred using pySCENIC and by calculating the average expression. |
| Page: 1 |
Top |
Somatic mutation of malignant transformation related genes |
| Annotation of somatic variants for genes involved in malignant transformation |
| Hugo Symbol | Variant Class | Variant Classification | dbSNP RS | HGVSc | HGVSp | HGVSp Short | SWISSPROT | BIOTYPE | SIFT | PolyPhen | Tumor Sample Barcode | Tissue | Histology | Sex | Age | Stage | Therapy Types | Drugs | Outcome |
| ETFRF1 | SNV | Missense_Mutation | novel | c.142N>G | p.Asn48Asp | p.N48D | Q6IPR1 | protein_coding | tolerated(1) | benign(0) | TCGA-AC-A62Y-01 | Breast | breast invasive carcinoma | Female | >=65 | I/II | Unknown | Unknown | SD |
| ETFRF1 | SNV | Missense_Mutation | novel | c.156N>G | p.Ile52Met | p.I52M | Q6IPR1 | protein_coding | deleterious(0) | probably_damaging(0.971) | TCGA-OL-A5D6-01 | Breast | breast invasive carcinoma | Female | >=65 | I/II | Unknown | Unknown | SD |
| ETFRF1 | SNV | Missense_Mutation | rs754155801 | c.17N>A | p.Ser6Tyr | p.S6Y | Q6IPR1 | protein_coding | deleterious(0.01) | benign(0.443) | TCGA-AA-3984-01 | Colorectum | colon adenocarcinoma | Female | <65 | I/II | Unknown | Unknown | SD |
| ETFRF1 | SNV | Missense_Mutation | c.178N>A | p.Glu60Lys | p.E60K | Q6IPR1 | protein_coding | tolerated(0.1) | benign(0.012) | TCGA-AA-A010-01 | Colorectum | colon adenocarcinoma | Female | <65 | I/II | Chemotherapy | folinic | CR | |
| ETFRF1 | SNV | Missense_Mutation | c.263N>C | p.Lys88Thr | p.K88T | Q6IPR1 | protein_coding | tolerated_low_confidence(0.05) | benign(0.005) | TCGA-A5-A2K5-01 | Endometrium | uterine corpus endometrioid carcinoma | Female | >=65 | I/II | Unknown | Unknown | SD | |
| ETFRF1 | SNV | Missense_Mutation | novel | c.61C>A | p.Leu21Ile | p.L21I | Q6IPR1 | protein_coding | deleterious(0.03) | benign(0.251) | TCGA-AP-A1DV-01 | Endometrium | uterine corpus endometrioid carcinoma | Female | <65 | I/II | Unknown | Unknown | SD |
| ETFRF1 | SNV | Missense_Mutation | rs568753362 | c.242G>A | p.Arg81His | p.R81H | Q6IPR1 | protein_coding | deleterious(0) | benign(0.393) | TCGA-BS-A0UV-01 | Endometrium | uterine corpus endometrioid carcinoma | Female | <65 | III/IV | Unknown | Unknown | SD |
| ETFRF1 | SNV | Missense_Mutation | novel | c.181N>C | p.Phe61Leu | p.F61L | Q6IPR1 | protein_coding | deleterious(0.01) | possibly_damaging(0.557) | TCGA-98-8023-01 | Lung | lung squamous cell carcinoma | Male | >=65 | III/IV | Unknown | Unknown | SD |
| Page: 1 |
Top |
Related drugs of malignant transformation related genes |
| Identification of chemicals and drugs interact with genes involved in malignant transfromation |
| (DGIdb 4.0) |
| Entrez ID | Symbol | Category | Interaction Types | Drug Claim Name | Drug Name | PMIDs |
| Page: 1 |

Copyright 2023-Present -The University of Texas Health Science Center at Houston |