
|
|||||
|
 | |
| |
| |
| |
| |
| |
|
Gene: ETFDH |
Gene summary for ETFDH |
| Gene information | Species | Human | Gene symbol | ETFDH | Gene ID | 2110 |
| Gene name | electron transfer flavoprotein dehydrogenase | |
| Gene Alias | ETFQO | |
| Cytomap | 4q32.1 | |
| Gene Type | protein-coding | GO ID | GO:0006082 | UniProtAcc | B4DEQ0 |
Top |
Malignant transformation analysis |
| Identification of the aberrant gene expression in precancerous and cancerous lesions by comparing the gene expression of stem-like cells in diseased tissues with normal stem cells |
| Entrez ID | Symbol | Replicates | Species | Organ | Tissue | Adj P-value | Log2FC | Malignancy |
| 2110 | ETFDH | LZE4T | Human | Esophagus | ESCC | 5.73e-16 | 4.01e-01 | 0.0811 |
| 2110 | ETFDH | LZE5T | Human | Esophagus | ESCC | 4.21e-02 | 1.99e-01 | 0.0514 |
| 2110 | ETFDH | LZE8T | Human | Esophagus | ESCC | 3.90e-05 | 1.41e-01 | 0.067 |
| 2110 | ETFDH | LZE20T | Human | Esophagus | ESCC | 3.06e-11 | 2.21e-01 | 0.0662 |
| 2110 | ETFDH | LZE24T | Human | Esophagus | ESCC | 2.09e-12 | 1.84e-01 | 0.0596 |
| 2110 | ETFDH | LZE21T | Human | Esophagus | ESCC | 1.26e-03 | 1.01e-01 | 0.0655 |
| 2110 | ETFDH | LZE6T | Human | Esophagus | ESCC | 1.85e-05 | 9.07e-02 | 0.0845 |
| 2110 | ETFDH | P1T-E | Human | Esophagus | ESCC | 2.16e-13 | 6.82e-01 | 0.0875 |
| 2110 | ETFDH | P2T-E | Human | Esophagus | ESCC | 9.55e-28 | 4.21e-01 | 0.1177 |
| 2110 | ETFDH | P4T-E | Human | Esophagus | ESCC | 3.90e-15 | 2.82e-01 | 0.1323 |
| 2110 | ETFDH | P5T-E | Human | Esophagus | ESCC | 2.23e-06 | 1.24e-02 | 0.1327 |
| 2110 | ETFDH | P8T-E | Human | Esophagus | ESCC | 6.62e-19 | 2.73e-01 | 0.0889 |
| 2110 | ETFDH | P9T-E | Human | Esophagus | ESCC | 1.03e-16 | 1.66e-01 | 0.1131 |
| 2110 | ETFDH | P10T-E | Human | Esophagus | ESCC | 4.05e-17 | 1.52e-01 | 0.116 |
| 2110 | ETFDH | P11T-E | Human | Esophagus | ESCC | 5.10e-09 | 3.59e-01 | 0.1426 |
| 2110 | ETFDH | P12T-E | Human | Esophagus | ESCC | 8.94e-36 | 6.48e-01 | 0.1122 |
| 2110 | ETFDH | P15T-E | Human | Esophagus | ESCC | 1.03e-20 | 2.75e-01 | 0.1149 |
| 2110 | ETFDH | P16T-E | Human | Esophagus | ESCC | 8.55e-19 | 2.64e-01 | 0.1153 |
| 2110 | ETFDH | P17T-E | Human | Esophagus | ESCC | 1.39e-07 | 1.57e-01 | 0.1278 |
| 2110 | ETFDH | P20T-E | Human | Esophagus | ESCC | 1.21e-29 | 3.41e-01 | 0.1124 |
| Page: 1 2 3 4 |
| Tissue | Expression Dynamics | Abbreviation |
| Esophagus | 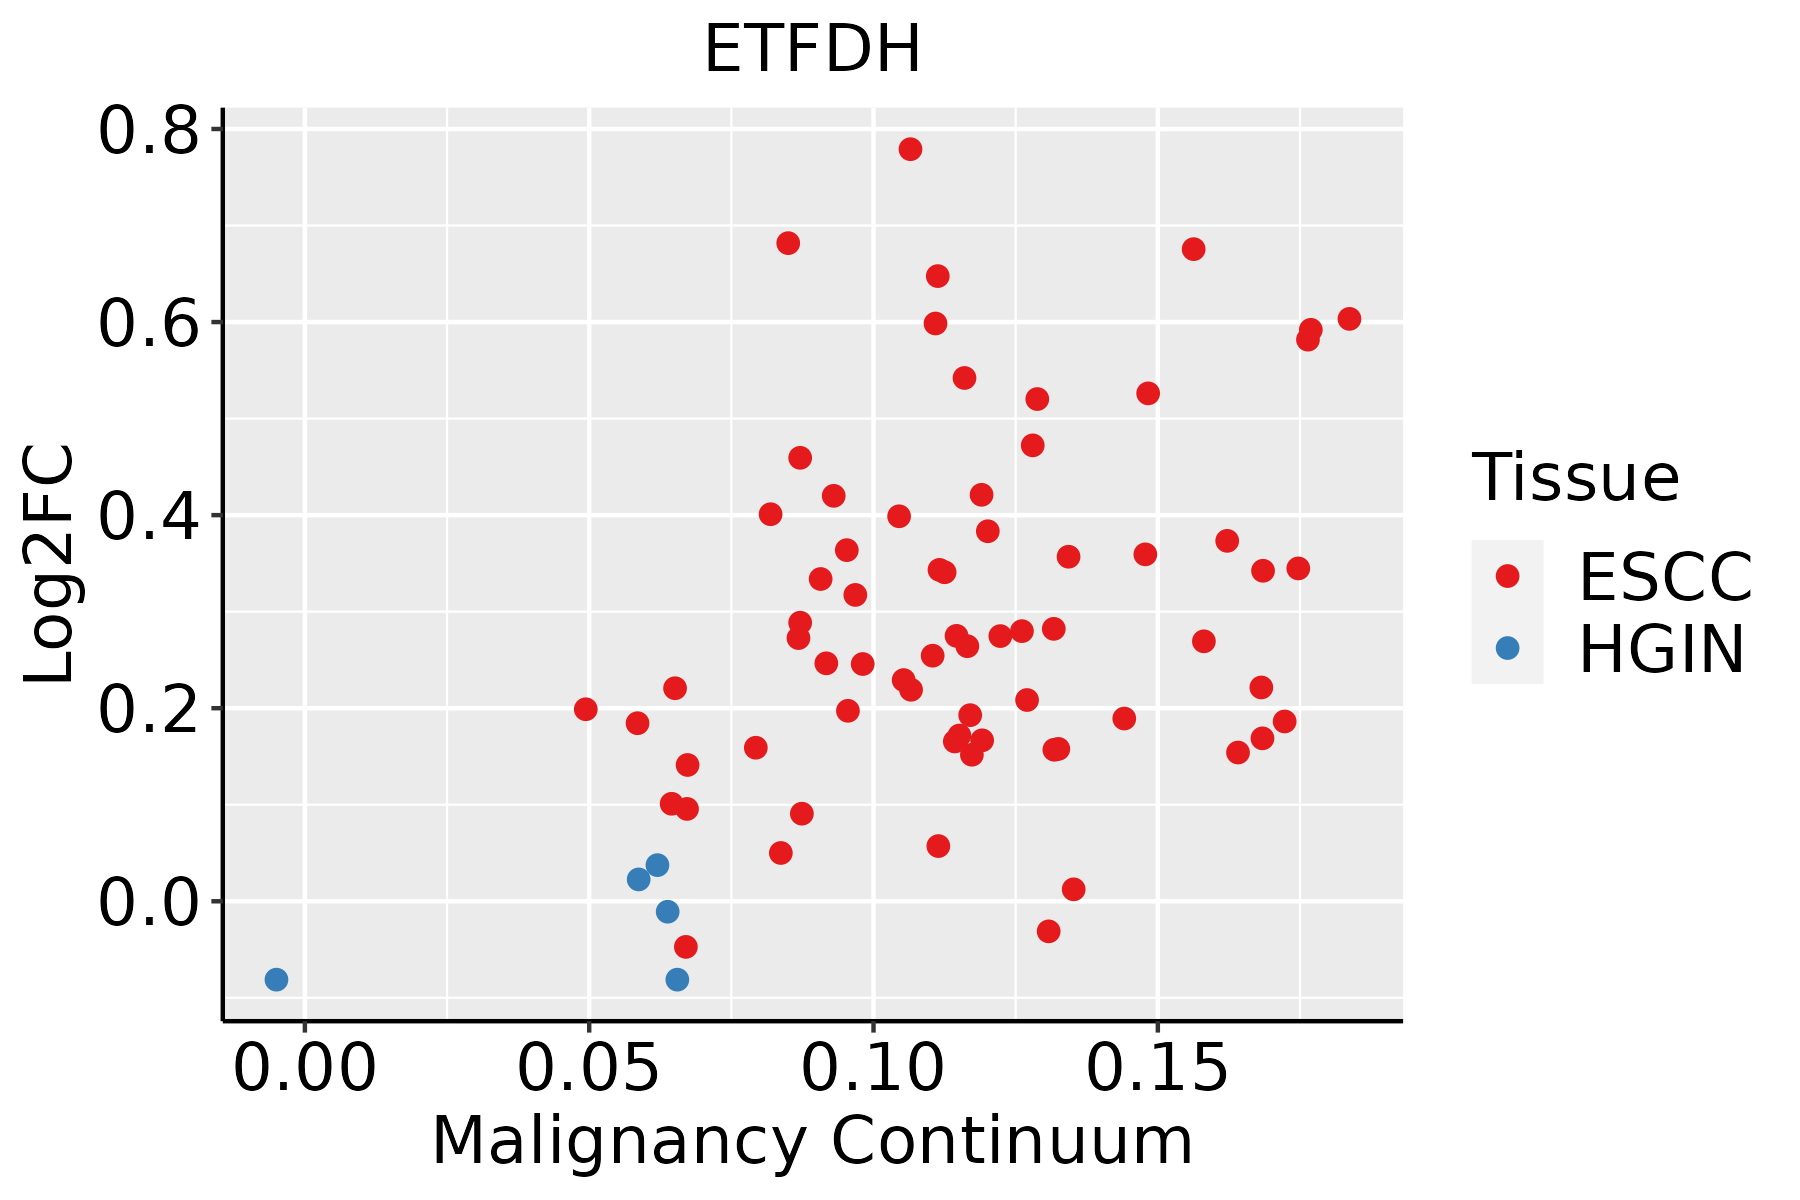 | ESCC: Esophageal squamous cell carcinoma |
| HGIN: High-grade intraepithelial neoplasias | ||
| LGIN: Low-grade intraepithelial neoplasias | ||
| Liver | 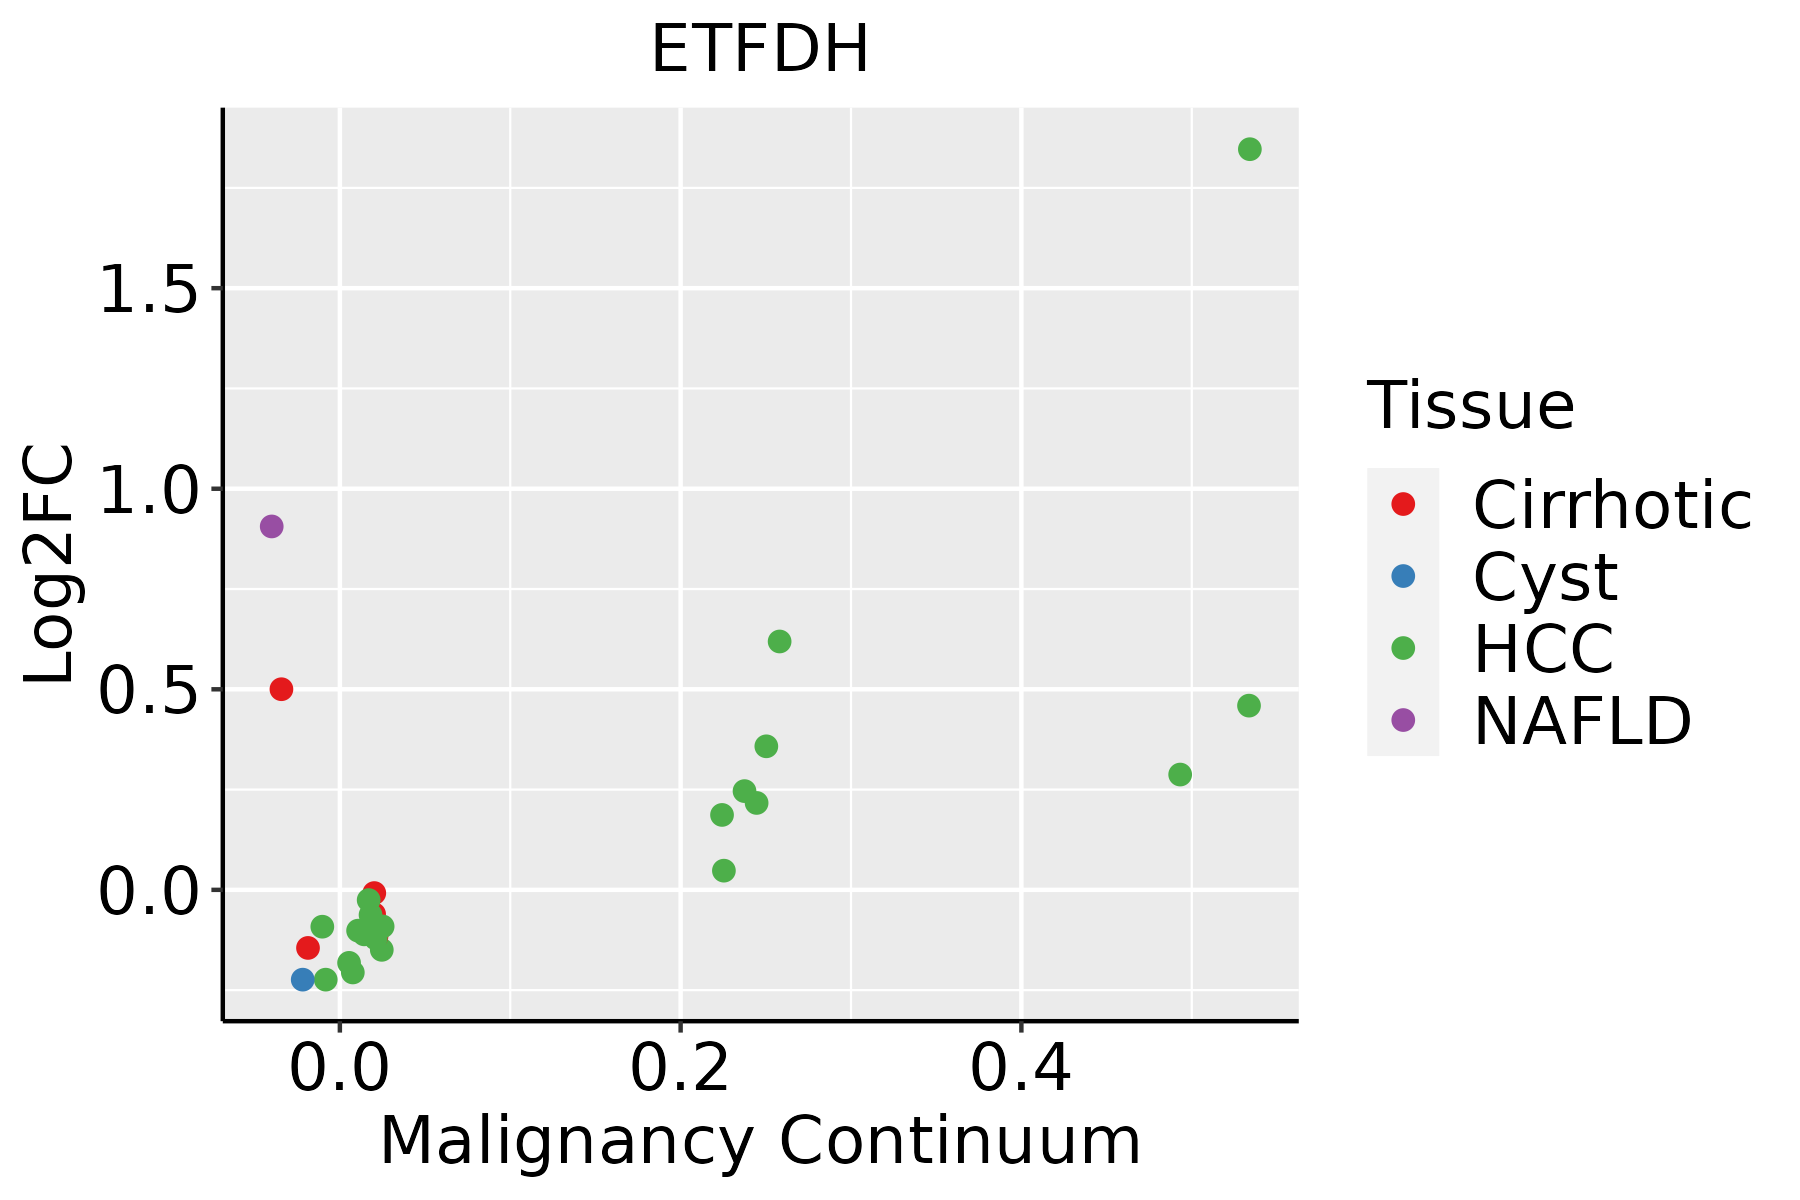 | HCC: Hepatocellular carcinoma |
| NAFLD: Non-alcoholic fatty liver disease |
| ∗log2FC in expression of this searched gene in stem-like cells from each diseased tissue sample relative to stem-like cells in normal samples in each tissue plotted against the malignancy continuum. Samples are colored based on if they are from different disease stage. |
Top |
Malignant transformation related pathway analysis |
| Find out the enriched GO biological processes and KEGG pathways involved in transition from healthy to precancer to cancer |
| Tissue | Disease Stage | Enriched GO biological Processes |
| Colorectum | AD |  |
| Colorectum | SER |  |
| Colorectum | MSS |  |
| Colorectum | MSI-H |  |
| Colorectum | FAP |  |
| ∗Top 15 enriched GO BP terms are showed in the bar plot of each disease state in each tissue. Each row represents a significant GO biological process which is colored according to the -log10(p.adjust). |
| Page: 1 2 3 4 5 6 7 8 9 |
| GO ID | Tissue | Disease Stage | Description | Gene Ratio | Bg Ratio | pvalue | p.adjust | Count |
| GO:0006091110 | Esophagus | ESCC | generation of precursor metabolites and energy | 331/8552 | 490/18723 | 3.86e-23 | 8.45e-21 | 331 |
| GO:0006979111 | Esophagus | ESCC | response to oxidative stress | 303/8552 | 446/18723 | 7.15e-22 | 1.30e-19 | 303 |
| GO:0045333110 | Esophagus | ESCC | cellular respiration | 173/8552 | 230/18723 | 4.53e-20 | 5.99e-18 | 173 |
| GO:0015980110 | Esophagus | ESCC | energy derivation by oxidation of organic compounds | 220/8552 | 318/18723 | 1.20e-17 | 1.09e-15 | 220 |
| GO:0022900110 | Esophagus | ESCC | electron transport chain | 133/8552 | 175/18723 | 2.18e-16 | 1.67e-14 | 133 |
| GO:0022904110 | Esophagus | ESCC | respiratory electron transport chain | 89/8552 | 114/18723 | 1.36e-12 | 5.80e-11 | 89 |
| GO:00193958 | Esophagus | ESCC | fatty acid oxidation | 69/8552 | 103/18723 | 9.95e-06 | 9.44e-05 | 69 |
| GO:00344407 | Esophagus | ESCC | lipid oxidation | 71/8552 | 108/18723 | 2.00e-05 | 1.74e-04 | 71 |
| GO:00090628 | Esophagus | ESCC | fatty acid catabolic process | 66/8552 | 100/18723 | 3.21e-05 | 2.66e-04 | 66 |
| GO:00066318 | Esophagus | ESCC | fatty acid metabolic process | 217/8552 | 390/18723 | 4.21e-05 | 3.39e-04 | 217 |
| GO:00066358 | Esophagus | ESCC | fatty acid beta-oxidation | 50/8552 | 74/18723 | 1.16e-04 | 8.04e-04 | 50 |
| GO:00723297 | Esophagus | ESCC | monocarboxylic acid catabolic process | 74/8552 | 122/18723 | 6.03e-04 | 3.27e-03 | 74 |
| GO:00442427 | Esophagus | ESCC | cellular lipid catabolic process | 121/8552 | 214/18723 | 8.63e-04 | 4.43e-03 | 121 |
| GO:00442827 | Esophagus | ESCC | small molecule catabolic process | 201/8552 | 376/18723 | 1.35e-03 | 6.41e-03 | 201 |
| GO:00302586 | Esophagus | ESCC | lipid modification | 116/8552 | 212/18723 | 4.90e-03 | 1.89e-02 | 116 |
| GO:00160427 | Esophagus | ESCC | lipid catabolic process | 168/8552 | 320/18723 | 7.97e-03 | 2.84e-02 | 168 |
| GO:00463953 | Liver | NAFLD | carboxylic acid catabolic process | 73/1882 | 236/18723 | 4.16e-19 | 1.22e-15 | 73 |
| GO:00160544 | Liver | NAFLD | organic acid catabolic process | 73/1882 | 240/18723 | 1.20e-18 | 2.34e-15 | 73 |
| GO:00442825 | Liver | NAFLD | small molecule catabolic process | 91/1882 | 376/18723 | 8.96e-16 | 1.31e-12 | 91 |
| GO:00066316 | Liver | NAFLD | fatty acid metabolic process | 92/1882 | 390/18723 | 3.38e-15 | 3.29e-12 | 92 |
| Page: 1 2 3 4 |
| Pathway ID | Tissue | Disease Stage | Description | Gene Ratio | Bg Ratio | pvalue | p.adjust | qvalue | Count |
| Page: 1 |
Top |
Cell-cell communication analysis |
| Identification of potential cell-cell interactions between two cell types and their ligand-receptor pairs for different disease states |
| Ligand | Receptor | LRpair | Pathway | Tissue | Disease Stage |
| Page: 1 |
Top |
Single-cell gene regulatory network inference analysis |
| Find out the significant the regulons (TFs) and the target genes of each regulon across cell types for different disease states |
| TF | Cell Type | Tissue | Disease Stage | Target Gene | RSS | Regulon Activity |
| ∗The dot plots of a searched regulon are shown for all cell subpopulations in each disease state of each tissue based on the regulon specific score inferred using pySCENIC and by calculating the average expression. |
| Page: 1 |
Top |
Somatic mutation of malignant transformation related genes |
| Annotation of somatic variants for genes involved in malignant transformation |
| Hugo Symbol | Variant Class | Variant Classification | dbSNP RS | HGVSc | HGVSp | HGVSp Short | SWISSPROT | BIOTYPE | SIFT | PolyPhen | Tumor Sample Barcode | Tissue | Histology | Sex | Age | Stage | Therapy Types | Drugs | Outcome |
| ETFDH | SNV | Missense_Mutation | novel | c.1286N>T | p.Gly429Val | p.G429V | Q16134 | protein_coding | deleterious(0.03) | probably_damaging(0.922) | TCGA-5L-AAT1-01 | Breast | breast invasive carcinoma | Female | <65 | III/IV | Hormone Therapy | letrozol | SD |
| ETFDH | SNV | Missense_Mutation | novel | c.1066G>C | p.Gly356Arg | p.G356R | Q16134 | protein_coding | deleterious(0) | probably_damaging(0.98) | TCGA-2W-A8YY-01 | Cervix | cervical & endocervical cancer | Female | <65 | I/II | Chemotherapy | cisplatin | CR |
| ETFDH | SNV | Missense_Mutation | novel | c.1588N>A | p.Glu530Lys | p.E530K | Q16134 | protein_coding | deleterious(0.01) | possibly_damaging(0.593) | TCGA-DS-A1OB-01 | Cervix | cervical & endocervical cancer | Female | <65 | I/II | Chemotherapy | carboplatin | PD |
| ETFDH | SNV | Missense_Mutation | c.49N>T | p.His17Tyr | p.H17Y | Q16134 | protein_coding | tolerated_low_confidence(0.8) | benign(0) | TCGA-EA-A50E-01 | Cervix | cervical & endocervical cancer | Female | <65 | I/II | Unknown | Unknown | PD | |
| ETFDH | SNV | Missense_Mutation | novel | c.1404N>C | p.Met468Ile | p.M468I | Q16134 | protein_coding | tolerated(0.64) | benign(0.006) | TCGA-VS-A94X-01 | Cervix | cervical & endocervical cancer | Female | <65 | I/II | Chemotherapy | cisplatin | PD |
| ETFDH | SNV | Missense_Mutation | c.1322A>G | p.Asn441Ser | p.N441S | Q16134 | protein_coding | tolerated(0.51) | benign(0) | TCGA-AA-3510-01 | Colorectum | colon adenocarcinoma | Male | >=65 | I/II | Unknown | Unknown | SD | |
| ETFDH | SNV | Missense_Mutation | novel | c.70A>C | p.Asn24His | p.N24H | Q16134 | protein_coding | tolerated(0.14) | benign(0) | TCGA-AA-3667-01 | Colorectum | colon adenocarcinoma | Female | <65 | I/II | Unknown | Unknown | SD |
| ETFDH | SNV | Missense_Mutation | c.505N>A | p.His169Asn | p.H169N | Q16134 | protein_coding | deleterious(0.01) | benign(0.247) | TCGA-AA-A010-01 | Colorectum | colon adenocarcinoma | Female | <65 | I/II | Chemotherapy | folinic | CR | |
| ETFDH | SNV | Missense_Mutation | novel | c.82N>A | p.Leu28Ile | p.L28I | Q16134 | protein_coding | tolerated(0.44) | benign(0.003) | TCGA-CA-6717-01 | Colorectum | colon adenocarcinoma | Male | <65 | I/II | Chemotherapy | oxaliplatin | CR |
| ETFDH | SNV | Missense_Mutation | c.1223T>G | p.Ile408Ser | p.I408S | Q16134 | protein_coding | deleterious(0.02) | benign(0.001) | TCGA-CA-6718-01 | Colorectum | colon adenocarcinoma | Male | <65 | I/II | Unknown | Unknown | PD |
| Page: 1 2 3 4 5 6 7 |
Top |
Related drugs of malignant transformation related genes |
| Identification of chemicals and drugs interact with genes involved in malignant transfromation |
| (DGIdb 4.0) |
| Entrez ID | Symbol | Category | Interaction Types | Drug Claim Name | Drug Name | PMIDs |
| 2110 | ETFDH | ENZYME | methylphenidate | METHYLPHENIDATE | 29382897 |
| Page: 1 |

Copyright 2023-Present -The University of Texas Health Science Center at Houston |