| Tissue | Expression Dynamics | Abbreviation |
| Breast | 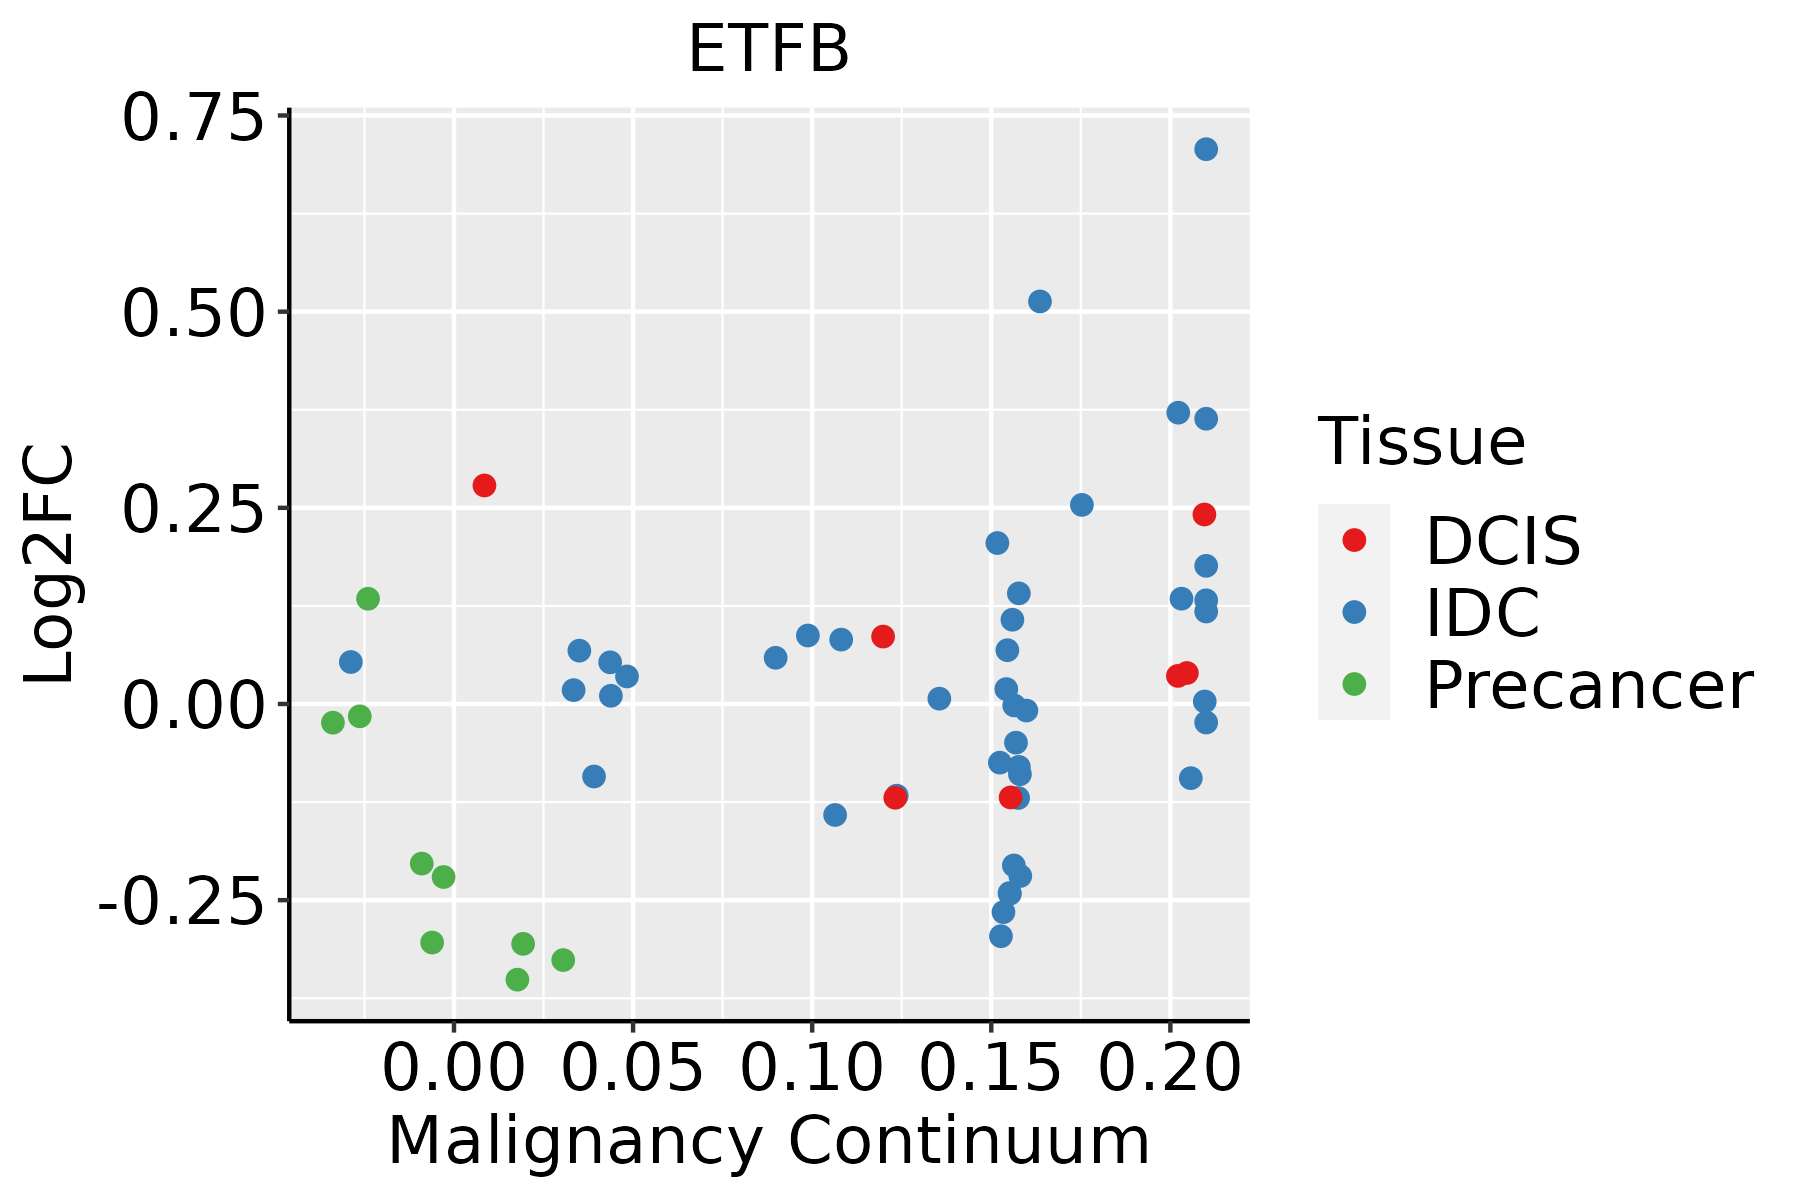 | IDC: Invasive ductal carcinoma |
| DCIS: Ductal carcinoma in situ |
| Precancer(BRCA1-mut): Precancerous lesion from BRCA1 mutation carriers |
| Cervix | 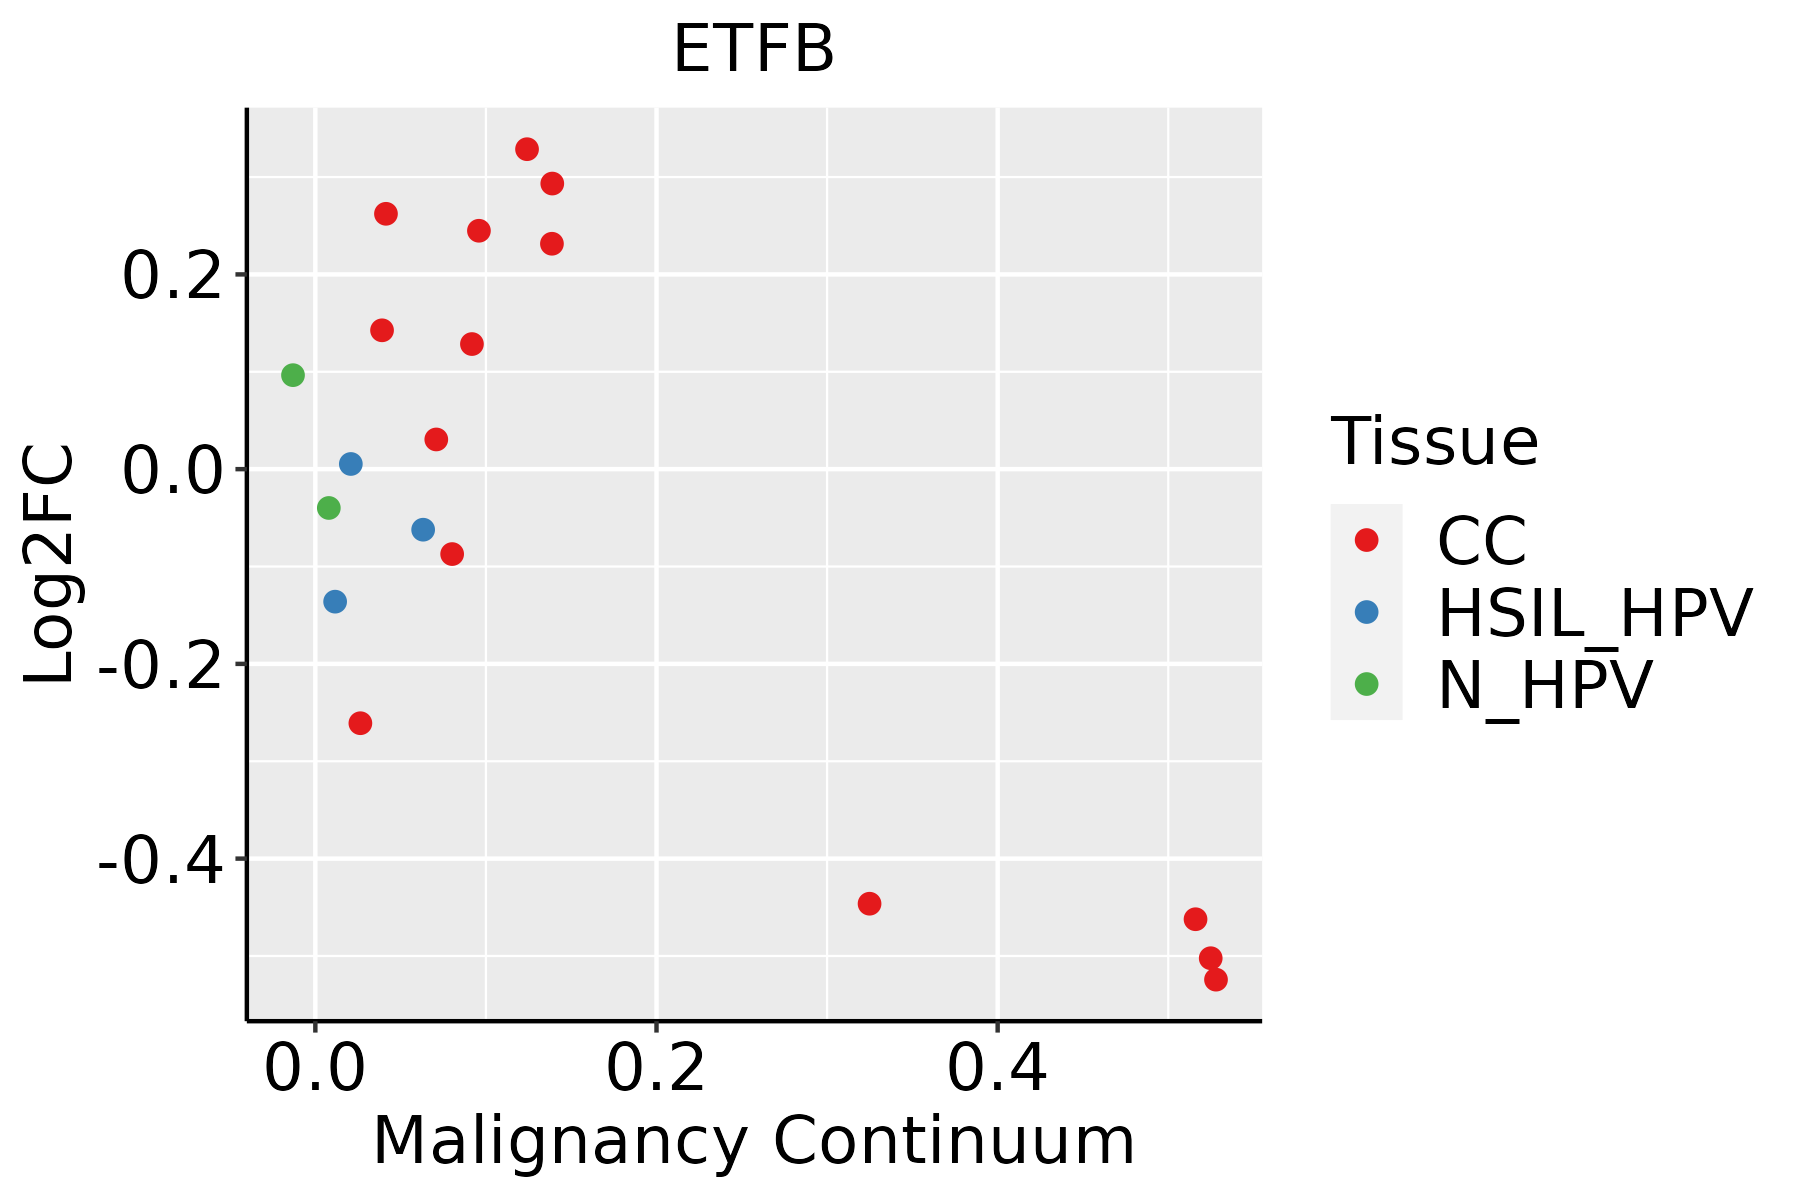 | CC: Cervix cancer |
| HSIL_HPV: HPV-infected high-grade squamous intraepithelial lesions |
| N_HPV: HPV-infected normal cervix |
| Colorectum (GSE201348) |  | FAP: Familial adenomatous polyposis |
| CRC: Colorectal cancer |
| Colorectum (HTA11) | 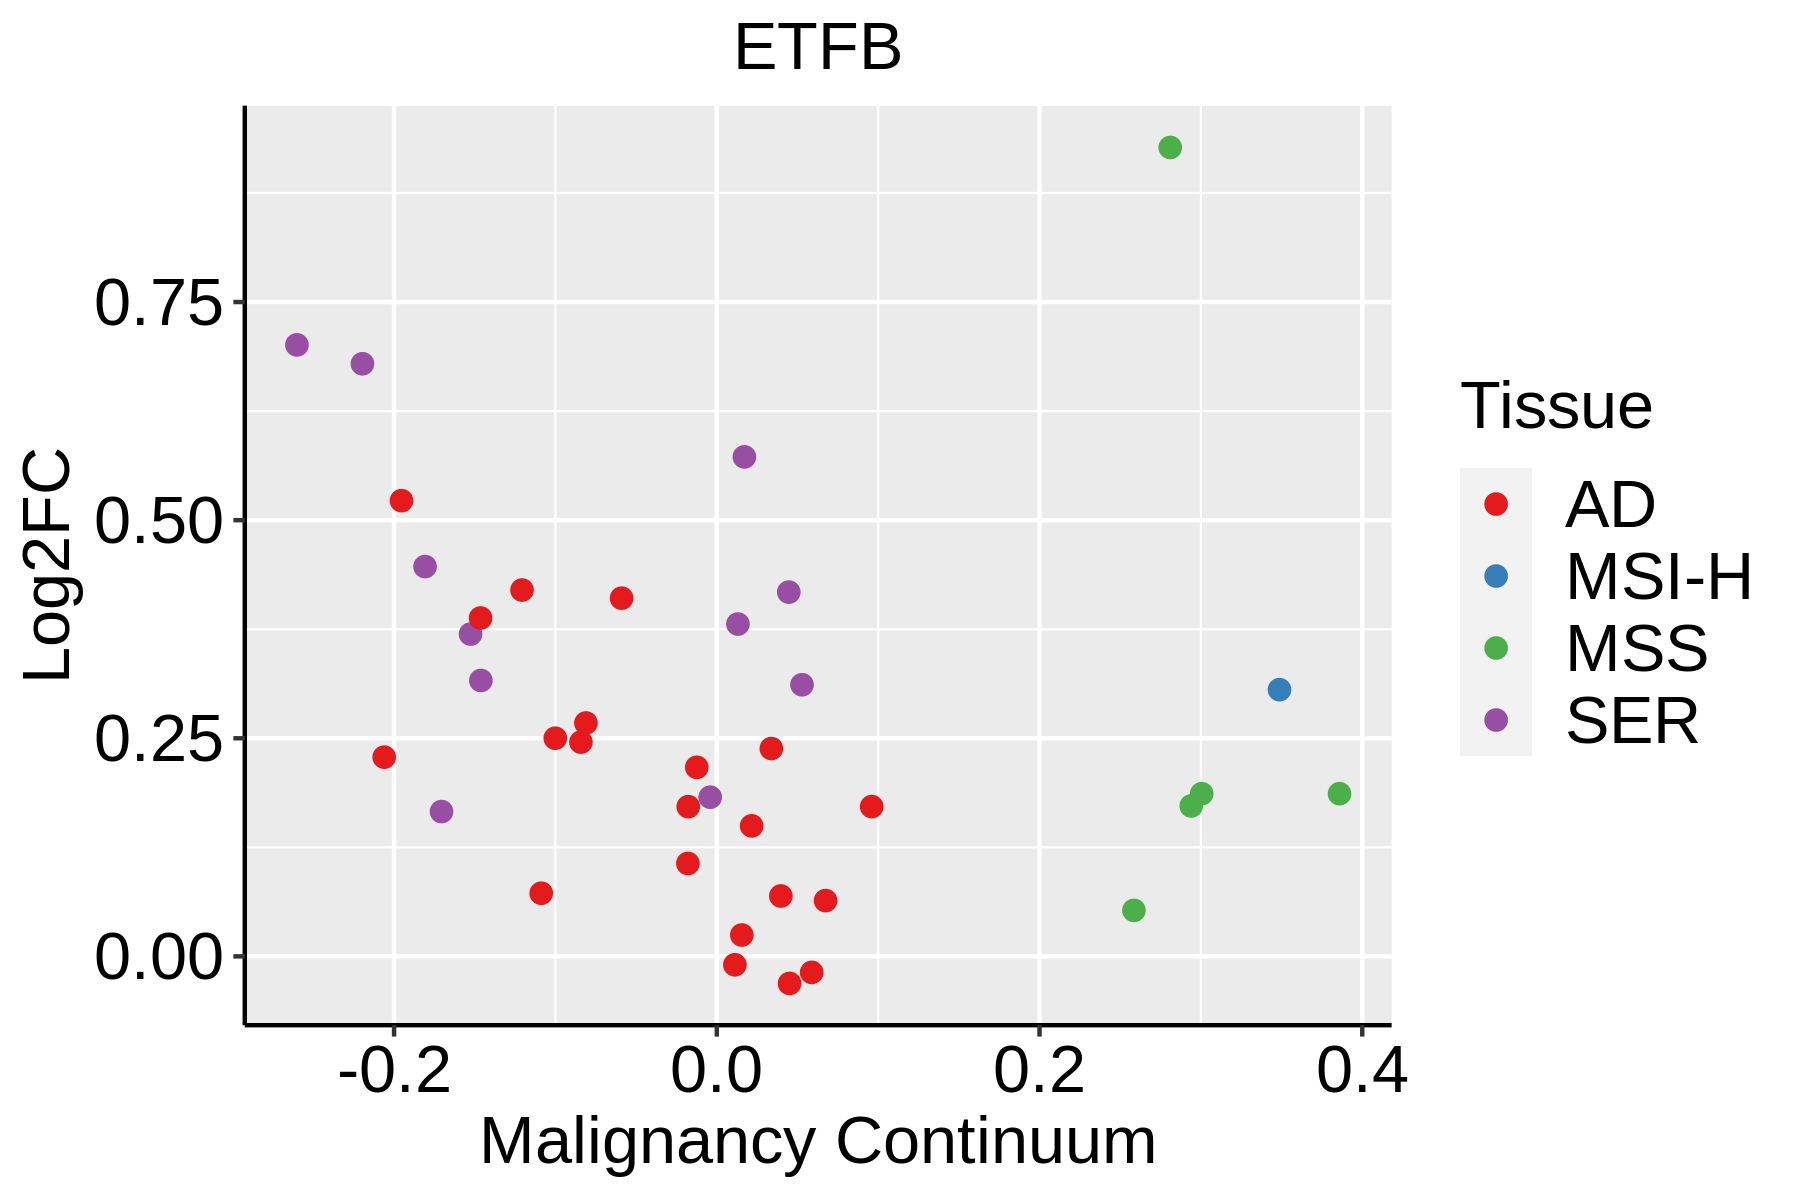 | AD: Adenomas |
| SER: Sessile serrated lesions |
| MSI-H: Microsatellite-high colorectal cancer |
| MSS: Microsatellite stable colorectal cancer |
| Esophagus |  | ESCC: Esophageal squamous cell carcinoma |
| HGIN: High-grade intraepithelial neoplasias |
| LGIN: Low-grade intraepithelial neoplasias |
| GC | 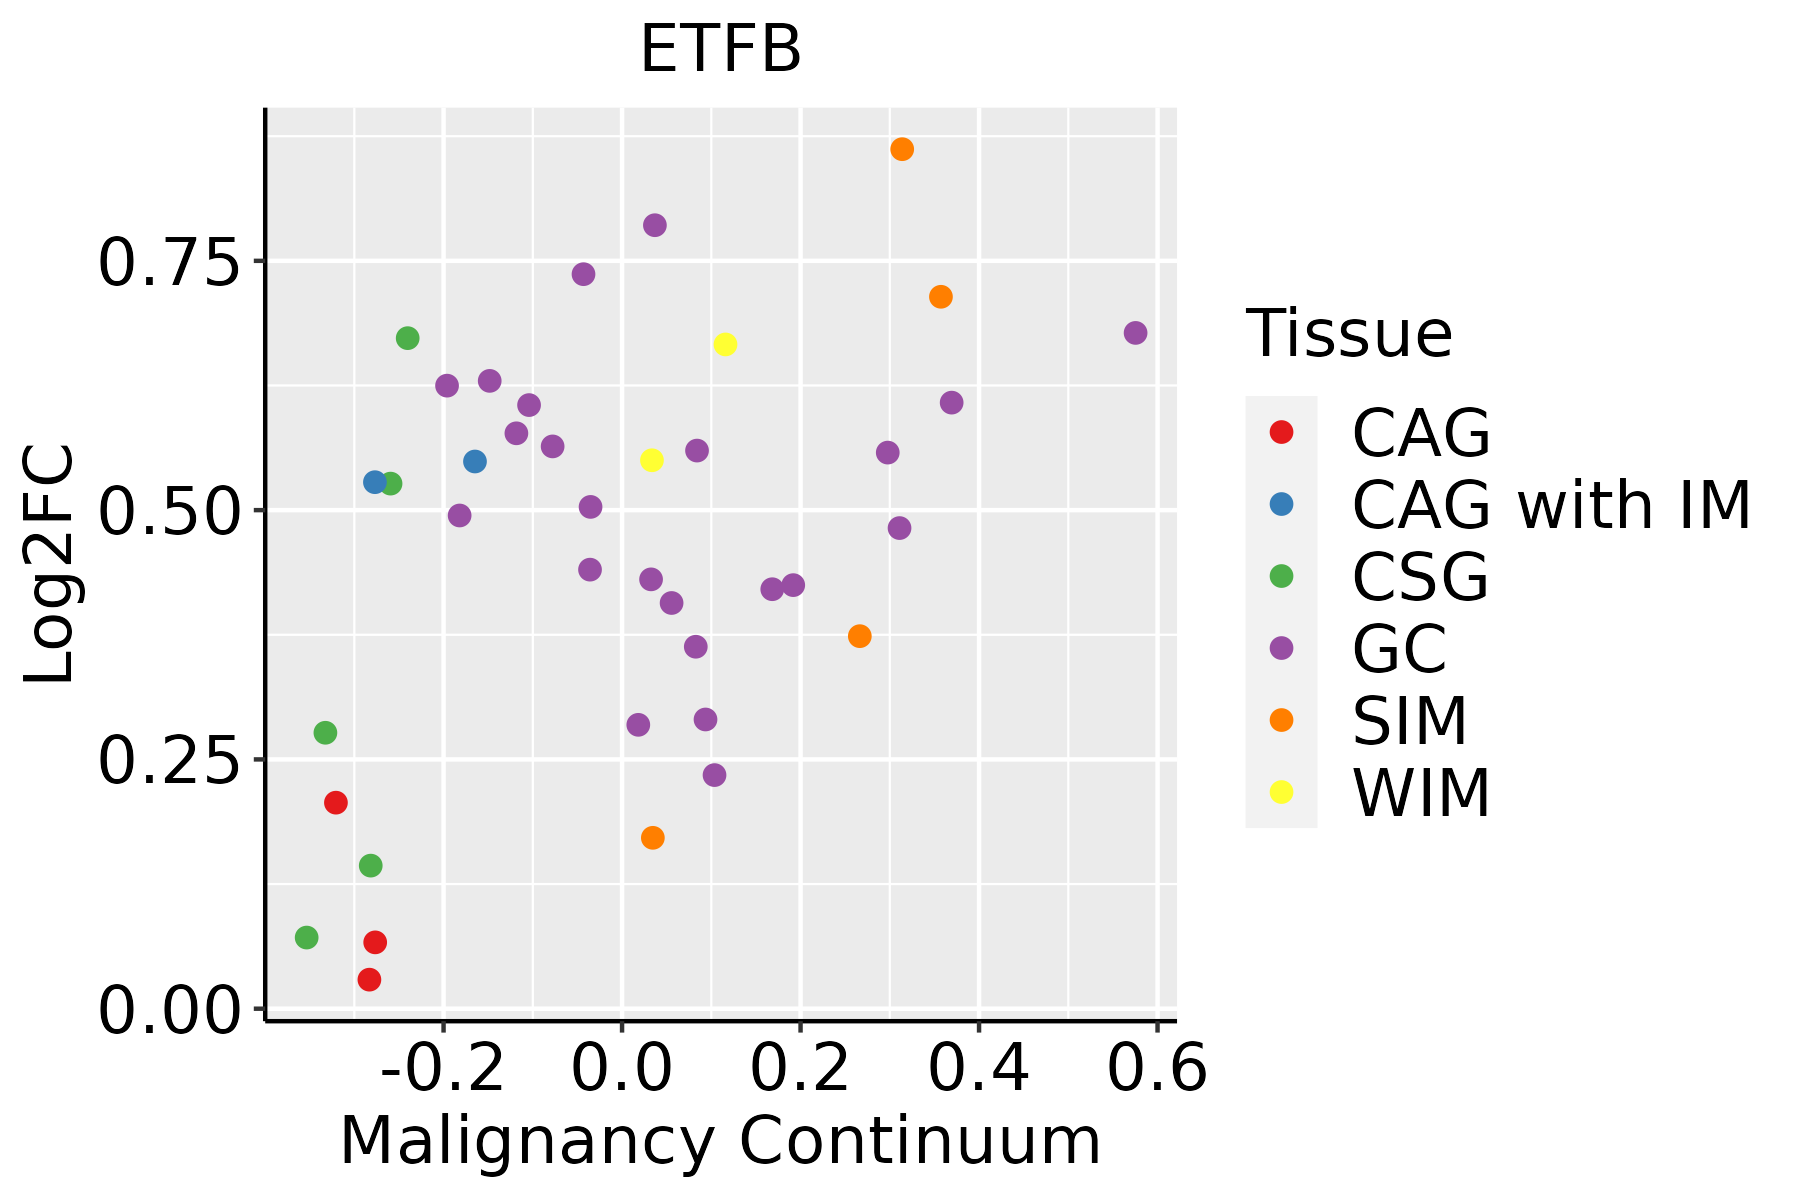 | CAG: Chronic atrophic gastritis |
| CAG with IM: Chronic atrophic gastritis with intestinal metaplasia |
| CSG: Chronic superficial gastritis |
| GC: Gastric cancer |
| SIM: Severe intestinal metaplasia |
| WIM: Wild intestinal metaplasia |
| Liver |  | HCC: Hepatocellular carcinoma |
| NAFLD: Non-alcoholic fatty liver disease |
| Oral Cavity | 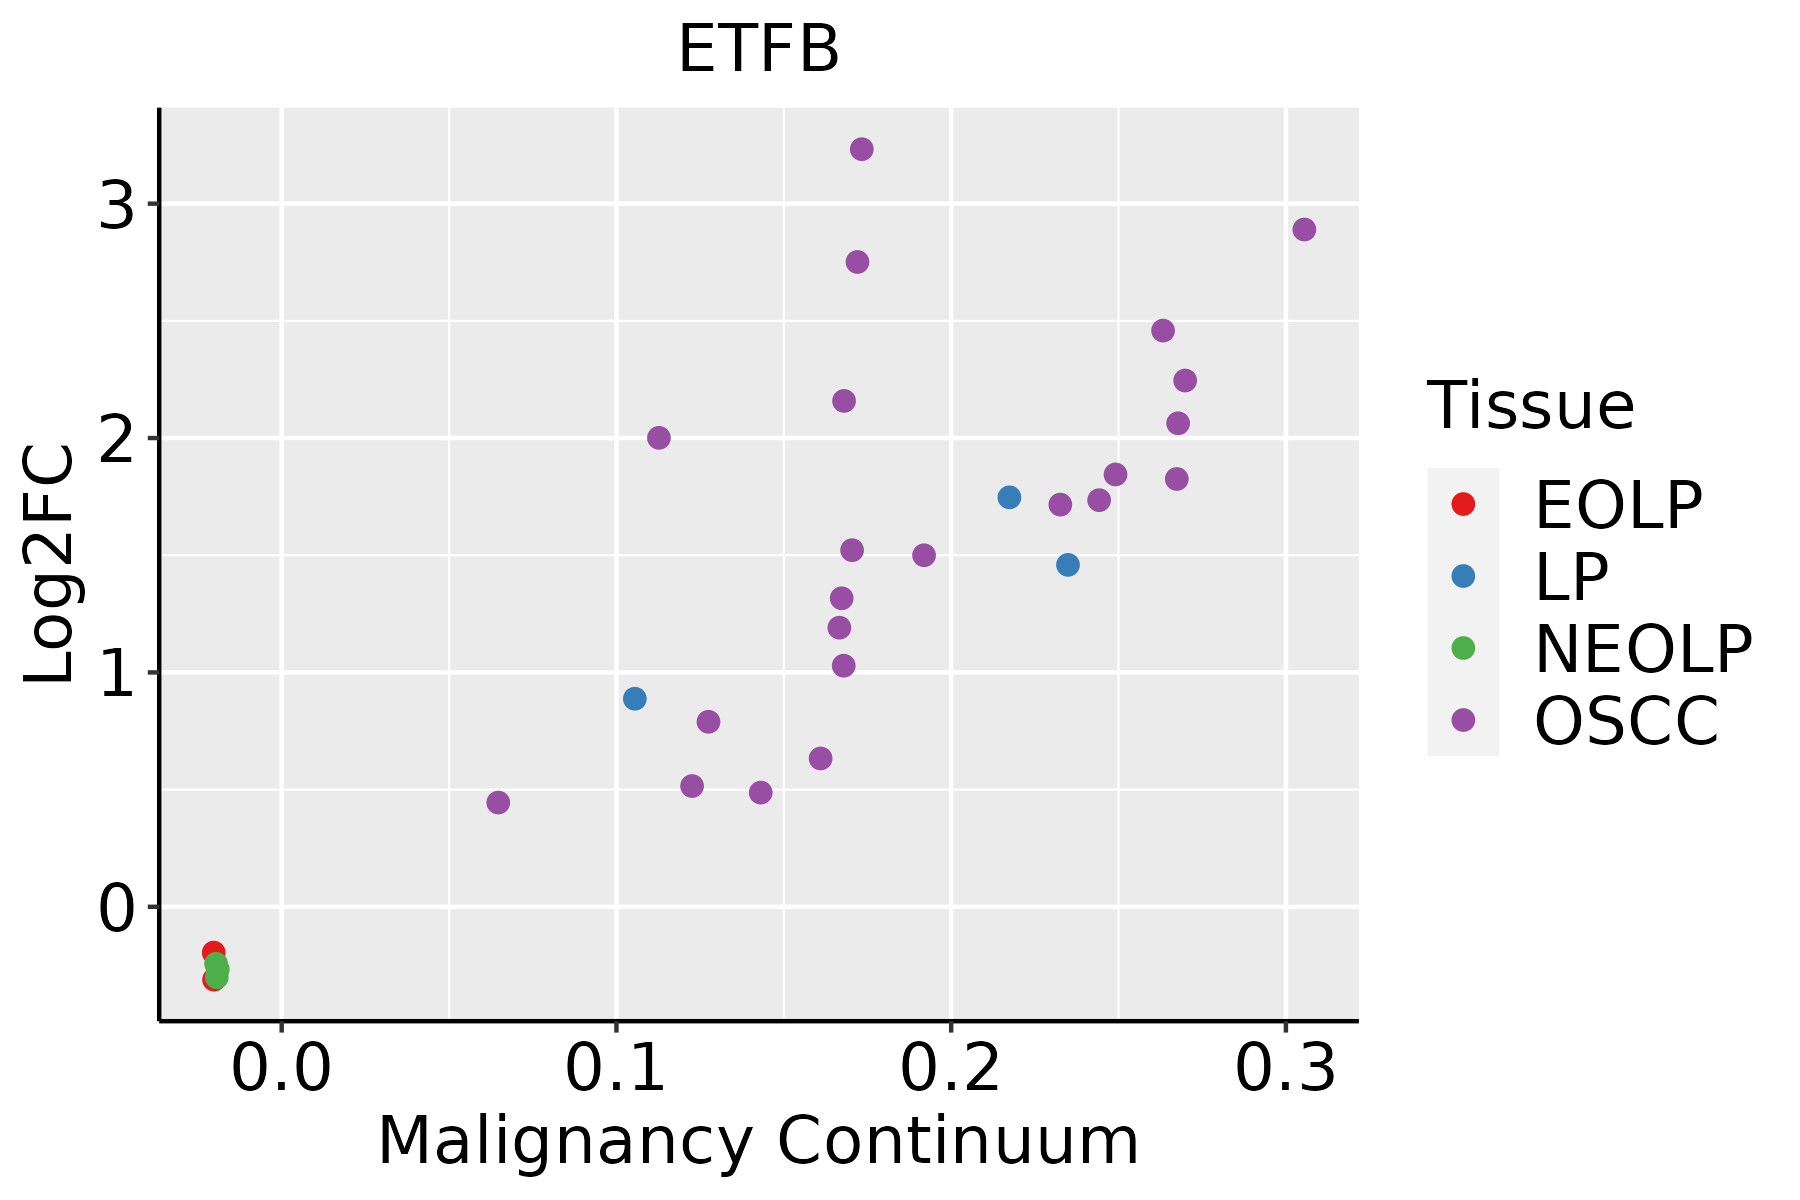 | EOLP: Erosive Oral lichen planus |
| LP: leukoplakia |
| NEOLP: Non-erosive oral lichen planus |
| OSCC: Oral squamous cell carcinoma |
| Prostate | 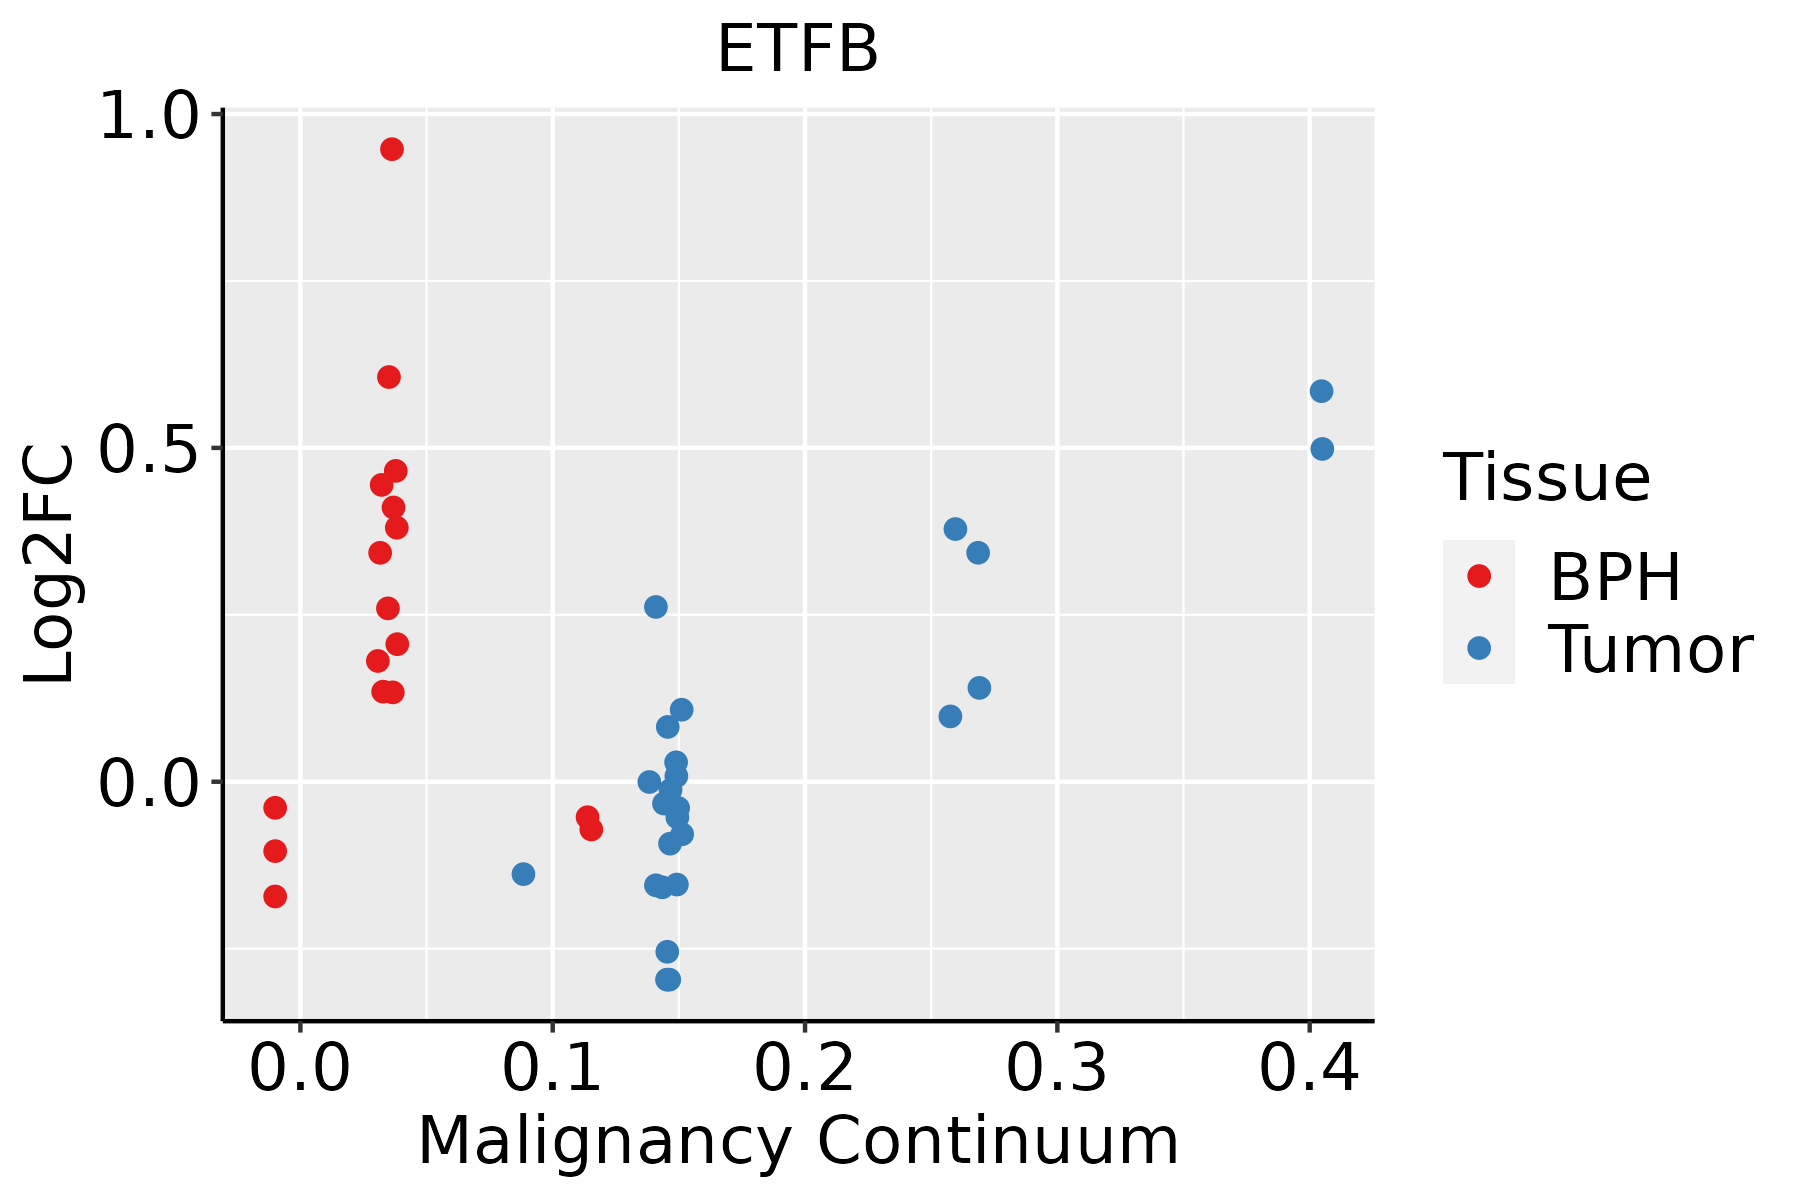 | BPH: Benign Prostatic Hyperplasia |
| Skin |  | AK: Actinic keratosis |
| cSCC: Cutaneous squamous cell carcinoma |
| SCCIS:squamous cell carcinoma in situ |
| Thyroid | 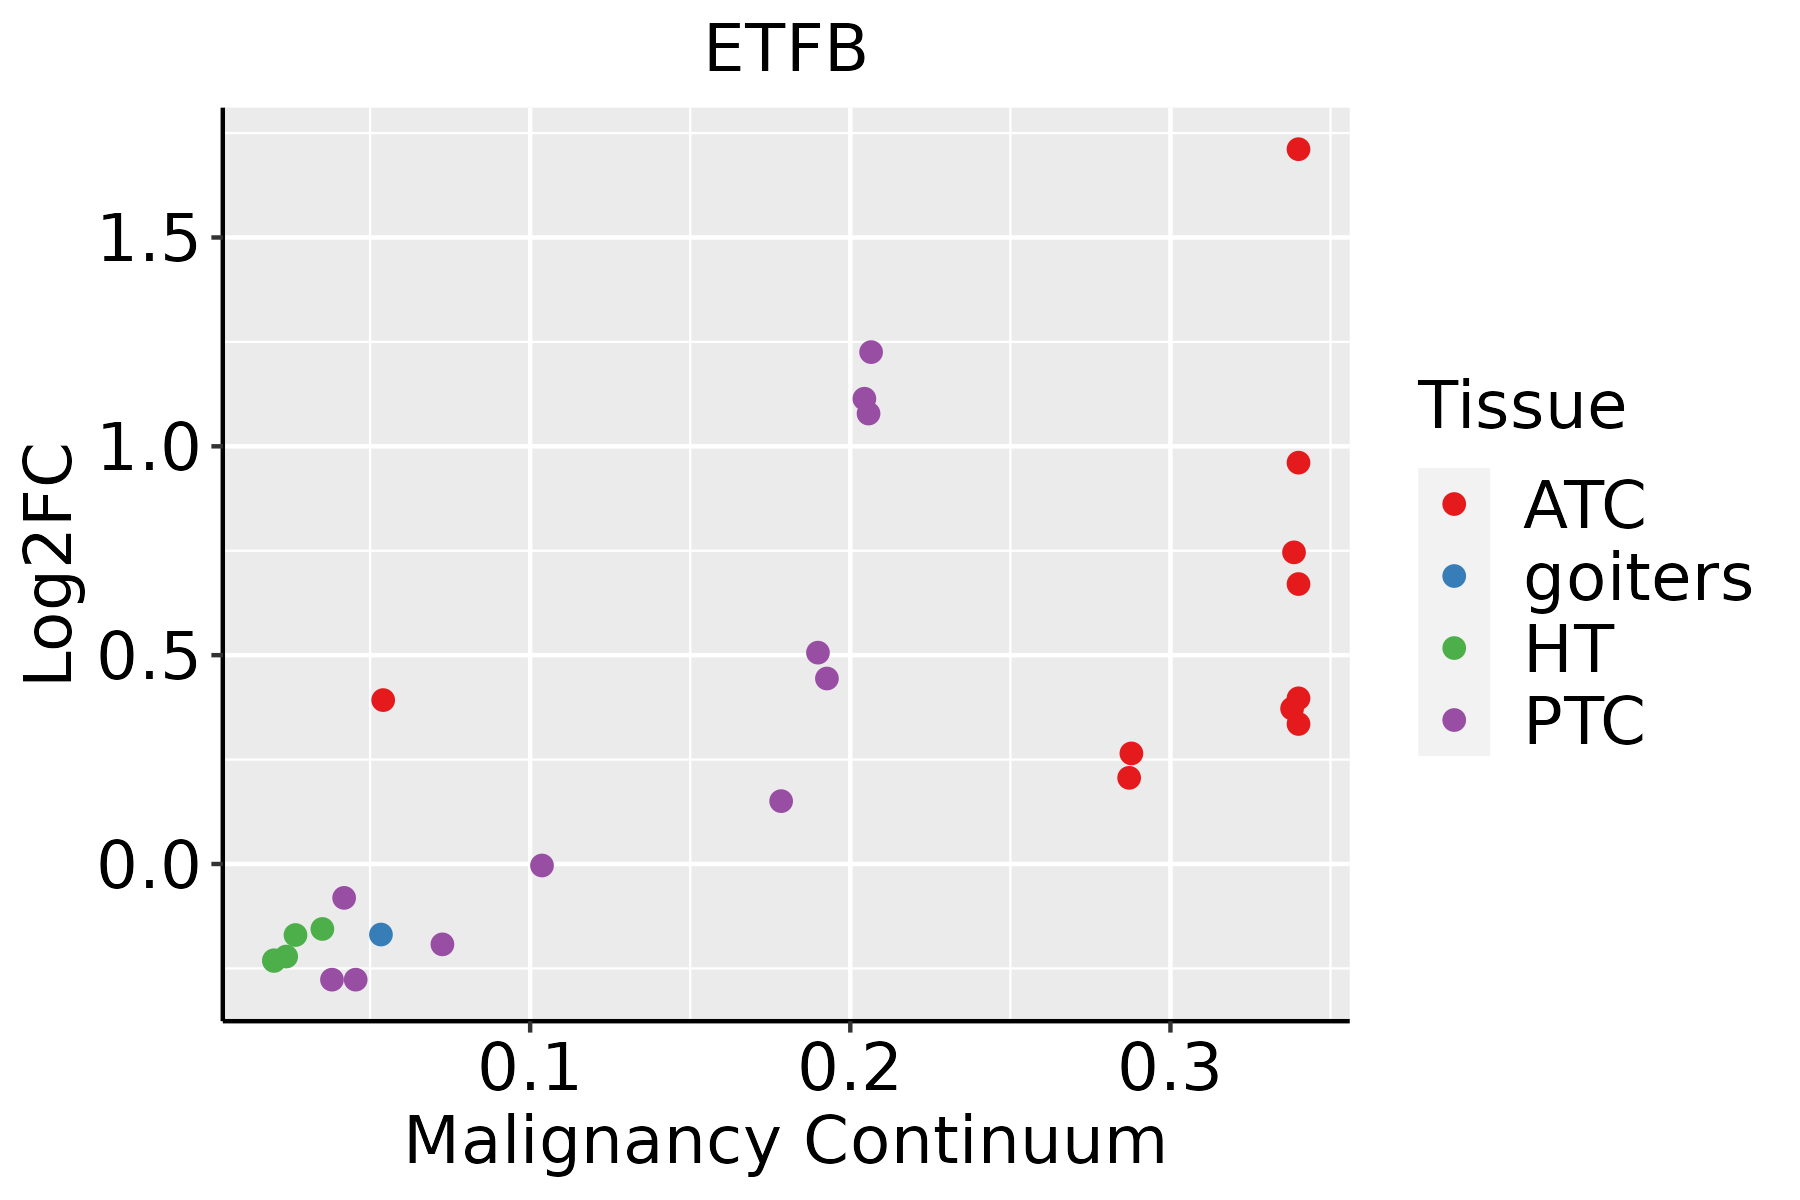 | ATC: Anaplastic thyroid cancer |
| HT: Hashimoto's thyroiditis |
| PTC: Papillary thyroid cancer |
| GO ID | Tissue | Disease Stage | Description | Gene Ratio | Bg Ratio | pvalue | p.adjust | Count |
| GO:000609113 | Breast | IDC | generation of precursor metabolites and energy | 103/1434 | 490/18723 | 1.53e-21 | 1.74e-18 | 103 |
| GO:002290013 | Breast | IDC | electron transport chain | 51/1434 | 175/18723 | 2.23e-17 | 8.43e-15 | 51 |
| GO:000609123 | Breast | DCIS | generation of precursor metabolites and energy | 103/1390 | 490/18723 | 1.46e-22 | 1.65e-19 | 103 |
| GO:002290023 | Breast | DCIS | electron transport chain | 51/1390 | 175/18723 | 6.01e-18 | 2.62e-15 | 51 |
| GO:00229009 | Cervix | CC | electron transport chain | 53/2311 | 175/18723 | 2.23e-10 | 3.43e-08 | 53 |
| GO:00060919 | Cervix | CC | generation of precursor metabolites and energy | 105/2311 | 490/18723 | 7.40e-09 | 6.61e-07 | 105 |
| GO:0006091 | Colorectum | AD | generation of precursor metabolites and energy | 209/3918 | 490/18723 | 3.17e-28 | 6.61e-25 | 209 |
| GO:0022900 | Colorectum | AD | electron transport chain | 89/3918 | 175/18723 | 1.42e-18 | 8.91e-16 | 89 |
| GO:0044282 | Colorectum | AD | small molecule catabolic process | 118/3918 | 376/18723 | 1.05e-06 | 3.55e-05 | 118 |
| GO:0006635 | Colorectum | AD | fatty acid beta-oxidation | 33/3918 | 74/18723 | 3.98e-06 | 1.09e-04 | 33 |
| GO:0009062 | Colorectum | AD | fatty acid catabolic process | 41/3918 | 100/18723 | 4.02e-06 | 1.09e-04 | 41 |
| GO:0019395 | Colorectum | AD | fatty acid oxidation | 40/3918 | 103/18723 | 2.43e-05 | 4.69e-04 | 40 |
| GO:0016042 | Colorectum | AD | lipid catabolic process | 97/3918 | 320/18723 | 4.31e-05 | 7.56e-04 | 97 |
| GO:0006631 | Colorectum | AD | fatty acid metabolic process | 114/3918 | 390/18723 | 5.58e-05 | 9.44e-04 | 114 |
| GO:0072329 | Colorectum | AD | monocarboxylic acid catabolic process | 44/3918 | 122/18723 | 8.05e-05 | 1.28e-03 | 44 |
| GO:0034440 | Colorectum | AD | lipid oxidation | 40/3918 | 108/18723 | 8.52e-05 | 1.32e-03 | 40 |
| GO:0030258 | Colorectum | AD | lipid modification | 67/3918 | 212/18723 | 1.66e-04 | 2.27e-03 | 67 |
| GO:0016054 | Colorectum | AD | organic acid catabolic process | 73/3918 | 240/18723 | 3.20e-04 | 3.81e-03 | 73 |
| GO:0044242 | Colorectum | AD | cellular lipid catabolic process | 66/3918 | 214/18723 | 3.96e-04 | 4.50e-03 | 66 |
| GO:0046395 | Colorectum | AD | carboxylic acid catabolic process | 70/3918 | 236/18723 | 9.06e-04 | 8.71e-03 | 70 |
| Hugo Symbol | Variant Class | Variant Classification | dbSNP RS | HGVSc | HGVSp | HGVSp Short | SWISSPROT | BIOTYPE | SIFT | PolyPhen | Tumor Sample Barcode | Tissue | Histology | Sex | Age | Stage | Therapy Types | Drugs | Outcome |
| ETFB | SNV | Missense_Mutation | rs755539437 | c.793N>T | p.Arg265Cys | p.R265C | P38117 | protein_coding | tolerated_low_confidence(0.05) | probably_damaging(0.934) | TCGA-A8-A09Z-01 | Breast | breast invasive carcinoma | Female | >=65 | I/II | Unknown | Unknown | SD |
| ETFB | SNV | Missense_Mutation | rs104894677 | c.764N>A | p.Arg255Gln | p.R255Q | P38117 | protein_coding | deleterious_low_confidence(0.02) | probably_damaging(0.983) | TCGA-AN-A0FX-01 | Breast | breast invasive carcinoma | Female | <65 | I/II | Unknown | Unknown | SD |
| ETFB | SNV | Missense_Mutation | | c.1000G>A | p.Glu334Lys | p.E334K | P38117 | protein_coding | tolerated_low_confidence(0.07) | benign(0.22) | TCGA-BH-A0AW-01 | Breast | breast invasive carcinoma | Female | <65 | I/II | Chemotherapy | carboplatin | SD |
| ETFB | SNV | Missense_Mutation | novel | c.991G>A | p.Glu331Lys | p.E331K | P38117 | protein_coding | tolerated_low_confidence(0.14) | benign(0.305) | TCGA-C5-A3HF-01 | Cervix | cervical & endocervical cancer | Female | <65 | I/II | Unknown | Unknown | PD |
| ETFB | SNV | Missense_Mutation | | c.284N>A | p.Ser95Tyr | p.S95Y | P38117 | protein_coding | deleterious_low_confidence(0) | benign(0) | TCGA-EA-A50E-01 | Cervix | cervical & endocervical cancer | Female | <65 | I/II | Unknown | Unknown | PD |
| ETFB | SNV | Missense_Mutation | | c.809C>T | p.Ala270Val | p.A270V | P38117 | protein_coding | deleterious_low_confidence(0) | benign(0.092) | TCGA-A6-A565-01 | Colorectum | colon adenocarcinoma | Female | <65 | III/IV | Unspecific | 5FU | PD |
| ETFB | SNV | Missense_Mutation | | c.523G>T | p.Asp175Tyr | p.D175Y | P38117 | protein_coding | deleterious_low_confidence(0) | probably_damaging(1) | TCGA-AA-A010-01 | Colorectum | colon adenocarcinoma | Female | <65 | I/II | Chemotherapy | folinic | CR |
| ETFB | SNV | Missense_Mutation | | c.888G>T | p.Lys296Asn | p.K296N | P38117 | protein_coding | deleterious_low_confidence(0) | possibly_damaging(0.868) | TCGA-CK-6751-01 | Colorectum | colon adenocarcinoma | Female | >=65 | I/II | Unknown | Unknown | SD |
| ETFB | SNV | Missense_Mutation | | c.353C>A | p.Thr118Asn | p.T118N | P38117 | protein_coding | deleterious_low_confidence(0) | benign(0.091) | TCGA-G5-6572-02 | Colorectum | NA | NA | NA | NA | NA | NA | NA |
| ETFB | SNV | Missense_Mutation | rs370522844 | c.1033N>T | p.Arg345Trp | p.R345W | P38117 | protein_coding | deleterious_low_confidence(0) | possibly_damaging(0.89) | TCGA-AP-A1DV-01 | Endometrium | uterine corpus endometrioid carcinoma | Female | <65 | I/II | Unknown | Unknown | SD |


