
|
|||||
|
 | |
| |
| |
| |
| |
| |
|
Gene: ESYT2 |
Gene summary for ESYT2 |
| Gene information | Species | Human | Gene symbol | ESYT2 | Gene ID | 57488 |
| Gene name | extended synaptotagmin 2 | |
| Gene Alias | CHR2SYT | |
| Cytomap | 7q36.3 | |
| Gene Type | protein-coding | GO ID | GO:0006810 | UniProtAcc | A0FGR8 |
Top |
Malignant transformation analysis |
| Identification of the aberrant gene expression in precancerous and cancerous lesions by comparing the gene expression of stem-like cells in diseased tissues with normal stem cells |
| Entrez ID | Symbol | Replicates | Species | Organ | Tissue | Adj P-value | Log2FC | Malignancy |
| 57488 | ESYT2 | HTA11_78_2000001011 | Human | Colorectum | AD | 3.79e-02 | 4.79e-01 | -0.1088 |
| 57488 | ESYT2 | HTA11_347_2000001011 | Human | Colorectum | AD | 2.18e-10 | 5.49e-01 | -0.1954 |
| 57488 | ESYT2 | HTA11_411_2000001011 | Human | Colorectum | SER | 1.73e-02 | 7.45e-01 | -0.2602 |
| 57488 | ESYT2 | HTA11_99999965104_69814 | Human | Colorectum | MSS | 3.37e-10 | 7.69e-01 | 0.281 |
| 57488 | ESYT2 | HTA11_99999974143_84620 | Human | Colorectum | MSS | 7.04e-05 | -2.38e-01 | 0.3005 |
| 57488 | ESYT2 | F007 | Human | Colorectum | FAP | 7.41e-03 | -2.80e-01 | 0.1176 |
| 57488 | ESYT2 | A001-C-207 | Human | Colorectum | FAP | 2.04e-05 | -2.47e-01 | 0.1278 |
| 57488 | ESYT2 | A015-C-203 | Human | Colorectum | FAP | 3.19e-27 | -4.84e-01 | -0.1294 |
| 57488 | ESYT2 | A015-C-204 | Human | Colorectum | FAP | 9.82e-09 | -2.61e-01 | -0.0228 |
| 57488 | ESYT2 | A014-C-040 | Human | Colorectum | FAP | 8.67e-05 | -3.92e-01 | -0.1184 |
| 57488 | ESYT2 | A002-C-201 | Human | Colorectum | FAP | 7.28e-23 | -5.01e-01 | 0.0324 |
| 57488 | ESYT2 | A001-C-119 | Human | Colorectum | FAP | 5.52e-05 | -1.99e-01 | -0.1557 |
| 57488 | ESYT2 | A001-C-108 | Human | Colorectum | FAP | 1.95e-13 | -1.54e-01 | -0.0272 |
| 57488 | ESYT2 | A002-C-205 | Human | Colorectum | FAP | 1.08e-25 | -4.59e-01 | -0.1236 |
| 57488 | ESYT2 | A001-C-104 | Human | Colorectum | FAP | 3.51e-02 | -6.75e-02 | 0.0184 |
| 57488 | ESYT2 | A015-C-005 | Human | Colorectum | FAP | 1.45e-03 | 6.93e-02 | -0.0336 |
| 57488 | ESYT2 | A015-C-006 | Human | Colorectum | FAP | 4.46e-19 | -4.63e-01 | -0.0994 |
| 57488 | ESYT2 | A015-C-106 | Human | Colorectum | FAP | 7.09e-09 | -2.10e-01 | -0.0511 |
| 57488 | ESYT2 | A002-C-114 | Human | Colorectum | FAP | 1.71e-22 | -4.36e-01 | -0.1561 |
| 57488 | ESYT2 | A015-C-104 | Human | Colorectum | FAP | 1.65e-25 | -4.36e-01 | -0.1899 |
| Page: 1 2 3 4 5 6 7 8 9 10 |
| Tissue | Expression Dynamics | Abbreviation |
| Colorectum (GSE201348) |  | FAP: Familial adenomatous polyposis |
| CRC: Colorectal cancer | ||
| Colorectum (HTA11) |  | AD: Adenomas |
| SER: Sessile serrated lesions | ||
| MSI-H: Microsatellite-high colorectal cancer | ||
| MSS: Microsatellite stable colorectal cancer | ||
| Endometrium |  | AEH: Atypical endometrial hyperplasia |
| EEC: Endometrioid Cancer | ||
| Esophagus |  | ESCC: Esophageal squamous cell carcinoma |
| HGIN: High-grade intraepithelial neoplasias | ||
| LGIN: Low-grade intraepithelial neoplasias | ||
| Liver | 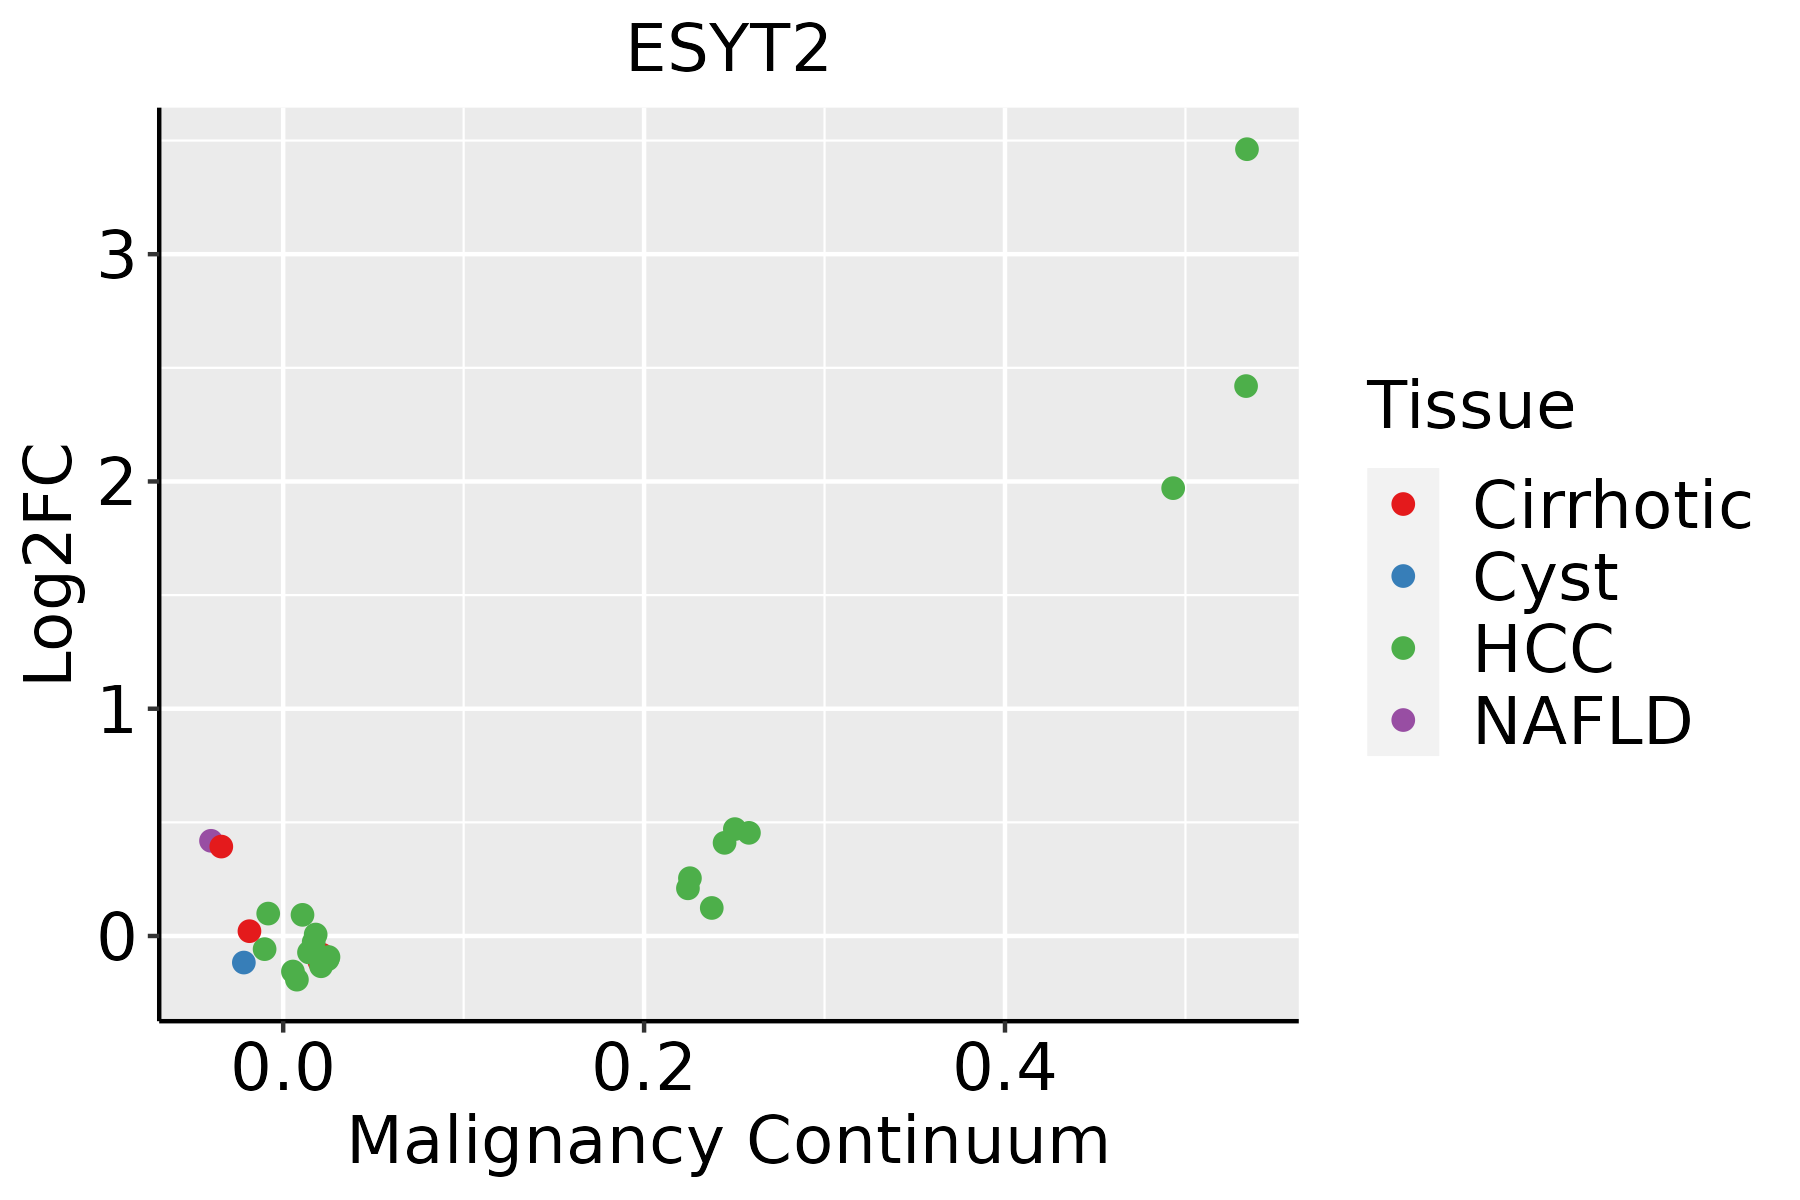 | HCC: Hepatocellular carcinoma |
| NAFLD: Non-alcoholic fatty liver disease | ||
| Lung | 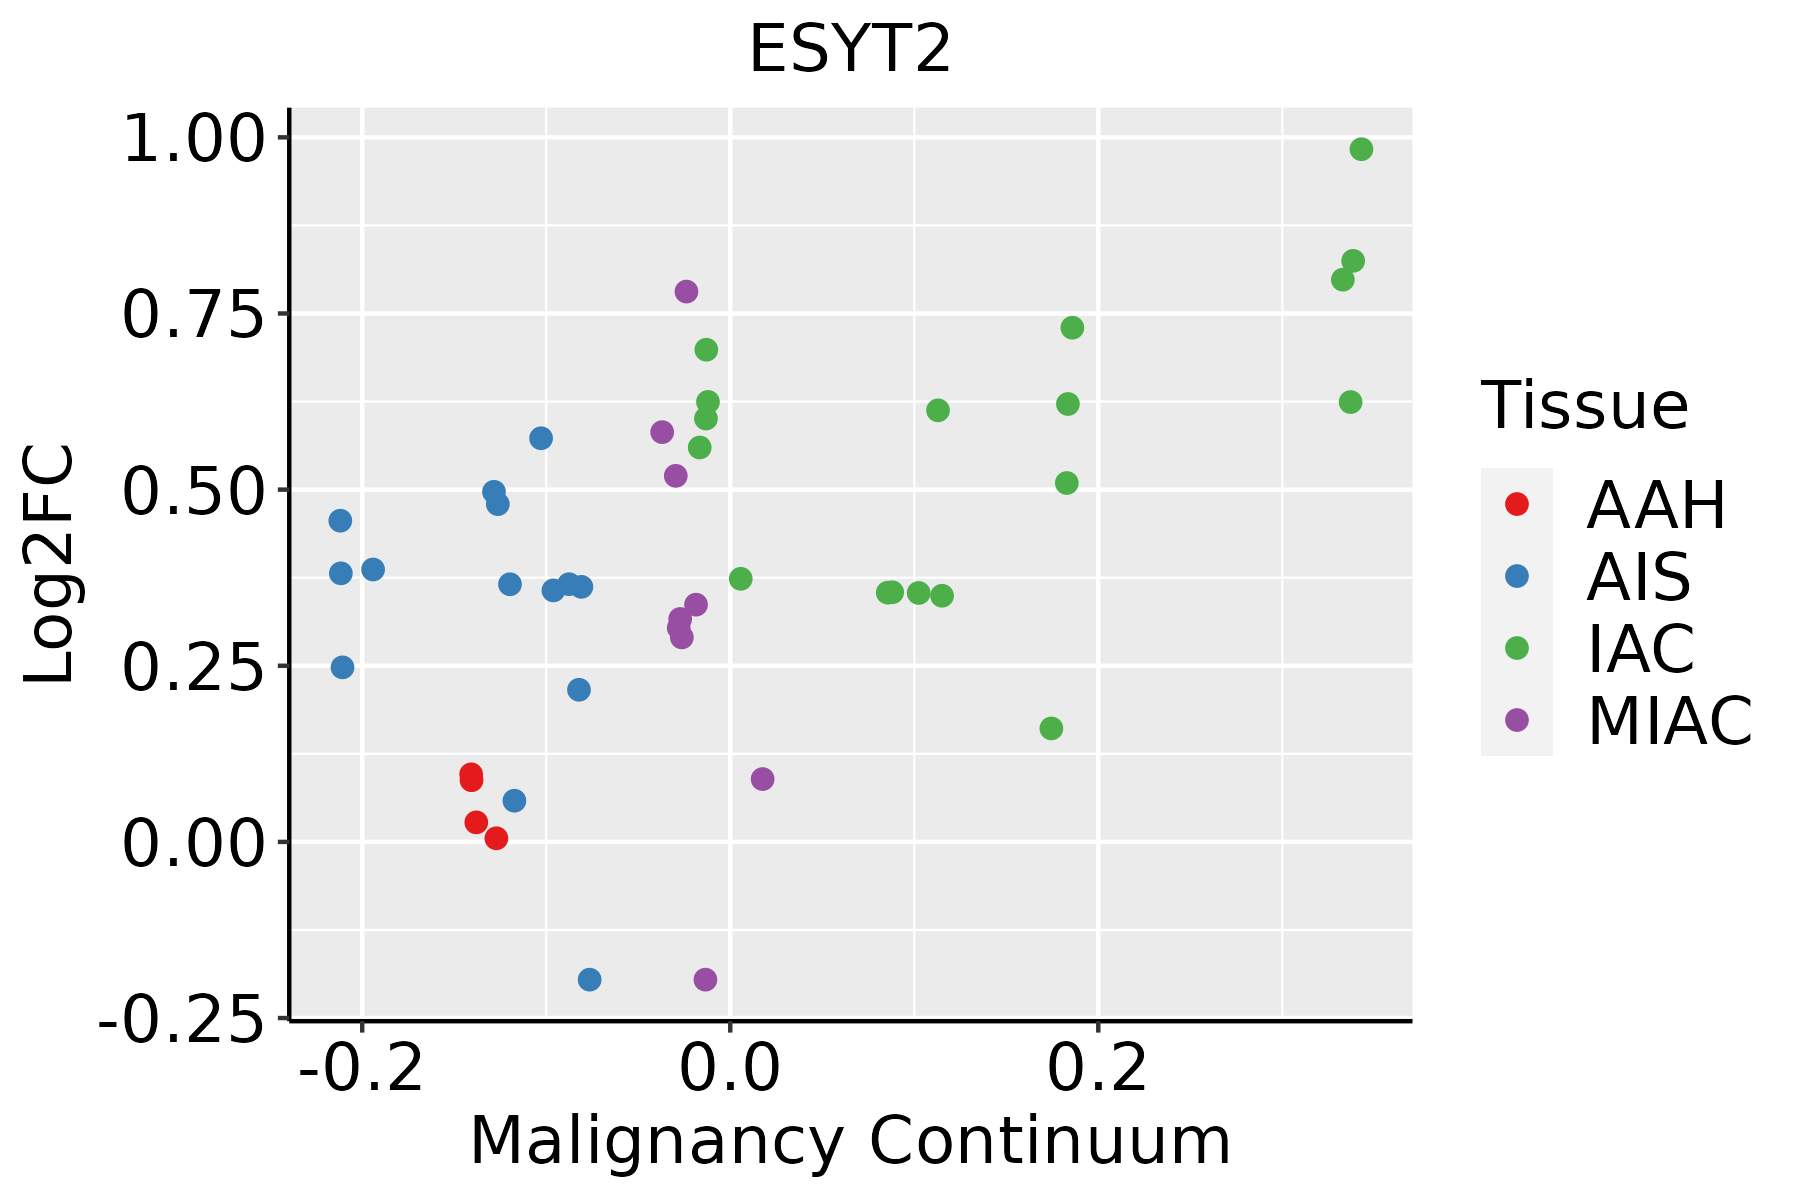 | AAH: Atypical adenomatous hyperplasia |
| AIS: Adenocarcinoma in situ | ||
| IAC: Invasive lung adenocarcinoma | ||
| MIA: Minimally invasive adenocarcinoma | ||
| Oral Cavity |  | EOLP: Erosive Oral lichen planus |
| LP: leukoplakia | ||
| NEOLP: Non-erosive oral lichen planus | ||
| OSCC: Oral squamous cell carcinoma | ||
| Prostate |  | BPH: Benign Prostatic Hyperplasia |
| Skin |  | AK: Actinic keratosis |
| cSCC: Cutaneous squamous cell carcinoma | ||
| SCCIS:squamous cell carcinoma in situ | ||
| Thyroid |  | ATC: Anaplastic thyroid cancer |
| HT: Hashimoto's thyroiditis | ||
| PTC: Papillary thyroid cancer |
| ∗log2FC in expression of this searched gene in stem-like cells from each diseased tissue sample relative to stem-like cells in normal samples in each tissue plotted against the malignancy continuum. Samples are colored based on if they are from different disease stage. |
Top |
Malignant transformation related pathway analysis |
| Find out the enriched GO biological processes and KEGG pathways involved in transition from healthy to precancer to cancer |
| Tissue | Disease Stage | Enriched GO biological Processes |
| Colorectum | AD |  |
| Colorectum | SER |  |
| Colorectum | MSS |  |
| Colorectum | MSI-H |  |
| Colorectum | FAP |  |
| ∗Top 15 enriched GO BP terms are showed in the bar plot of each disease state in each tissue. Each row represents a significant GO biological process which is colored according to the -log10(p.adjust). |
| Page: 1 2 3 4 5 6 7 8 9 |
| GO ID | Tissue | Disease Stage | Description | Gene Ratio | Bg Ratio | pvalue | p.adjust | Count |
| GO:0022406 | Colorectum | AD | membrane docking | 31/3918 | 86/18723 | 8.67e-04 | 8.45e-03 | 31 |
| GO:0007029 | Colorectum | AD | endoplasmic reticulum organization | 31/3918 | 87/18723 | 1.08e-03 | 1.00e-02 | 31 |
| GO:0140056 | Colorectum | AD | organelle localization by membrane tethering | 28/3918 | 77/18723 | 1.29e-03 | 1.14e-02 | 28 |
| GO:0010876 | Colorectum | AD | lipid localization | 120/3918 | 448/18723 | 1.59e-03 | 1.33e-02 | 120 |
| GO:0006869 | Colorectum | AD | lipid transport | 108/3918 | 398/18723 | 1.67e-03 | 1.39e-02 | 108 |
| GO:00224061 | Colorectum | SER | membrane docking | 25/2897 | 86/18723 | 9.88e-04 | 1.17e-02 | 25 |
| GO:01400561 | Colorectum | SER | organelle localization by membrane tethering | 22/2897 | 77/18723 | 2.46e-03 | 2.32e-02 | 22 |
| GO:00070291 | Colorectum | SER | endoplasmic reticulum organization | 23/2897 | 87/18723 | 5.77e-03 | 4.23e-02 | 23 |
| GO:00224062 | Colorectum | MSS | membrane docking | 28/3467 | 86/18723 | 1.27e-03 | 1.21e-02 | 28 |
| GO:01400562 | Colorectum | MSS | organelle localization by membrane tethering | 25/3467 | 77/18723 | 2.34e-03 | 1.91e-02 | 25 |
| GO:00108761 | Colorectum | MSS | lipid localization | 104/3467 | 448/18723 | 6.76e-03 | 4.38e-02 | 104 |
| GO:00068691 | Colorectum | FAP | lipid transport | 81/2622 | 398/18723 | 2.84e-04 | 3.76e-03 | 81 |
| GO:00108762 | Colorectum | FAP | lipid localization | 85/2622 | 448/18723 | 1.92e-03 | 1.63e-02 | 85 |
| GO:00224063 | Colorectum | FAP | membrane docking | 22/2622 | 86/18723 | 3.11e-03 | 2.33e-02 | 22 |
| GO:01400563 | Colorectum | FAP | organelle localization by membrane tethering | 19/2622 | 77/18723 | 8.67e-03 | 4.98e-02 | 19 |
| GO:00224064 | Colorectum | CRC | membrane docking | 20/2078 | 86/18723 | 9.78e-04 | 1.17e-02 | 20 |
| GO:00068692 | Colorectum | CRC | lipid transport | 63/2078 | 398/18723 | 2.36e-03 | 2.26e-02 | 63 |
| GO:01400564 | Colorectum | CRC | organelle localization by membrane tethering | 17/2078 | 77/18723 | 4.05e-03 | 3.35e-02 | 17 |
| GO:00108763 | Colorectum | CRC | lipid localization | 68/2078 | 448/18723 | 4.60e-03 | 3.58e-02 | 68 |
| GO:000702914 | Esophagus | ESCC | endoplasmic reticulum organization | 65/8552 | 87/18723 | 3.28e-08 | 6.08e-07 | 65 |
| Page: 1 2 3 |
| Pathway ID | Tissue | Disease Stage | Description | Gene Ratio | Bg Ratio | pvalue | p.adjust | qvalue | Count |
| Page: 1 |
Top |
Cell-cell communication analysis |
| Identification of potential cell-cell interactions between two cell types and their ligand-receptor pairs for different disease states |
| Ligand | Receptor | LRpair | Pathway | Tissue | Disease Stage |
| Page: 1 |
Top |
Single-cell gene regulatory network inference analysis |
| Find out the significant the regulons (TFs) and the target genes of each regulon across cell types for different disease states |
| TF | Cell Type | Tissue | Disease Stage | Target Gene | RSS | Regulon Activity |
| ∗The dot plots of a searched regulon are shown for all cell subpopulations in each disease state of each tissue based on the regulon specific score inferred using pySCENIC and by calculating the average expression. |
| Page: 1 |
Top |
Somatic mutation of malignant transformation related genes |
| Annotation of somatic variants for genes involved in malignant transformation |
| Hugo Symbol | Variant Class | Variant Classification | dbSNP RS | HGVSc | HGVSp | HGVSp Short | SWISSPROT | BIOTYPE | SIFT | PolyPhen | Tumor Sample Barcode | Tissue | Histology | Sex | Age | Stage | Therapy Types | Drugs | Outcome |
| ESYT2 | SNV | Missense_Mutation | c.991N>G | p.Leu331Val | p.L331V | A0FGR8 | protein_coding | deleterious(0.01) | probably_damaging(0.928) | TCGA-BH-A18P-01 | Breast | breast invasive carcinoma | Female | <65 | I/II | Unknown | Unknown | PD | |
| ESYT2 | SNV | Missense_Mutation | novel | c.2131A>T | p.Ser711Cys | p.S711C | A0FGR8 | protein_coding | tolerated(0.07) | probably_damaging(0.969) | TCGA-D8-A1JL-01 | Breast | breast invasive carcinoma | Female | >=65 | I/II | Unknown | Unknown | SD |
| ESYT2 | SNV | Missense_Mutation | novel | c.2302N>A | p.His768Asn | p.H768N | A0FGR8 | protein_coding | deleterious(0.01) | probably_damaging(0.992) | TCGA-S3-AA10-01 | Breast | breast invasive carcinoma | Female | >=65 | I/II | Chemotherapy | cytoxan | CR |
| ESYT2 | SNV | Missense_Mutation | novel | c.2249A>C | p.Asn750Thr | p.N750T | A0FGR8 | protein_coding | deleterious(0.01) | possibly_damaging(0.487) | TCGA-2W-A8YY-01 | Cervix | cervical & endocervical cancer | Female | <65 | I/II | Chemotherapy | cisplatin | CR |
| ESYT2 | SNV | Missense_Mutation | novel | c.1348G>A | p.Glu450Lys | p.E450K | A0FGR8 | protein_coding | deleterious(0.04) | possibly_damaging(0.758) | TCGA-DG-A2KJ-01 | Cervix | cervical & endocervical cancer | Female | <65 | III/IV | Chemotherapy | cisplatin | SD |
| ESYT2 | SNV | Missense_Mutation | c.2120G>A | p.Arg707Lys | p.R707K | A0FGR8 | protein_coding | tolerated(0.39) | benign(0.017) | TCGA-DR-A0ZM-01 | Cervix | cervical & endocervical cancer | Female | <65 | III/IV | Unspecific | Cisplatin | SD | |
| ESYT2 | SNV | Missense_Mutation | rs781060682 | c.2209N>A | p.Ala737Thr | p.A737T | A0FGR8 | protein_coding | deleterious(0.04) | probably_damaging(0.969) | TCGA-EA-A3HU-01 | Cervix | cervical & endocervical cancer | Female | <65 | I/II | Unknown | Unknown | SD |
| ESYT2 | SNV | Missense_Mutation | c.805N>T | p.His269Tyr | p.H269Y | A0FGR8 | protein_coding | tolerated(0.08) | probably_damaging(0.982) | TCGA-EK-A3GK-01 | Cervix | cervical & endocervical cancer | Female | <65 | I/II | Unknown | Unknown | SD | |
| ESYT2 | SNV | Missense_Mutation | c.956C>T | p.Ser319Leu | p.S319L | A0FGR8 | protein_coding | deleterious(0.01) | possibly_damaging(0.625) | TCGA-JX-A3Q0-01 | Cervix | cervical & endocervical cancer | Female | <65 | III/IV | Unknown | Unknown | SD | |
| ESYT2 | SNV | Missense_Mutation | novel | c.1774N>A | p.Leu592Ile | p.L592I | A0FGR8 | protein_coding | deleterious(0) | probably_damaging(0.998) | TCGA-A6-2672-01 | Colorectum | colon adenocarcinoma | Female | >=65 | III/IV | Unknown | Unknown | SD |
| Page: 1 2 3 4 5 6 7 8 9 10 |
Top |
Related drugs of malignant transformation related genes |
| Identification of chemicals and drugs interact with genes involved in malignant transfromation |
| (DGIdb 4.0) |
| Entrez ID | Symbol | Category | Interaction Types | Drug Claim Name | Drug Name | PMIDs |
| 57488 | ESYT2 | NA | methylphenidate | METHYLPHENIDATE | 29382897 |
| Page: 1 |

Copyright 2023-Present -The University of Texas Health Science Center at Houston |