Schematic overview of the cellular and molecular mechanisms involved in the cancer progression, including the proposed cellular and molecular mechanisms in cancer cells trajectory. AT1: alveolar type 1 cells; AT2: alveolar type 2 cells; AAH: atypical adenomatous hyperplasia; AIS: adenocarcinoma in situ; MIA: minimally invasive adenocarcinoma; IA: invasive adenocarcinoma; EMT: epithelial-mesenchymal transition

Home

Download

Statistics

Help

Contact

Center for Computational Systems Medicine
leaf

Gene summary

leaf

Malignant transformation analysis

leaf

Malignant transformation related pathway analysis

leaf

Cell-cell communication analysis

leaf

Single-cell gene regulatory network inference analysis

leaf

Somatic mutation of malignant transformation related genes

leaf

Related drugs of malignant transformation related genes

Gene: ESYT1

Gene summary for ESYT1

check button Gene summary.

Gene informationSpeciesHuman
Gene symbol

ESYT1

Gene ID

23344

Gene nameextended synaptotagmin 1
Gene AliasFAM62A
Cytomap12q13.2
Gene Typeprotein-coding
GO ID

GO:0006810

UniProtAcc

A0A024RB16


Top

Malignant transformation analysis

check button Identification of the aberrant gene expression in precancerous and cancerous lesions by comparing the gene expression of stem-like cells in diseased tissues with normal stem cells
check button Malignant transformation involving gene list.
Entrez IDSymbolReplicatesSpeciesOrganTissueAdj P-valueLog2FCMalignancy
23344ESYT1LZE4THumanEsophagusESCC5.02e-061.52e-010.0811
23344ESYT1LZE7THumanEsophagusESCC1.10e-063.12e-010.0667
23344ESYT1LZE24THumanEsophagusESCC7.53e-031.34e-010.0596
23344ESYT1LZE6THumanEsophagusESCC5.10e-082.92e-010.0845
23344ESYT1P1T-EHumanEsophagusESCC1.20e-063.13e-010.0875
23344ESYT1P2T-EHumanEsophagusESCC4.44e-254.09e-010.1177
23344ESYT1P4T-EHumanEsophagusESCC3.41e-072.56e-010.1323
23344ESYT1P5T-EHumanEsophagusESCC1.86e-151.21e-010.1327
23344ESYT1P8T-EHumanEsophagusESCC5.10e-131.85e-010.0889
23344ESYT1P9T-EHumanEsophagusESCC1.34e-095.70e-020.1131
23344ESYT1P10T-EHumanEsophagusESCC1.82e-132.11e-010.116
23344ESYT1P11T-EHumanEsophagusESCC1.19e-063.84e-010.1426
23344ESYT1P12T-EHumanEsophagusESCC7.07e-283.22e-010.1122
23344ESYT1P15T-EHumanEsophagusESCC4.48e-111.71e-010.1149
23344ESYT1P16T-EHumanEsophagusESCC3.64e-233.14e-010.1153
23344ESYT1P17T-EHumanEsophagusESCC2.46e-062.96e-010.1278
23344ESYT1P19T-EHumanEsophagusESCC4.79e-065.79e-010.1662
23344ESYT1P20T-EHumanEsophagusESCC7.06e-123.09e-010.1124
23344ESYT1P21T-EHumanEsophagusESCC3.18e-305.23e-010.1617
23344ESYT1P22T-EHumanEsophagusESCC5.08e-171.46e-010.1236
Page: 1 2 3 4 5 6 

check button Transcriptomic changes along malignancy continuum.
TissueExpression DynamicsAbbreviation
EsophagusThe image shows the transcriptomic changes along malignancy continuum.log2FC in expression of this searched gene in stem-like cells from each diseased tissue sample relative to stem-like cells in normal samples in each tissue plotted against the malignancy continuum. Samples are colored based on if they are from different disease stage.
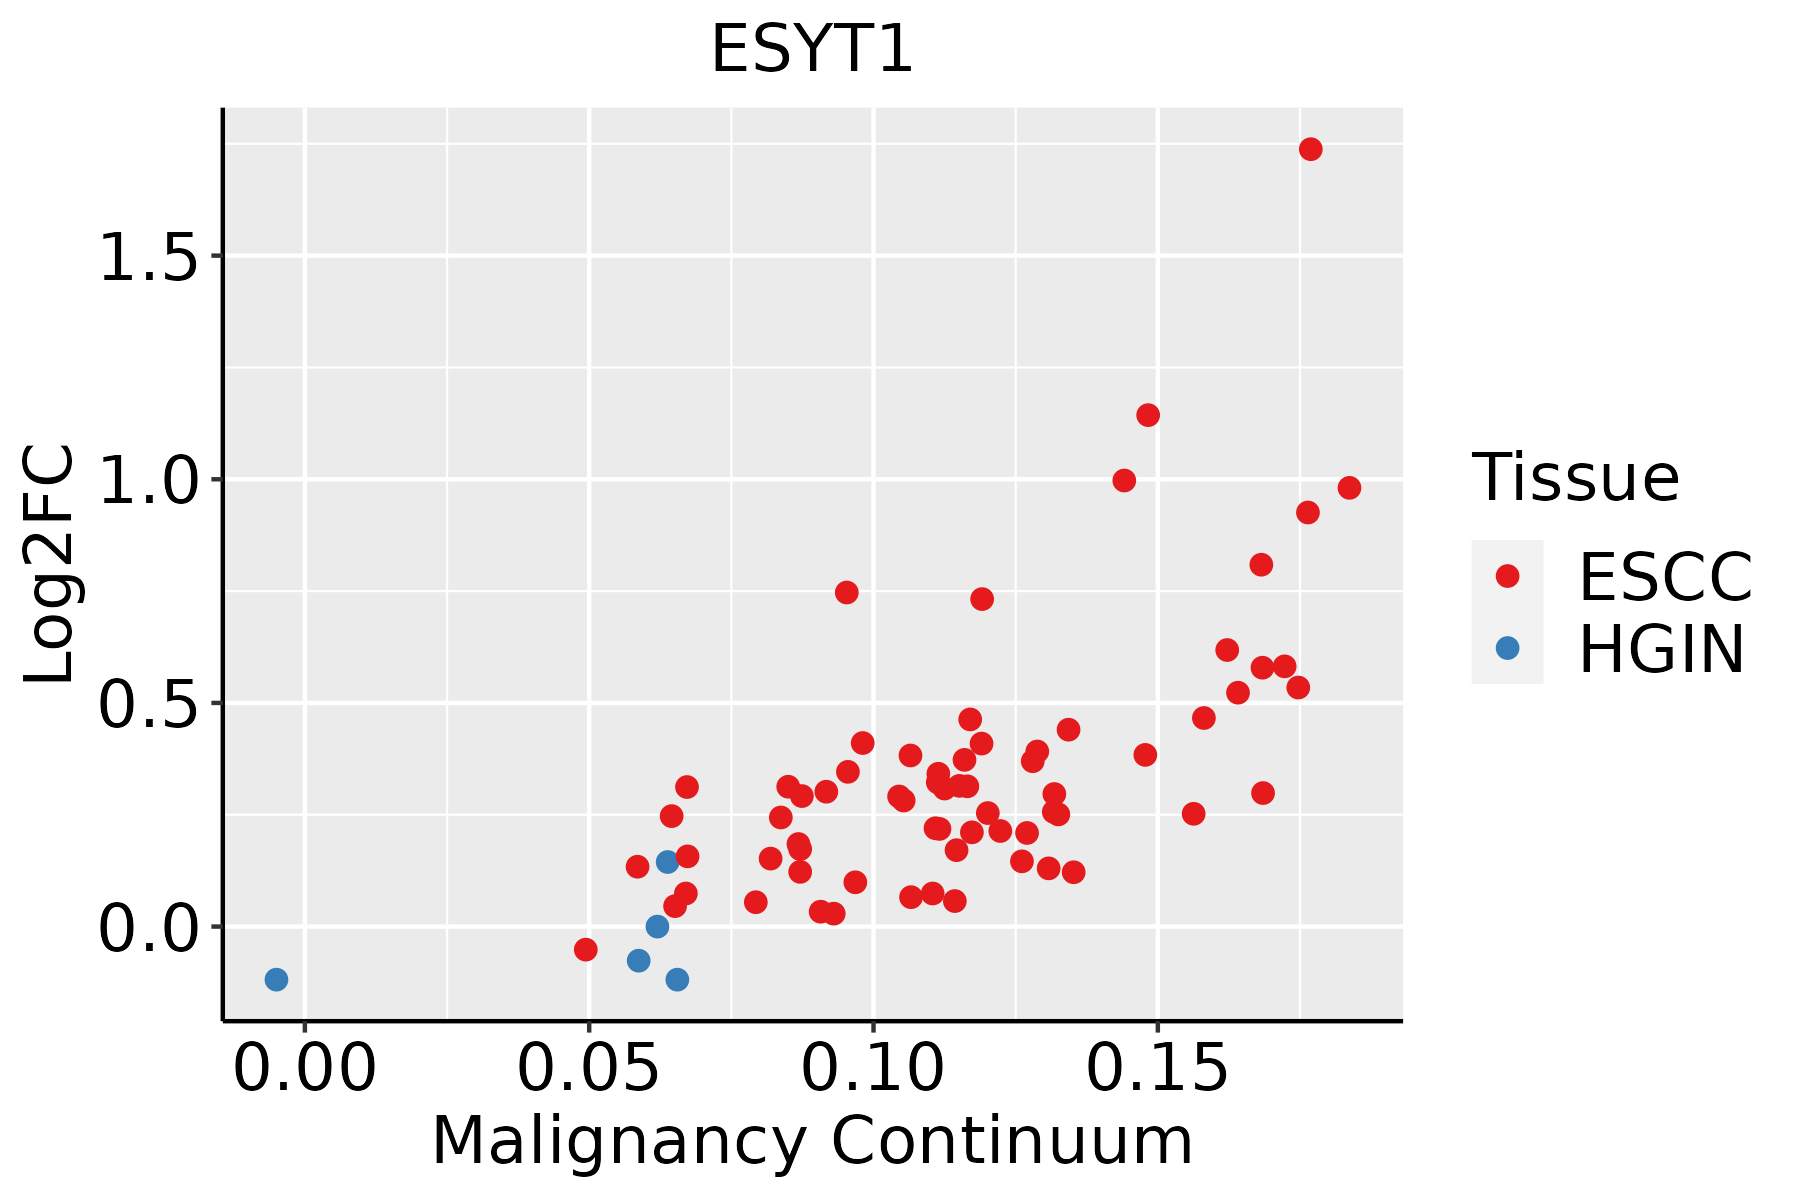
ESCC: Esophageal squamous cell carcinoma
HGIN: High-grade intraepithelial neoplasias
LGIN: Low-grade intraepithelial neoplasias
LiverThe image shows the transcriptomic changes along malignancy continuum.log2FC in expression of this searched gene in stem-like cells from each diseased tissue sample relative to stem-like cells in normal samples in each tissue plotted against the malignancy continuum. Samples are colored based on if they are from different disease stage.HCC: Hepatocellular carcinoma
NAFLD: Non-alcoholic fatty liver disease
Oral CavityThe image shows the transcriptomic changes along malignancy continuum.log2FC in expression of this searched gene in stem-like cells from each diseased tissue sample relative to stem-like cells in normal samples in each tissue plotted against the malignancy continuum. Samples are colored based on if they are from different disease stage.
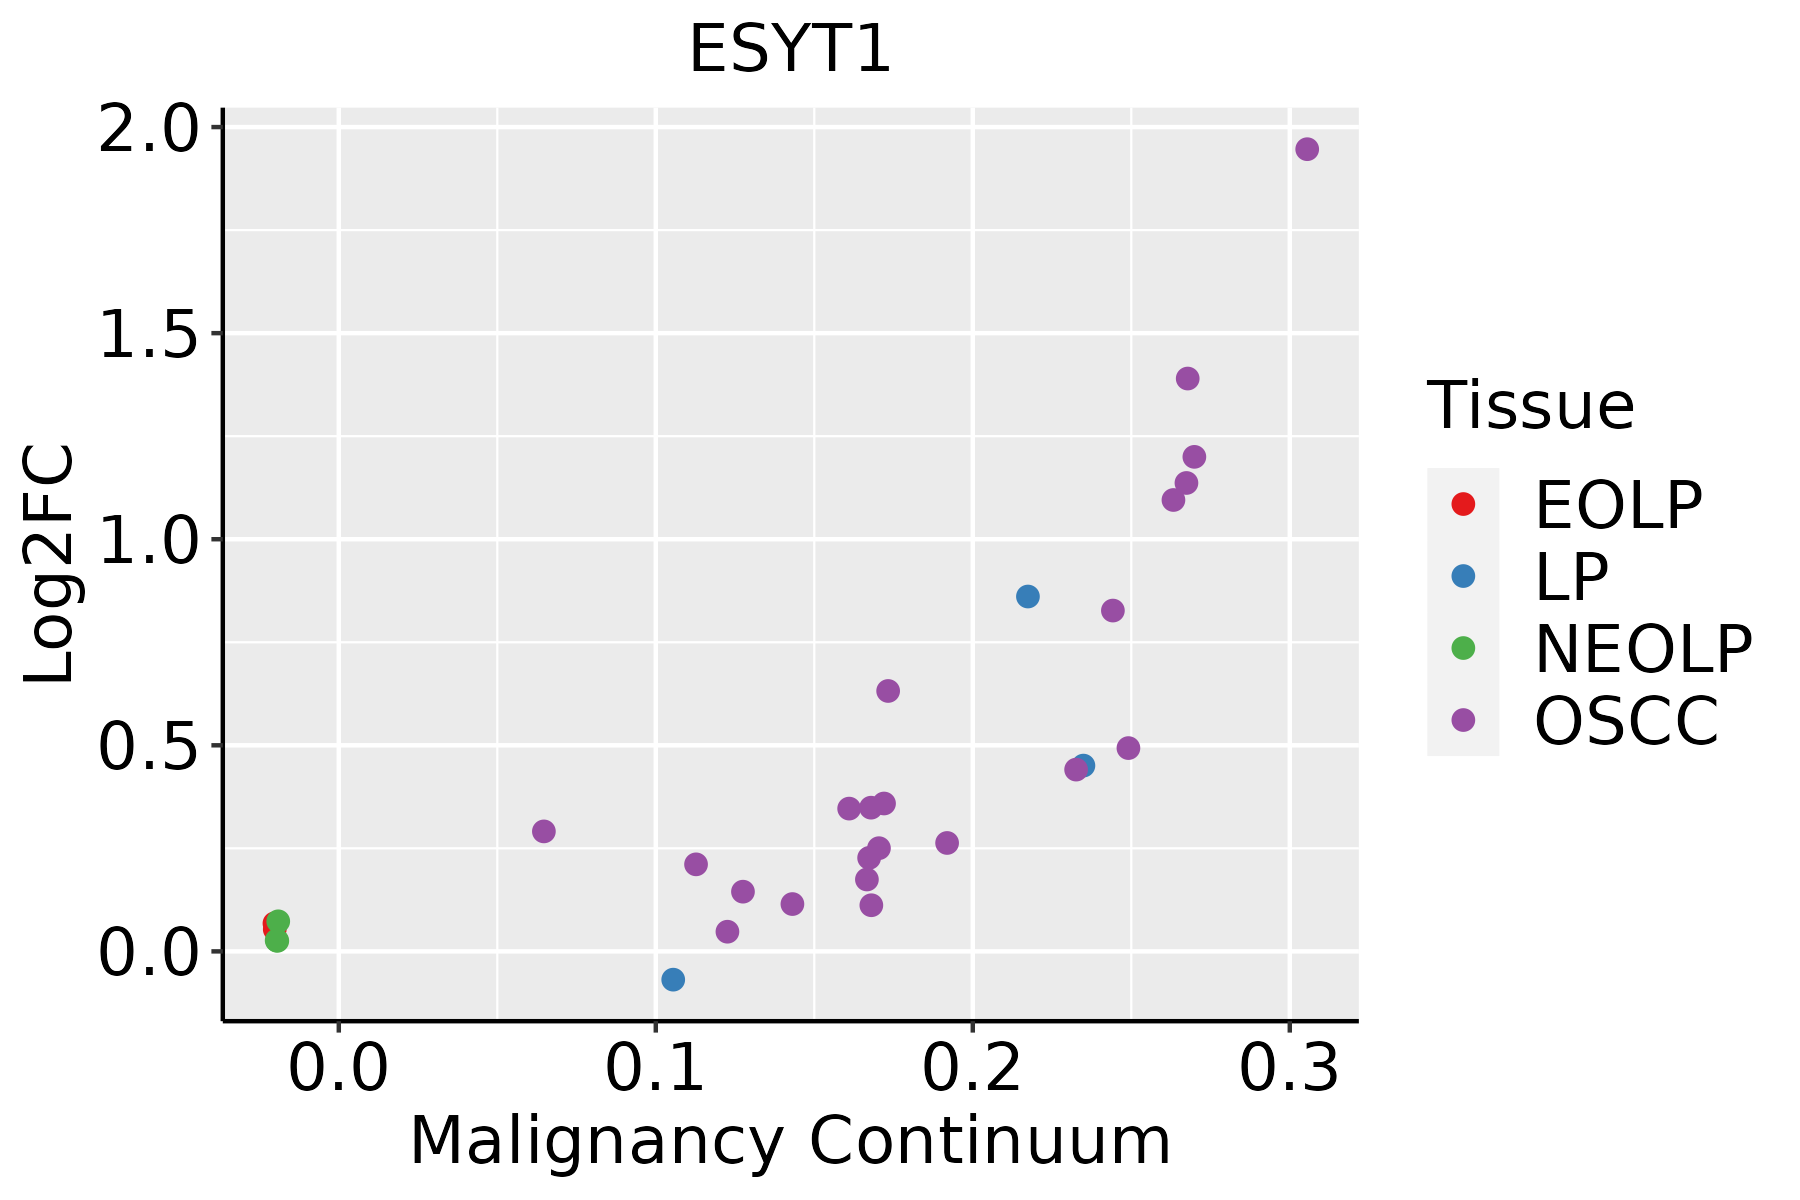
EOLP: Erosive Oral lichen planus
LP: leukoplakia
NEOLP: Non-erosive oral lichen planus
OSCC: Oral squamous cell carcinoma
SkinThe image shows the transcriptomic changes along malignancy continuum.log2FC in expression of this searched gene in stem-like cells from each diseased tissue sample relative to stem-like cells in normal samples in each tissue plotted against the malignancy continuum. Samples are colored based on if they are from different disease stage.
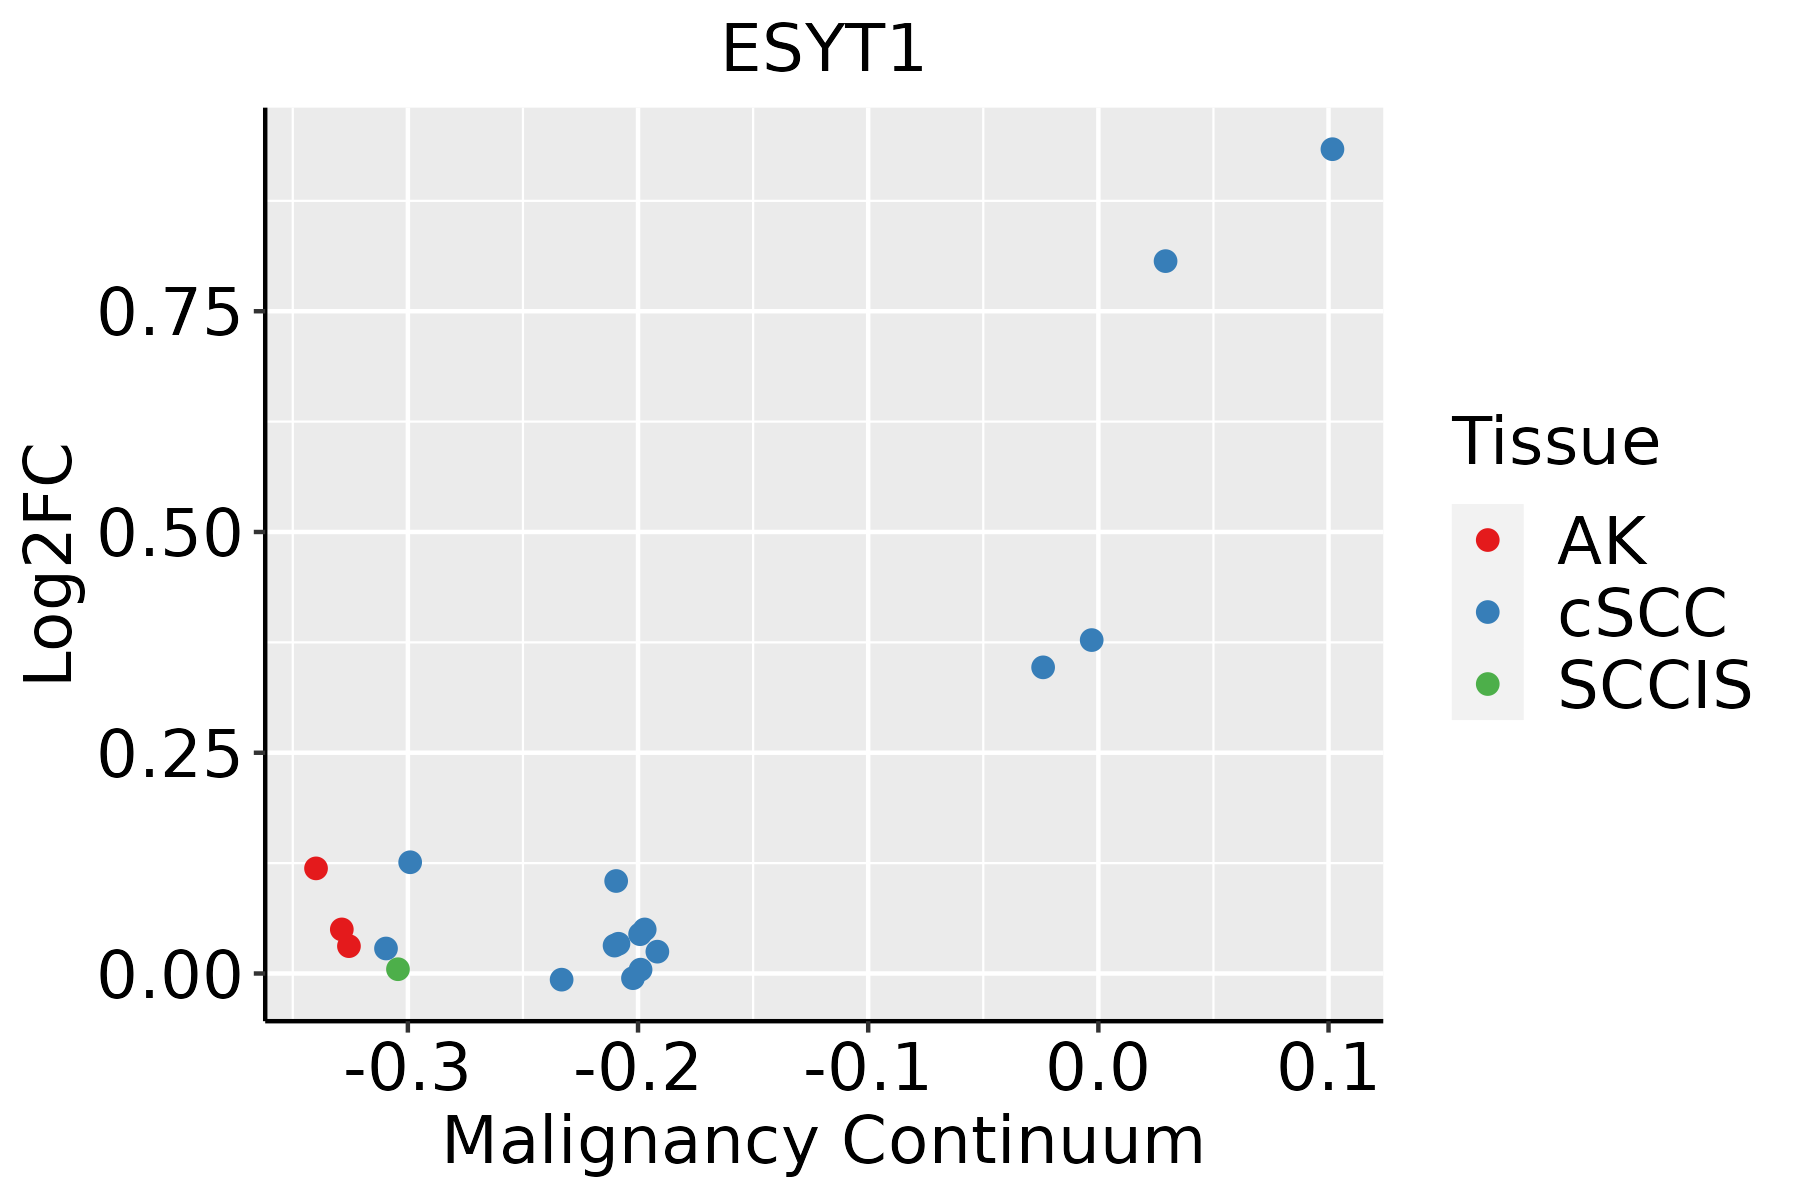
AK: Actinic keratosis
cSCC: Cutaneous squamous cell carcinoma
SCCIS:squamous cell carcinoma in situ
ThyroidThe image shows the transcriptomic changes along malignancy continuum.log2FC in expression of this searched gene in stem-like cells from each diseased tissue sample relative to stem-like cells in normal samples in each tissue plotted against the malignancy continuum. Samples are colored based on if they are from different disease stage.
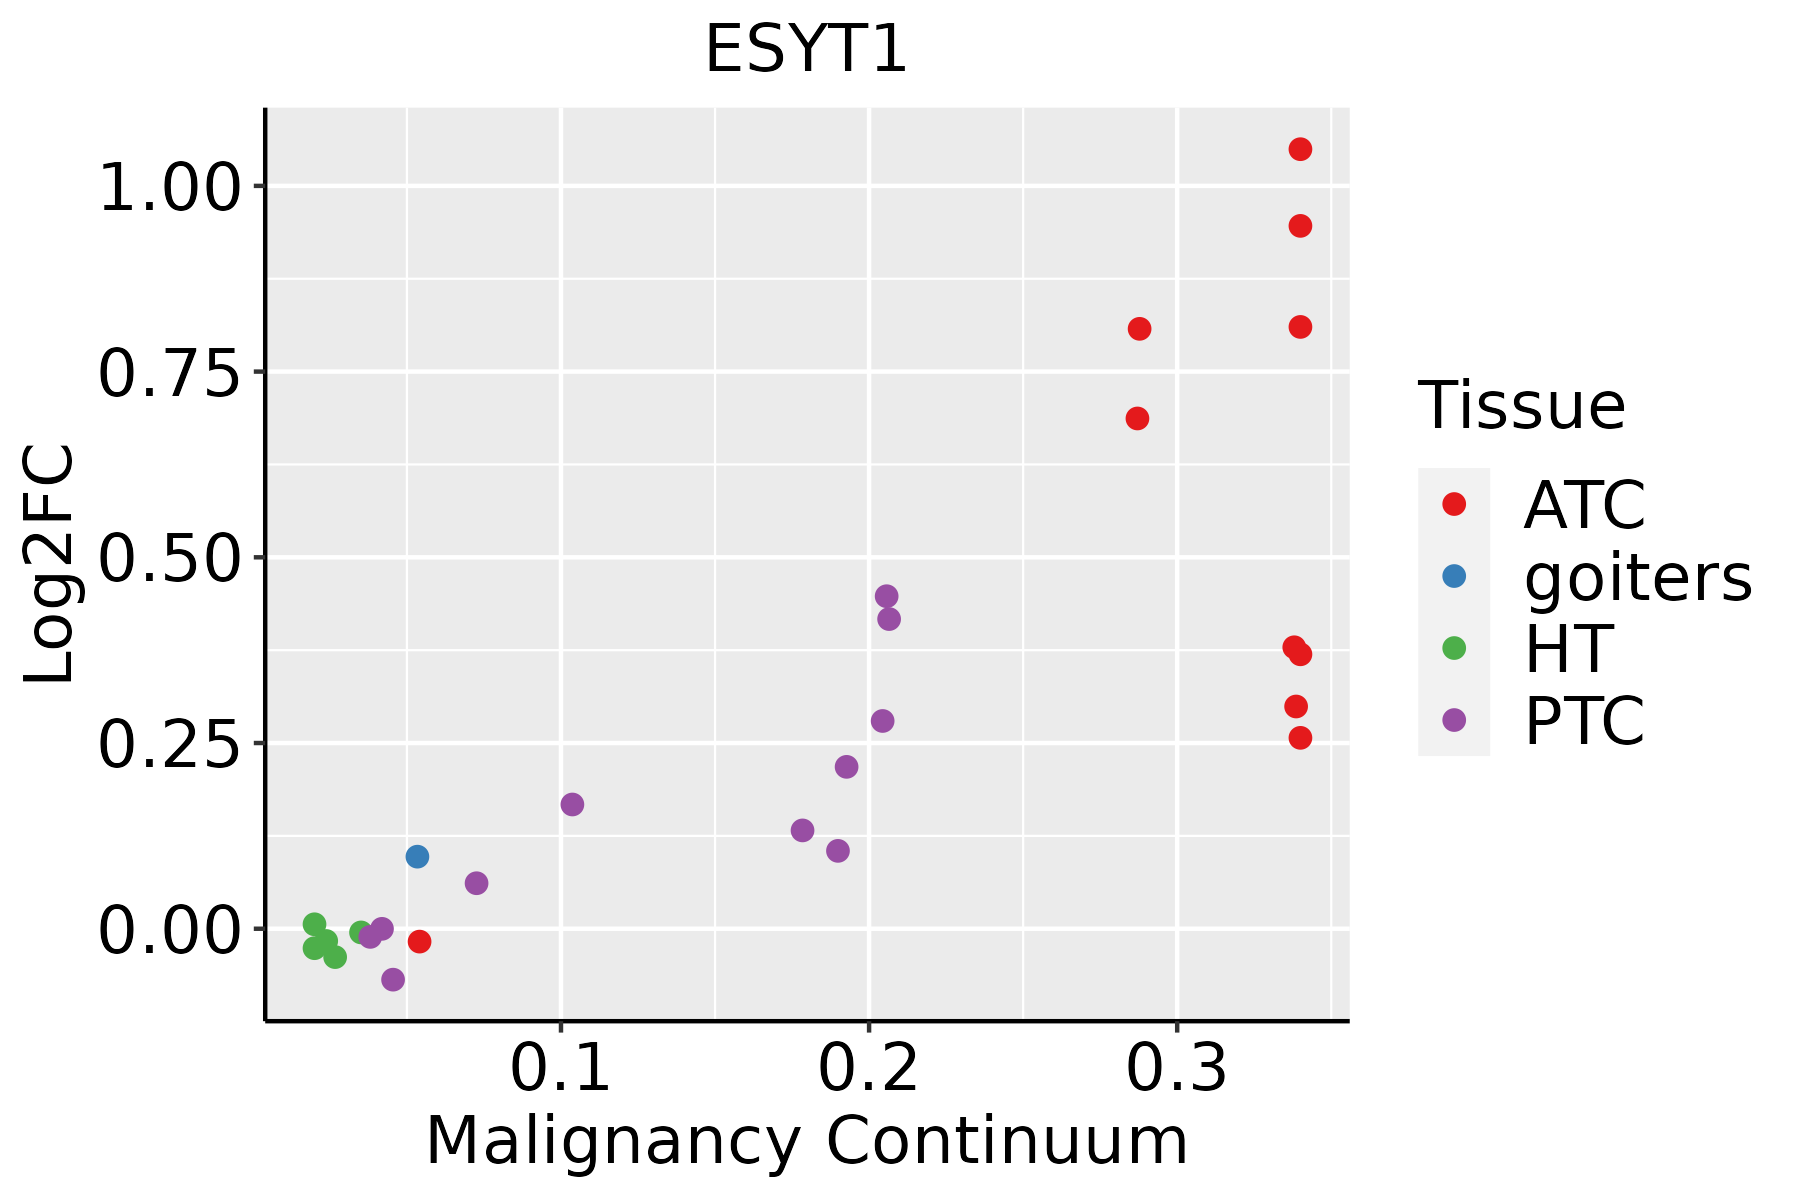
ATC: Anaplastic thyroid cancer
HT: Hashimoto's thyroiditis
PTC: Papillary thyroid cancer
∗log2FC in expression of this searched gene in stem-like cells from each diseased tissue sample relative to stem-like cells in normal samples in each tissue plotted against the malignancy continuum. Samples are colored based on if they are from different disease stage.

Top

Malignant transformation related pathway analysis

check buttonFind out the enriched GO biological processes and KEGG pathways involved in transition from healthy to precancer to cancer
check button Figure of enriched GO biological processes.
TissueDisease StageEnriched GO biological Processes
ColorectumADGO analysis - Figure of enriched GO biological processes: Top 15 enriched GO BP terms are showed in the bar plot of each disease state in each tissue. Each row represents a significant GO biological process which is colored according to the -log10(p.adjust).
ColorectumSERGO analysis - Figure of enriched GO biological processes: Top 15 enriched GO BP terms are showed in the bar plot of each disease state in each tissue. Each row represents a significant GO biological process which is colored according to the -log10(p.adjust).
ColorectumMSSGO analysis - Figure of enriched GO biological processes: Top 15 enriched GO BP terms are showed in the bar plot of each disease state in each tissue. Each row represents a significant GO biological process which is colored according to the -log10(p.adjust).
ColorectumMSI-HGO analysis - Figure of enriched GO biological processes: Top 15 enriched GO BP terms are showed in the bar plot of each disease state in each tissue. Each row represents a significant GO biological process which is colored according to the -log10(p.adjust).
ColorectumFAPGO analysis - Figure of enriched GO biological processes: Top 15 enriched GO BP terms are showed in the bar plot of each disease state in each tissue. Each row represents a significant GO biological process which is colored according to the -log10(p.adjust).
∗Top 15 enriched GO BP terms are showed in the bar plot of each disease state in each tissue. Each row represents a significant GO biological process which is colored according to the -log10(p.adjust).
Page: 1 2 3 4 5 6 7 8 9 

check button Enriched GO biological processes.
GO IDTissueDisease StageDescriptionGene RatioBg Ratiopvaluep.adjustCount
GO:000702914EsophagusESCCendoplasmic reticulum organization65/855287/187233.28e-086.08e-0765
GO:00224069EsophagusESCCmembrane docking62/855286/187235.93e-077.79e-0662
GO:01400567EsophagusESCCorganelle localization by membrane tethering53/855277/187233.33e-052.74e-0453
GO:000702911LiverHCCendoplasmic reticulum organization64/795887/187233.92e-091.04e-0764
GO:002240611LiverHCCmembrane docking57/795886/187237.14e-068.47e-0557
GO:014005611LiverHCCorganelle localization by membrane tethering49/795877/187231.46e-041.18e-0349
GO:001087621LiverHCClipid localization228/7958448/187231.80e-041.41e-03228
GO:000686921LiverHCClipid transport198/7958398/187231.92e-039.78e-03198
GO:00070294Oral cavityOSCCendoplasmic reticulum organization58/730587/187231.59e-072.61e-0658
GO:00224068Oral cavityOSCCmembrane docking52/730586/187234.50e-053.84e-0452
GO:01400566Oral cavityOSCCorganelle localization by membrane tethering43/730577/187232.00e-039.28e-0343
GO:00070296SkincSCCendoplasmic reticulum organization42/486487/187236.36e-068.92e-0542
GO:002240610SkincSCCmembrane docking41/486486/187231.20e-051.53e-0441
GO:01400568SkincSCCorganelle localization by membrane tethering34/486477/187234.10e-043.18e-0334
GO:000702915ThyroidPTCendoplasmic reticulum organization51/596887/187232.37e-074.15e-0651
GO:002240615ThyroidPTCmembrane docking48/596886/187233.72e-064.73e-0548
GO:01400569ThyroidPTCorganelle localization by membrane tethering40/596877/187231.98e-041.49e-0340
GO:000702921ThyroidATCendoplasmic reticulum organization51/629387/187231.47e-061.81e-0551
GO:002240622ThyroidATCmembrane docking49/629386/187237.13e-067.34e-0549
GO:014005613ThyroidATCorganelle localization by membrane tethering41/629377/187232.97e-041.88e-0341
Page: 1 

check button Enriched KEGG pathways.
Pathway IDTissueDisease StageDescriptionGene RatioBg Ratiopvaluep.adjustqvalueCount
Page: 1 

Top

Cell-cell communication analysis

check buttonIdentification of potential cell-cell interactions between two cell types and their ligand-receptor pairs for different disease states
LigandReceptorLRpairPathwayTissueDisease Stage
Page: 1 

Top

Single-cell gene regulatory network inference analysis

check buttonFind out the significant the regulons (TFs) and the target genes of each regulon across cell types for different disease states
TFCell TypeTissueDisease StageTarget GeneRSSRegulon Activity
∗The dot plots of a searched regulon are shown for all cell subpopulations in each disease state of each tissue based on the regulon specific score inferred using pySCENIC and by calculating the average expression.
Page: 1 

Top

Somatic mutation of malignant transformation related genes

check buttonAnnotation of somatic variants for genes involved in malignant transformation
Hugo SymbolVariant ClassVariant ClassificationdbSNP RSHGVScHGVSpHGVSp ShortSWISSPROTBIOTYPESIFTPolyPhenTumor Sample BarcodeTissueHistologySexAgeStageTherapy TypesDrugsOutcome
ESYT1SNVMissense_Mutationrs762719993c.2446N>Tp.Arg816Trpp.R816WQ9BSJ8protein_codingdeleterious(0.01)possibly_damaging(0.702)TCGA-A1-A0SM-01Breastbreast invasive carcinomaMale>=65I/IIUnknownUnknownSD
ESYT1SNVMissense_Mutationnovelc.1551N>Gp.Ile517Metp.I517MQ9BSJ8protein_codingdeleterious(0.01)possibly_damaging(0.576)TCGA-A7-A6VY-01Breastbreast invasive carcinomaFemale<65I/IIChemotherapycyclophosphamideCR
ESYT1SNVMissense_Mutationc.1456C>Tp.Arg486Trpp.R486WQ9BSJ8protein_codingdeleterious(0.01)probably_damaging(0.99)TCGA-A8-A08P-01Breastbreast invasive carcinomaFemale>=65III/IVChemotherapy5-fluorouracilCR
ESYT1SNVMissense_Mutationc.850N>Ap.Pro284Thrp.P284TQ9BSJ8protein_codingdeleterious(0.01)probably_damaging(1)TCGA-AN-A049-01Breastbreast invasive carcinomaFemale<65I/IIUnknownUnknownSD
ESYT1SNVMissense_Mutationrs373722430c.1016N>Ap.Arg339Glnp.R339QQ9BSJ8protein_codingtolerated(1)benign(0.005)TCGA-AR-A0TX-01Breastbreast invasive carcinomaFemale<65I/IIUnknownUnknownSD
ESYT1SNVMissense_Mutationc.2051N>Tp.Ser684Leup.S684LQ9BSJ8protein_codingdeleterious(0)probably_damaging(0.999)TCGA-BH-A0W7-01Breastbreast invasive carcinomaFemale<65I/IIChemotherapytaxotereCR
ESYT1SNVMissense_Mutationnovelc.1059N>Tp.Glu353Aspp.E353DQ9BSJ8protein_codingtolerated(0.27)benign(0.013)TCGA-C8-A3M7-01Breastbreast invasive carcinomaFemale<65III/IVUnknownUnknownPD
ESYT1SNVMissense_Mutationrs762719993c.2446N>Tp.Arg816Trpp.R816WQ9BSJ8protein_codingdeleterious(0.01)possibly_damaging(0.702)TCGA-EW-A1PA-01Breastbreast invasive carcinomaFemale<65I/IIChemotherapycyclophosphamideSD
ESYT1insertionFrame_Shift_Insnovelc.50_51insTGGCGGTGCTGACTTCATTCGGGAGGCGGTTGp.Ser18GlyfsTer49p.S18Gfs*49Q9BSJ8protein_codingTCGA-AO-A12D-01Breastbreast invasive carcinomaFemale<65I/IIChemotherapycyclophosphamideSD
ESYT1deletionFrame_Shift_Delc.2022delNp.Phe675SerfsTer6p.F675Sfs*6Q9BSJ8protein_codingTCGA-EW-A2FV-01Breastbreast invasive carcinomaFemale<65III/IVChemotherapydocetaxelSD
Page: 1 2 3 4 5 6 7 8 9 10 

Top

Related drugs of malignant transformation related genes

check buttonIdentification of chemicals and drugs interact with genes involved in malignant transfromation
(DGIdb 4.0)
Entrez IDSymbolCategoryInteraction TypesDrug Claim NameDrug NamePMIDs
Page: 1