
|
|||||
|
 | |
| |
| |
| |
| |
| |
|
Gene: ESRRG |
Gene summary for ESRRG |
| Gene information | Species | Human | Gene symbol | ESRRG | Gene ID | 2104 |
| Gene name | estrogen related receptor gamma | |
| Gene Alias | ERR-gamma | |
| Cytomap | 1q41 | |
| Gene Type | protein-coding | GO ID | GO:0001659 | UniProtAcc | F1D8R6 |
Top |
Malignant transformation analysis |
| Identification of the aberrant gene expression in precancerous and cancerous lesions by comparing the gene expression of stem-like cells in diseased tissues with normal stem cells |
| Entrez ID | Symbol | Replicates | Species | Organ | Tissue | Adj P-value | Log2FC | Malignancy |
| 2104 | ESRRG | HTA11_3410_2000001011 | Human | Colorectum | AD | 6.23e-05 | -2.67e-01 | 0.0155 |
| 2104 | ESRRG | HTA11_347_2000001011 | Human | Colorectum | AD | 8.71e-06 | -3.25e-01 | -0.1954 |
| 2104 | ESRRG | HTA11_83_2000001011 | Human | Colorectum | SER | 5.68e-06 | 7.71e-01 | -0.1526 |
| 2104 | ESRRG | HTA11_7663_2000001011 | Human | Colorectum | SER | 4.95e-06 | 9.62e-01 | 0.0131 |
| 2104 | ESRRG | HTA11_99999970781_79442 | Human | Colorectum | MSS | 1.44e-02 | -8.64e-02 | 0.294 |
| 2104 | ESRRG | HTA11_99999974143_84620 | Human | Colorectum | MSS | 4.98e-14 | -3.92e-01 | 0.3005 |
| 2104 | ESRRG | A002-C-010 | Human | Colorectum | FAP | 4.75e-06 | -2.65e-01 | 0.242 |
| 2104 | ESRRG | A015-C-203 | Human | Colorectum | FAP | 7.08e-03 | -6.64e-02 | -0.1294 |
| 2104 | ESRRG | A002-C-201 | Human | Colorectum | FAP | 3.94e-02 | -3.38e-01 | 0.0324 |
| 2104 | ESRRG | A002-C-203 | Human | Colorectum | FAP | 2.38e-07 | -3.33e-01 | 0.2786 |
| 2104 | ESRRG | A001-C-108 | Human | Colorectum | FAP | 2.51e-09 | -3.60e-01 | -0.0272 |
| 2104 | ESRRG | A002-C-205 | Human | Colorectum | FAP | 3.02e-03 | -3.06e-01 | -0.1236 |
| 2104 | ESRRG | A001-C-104 | Human | Colorectum | FAP | 6.51e-05 | -3.35e-01 | 0.0184 |
| 2104 | ESRRG | A015-C-005 | Human | Colorectum | FAP | 8.02e-04 | -4.17e-01 | -0.0336 |
| 2104 | ESRRG | A015-C-006 | Human | Colorectum | FAP | 1.81e-02 | -3.50e-01 | -0.0994 |
| 2104 | ESRRG | A002-C-114 | Human | Colorectum | FAP | 1.03e-04 | -3.93e-01 | -0.1561 |
| 2104 | ESRRG | A015-C-104 | Human | Colorectum | FAP | 1.34e-05 | -2.20e-02 | -0.1899 |
| 2104 | ESRRG | A001-C-014 | Human | Colorectum | FAP | 2.35e-06 | -3.27e-01 | 0.0135 |
| 2104 | ESRRG | A002-C-016 | Human | Colorectum | FAP | 2.78e-10 | -3.36e-01 | 0.0521 |
| 2104 | ESRRG | A001-C-203 | Human | Colorectum | FAP | 3.70e-03 | -2.28e-01 | -0.0481 |
| Page: 1 2 3 |
| Tissue | Expression Dynamics | Abbreviation |
| Colorectum (GSE201348) |  | FAP: Familial adenomatous polyposis |
| CRC: Colorectal cancer | ||
| Colorectum (HTA11) |  | AD: Adenomas |
| SER: Sessile serrated lesions | ||
| MSI-H: Microsatellite-high colorectal cancer | ||
| MSS: Microsatellite stable colorectal cancer | ||
| Endometrium |  | AEH: Atypical endometrial hyperplasia |
| EEC: Endometrioid Cancer | ||
| Prostate | 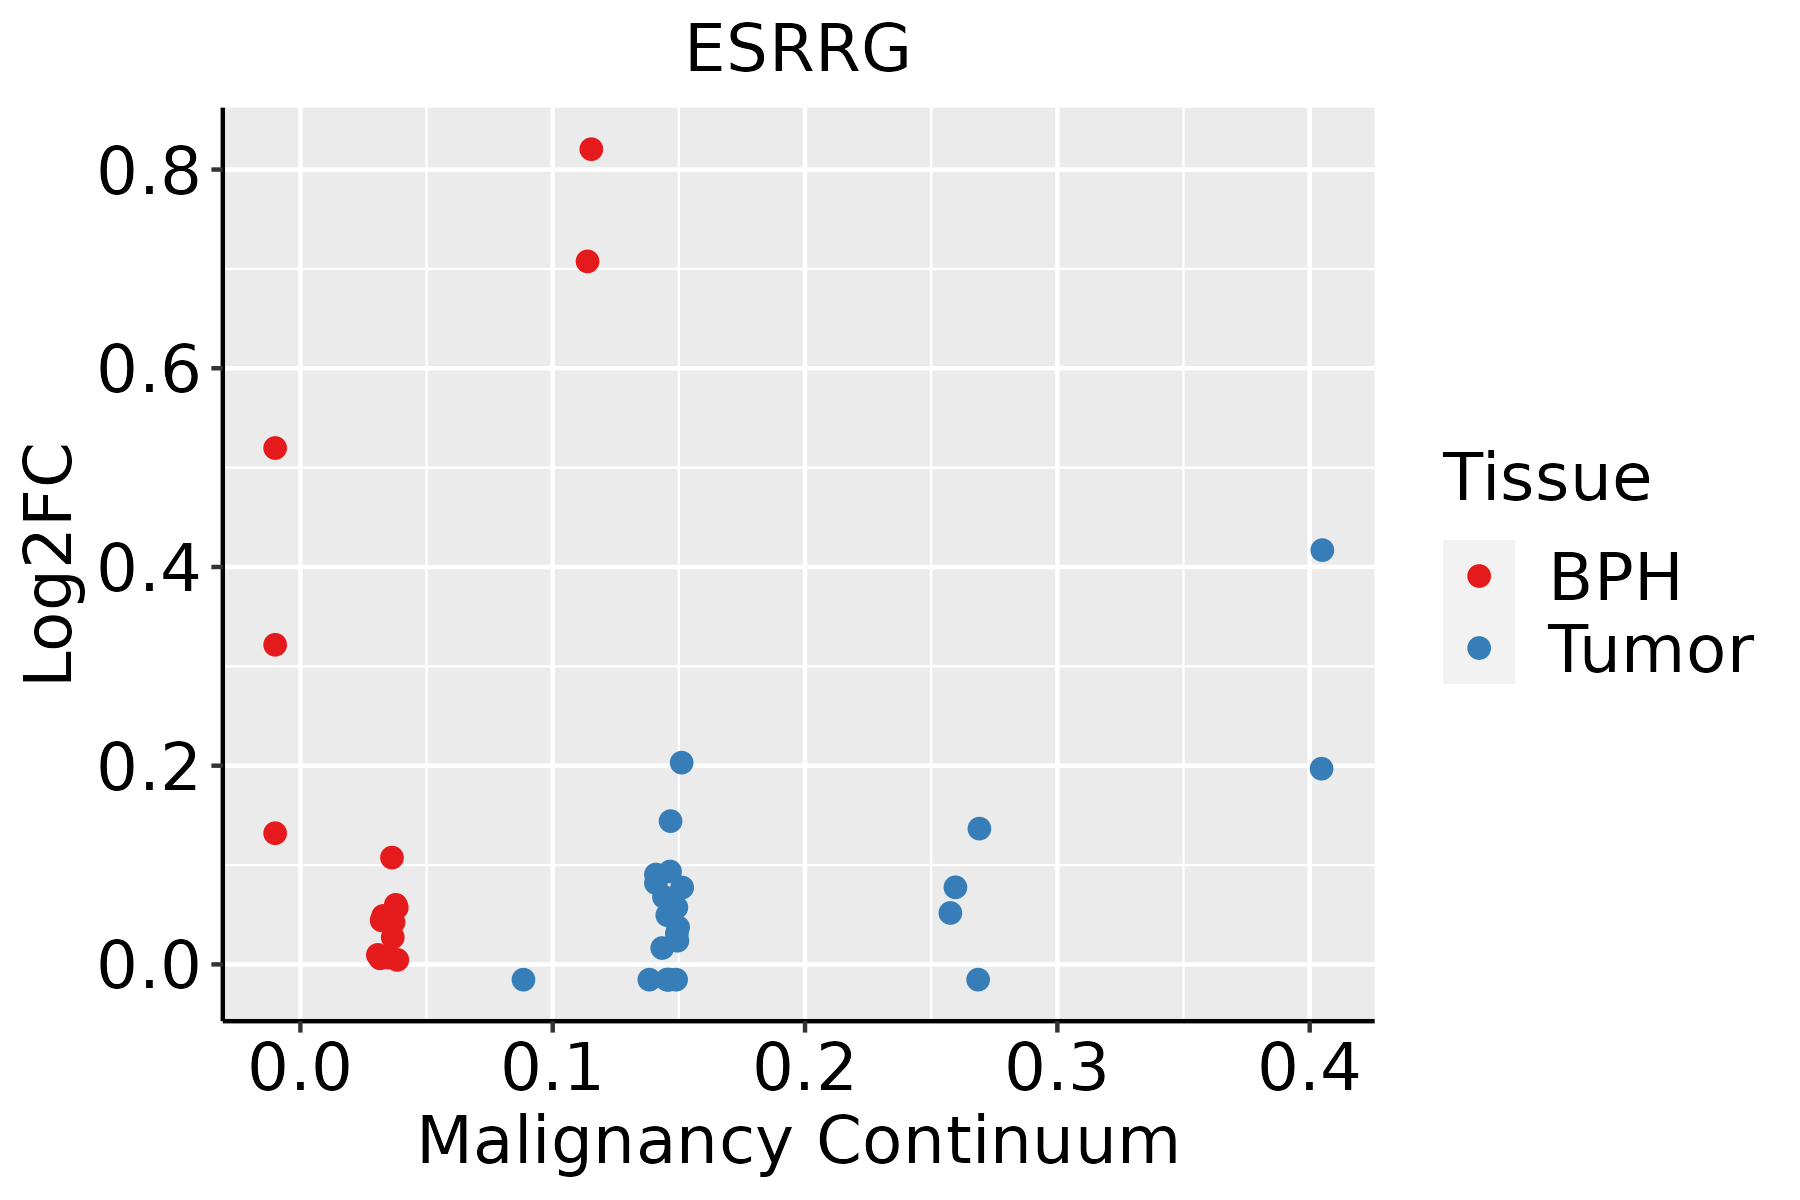 | BPH: Benign Prostatic Hyperplasia |
| ∗log2FC in expression of this searched gene in stem-like cells from each diseased tissue sample relative to stem-like cells in normal samples in each tissue plotted against the malignancy continuum. Samples are colored based on if they are from different disease stage. |
Top |
Malignant transformation related pathway analysis |
| Find out the enriched GO biological processes and KEGG pathways involved in transition from healthy to precancer to cancer |
| Tissue | Disease Stage | Enriched GO biological Processes |
| Colorectum | AD |  |
| Colorectum | SER |  |
| Colorectum | MSS |  |
| Colorectum | MSI-H |  |
| Colorectum | FAP |  |
| ∗Top 15 enriched GO BP terms are showed in the bar plot of each disease state in each tissue. Each row represents a significant GO biological process which is colored according to the -log10(p.adjust). |
| Page: 1 2 3 4 5 6 7 8 9 |
| GO ID | Tissue | Disease Stage | Description | Gene Ratio | Bg Ratio | pvalue | p.adjust | Count |
| GO:0071383 | Colorectum | AD | cellular response to steroid hormone stimulus | 73/3918 | 204/18723 | 6.31e-07 | 2.24e-05 | 73 |
| GO:0030522 | Colorectum | AD | intracellular receptor signaling pathway | 87/3918 | 265/18723 | 3.69e-06 | 1.03e-04 | 87 |
| GO:0043401 | Colorectum | AD | steroid hormone mediated signaling pathway | 51/3918 | 136/18723 | 6.52e-06 | 1.63e-04 | 51 |
| GO:0048545 | Colorectum | AD | response to steroid hormone | 104/3918 | 339/18723 | 1.33e-05 | 2.90e-04 | 104 |
| GO:0009755 | Colorectum | AD | hormone-mediated signaling pathway | 64/3918 | 190/18723 | 2.78e-05 | 5.24e-04 | 64 |
| GO:0120162 | Colorectum | AD | positive regulation of cold-induced thermogenesis | 32/3918 | 97/18723 | 3.74e-03 | 2.63e-02 | 32 |
| GO:0106106 | Colorectum | AD | cold-induced thermogenesis | 43/3918 | 144/18723 | 7.05e-03 | 4.31e-02 | 43 |
| GO:0120161 | Colorectum | AD | regulation of cold-induced thermogenesis | 43/3918 | 144/18723 | 7.05e-03 | 4.31e-02 | 43 |
| GO:1990845 | Colorectum | AD | adaptive thermogenesis | 46/3918 | 157/18723 | 7.97e-03 | 4.73e-02 | 46 |
| GO:00713831 | Colorectum | SER | cellular response to steroid hormone stimulus | 55/2897 | 204/18723 | 1.66e-05 | 5.05e-04 | 55 |
| GO:00485451 | Colorectum | SER | response to steroid hormone | 80/2897 | 339/18723 | 5.15e-05 | 1.25e-03 | 80 |
| GO:00434011 | Colorectum | SER | steroid hormone mediated signaling pathway | 38/2897 | 136/18723 | 1.42e-04 | 2.82e-03 | 38 |
| GO:00097551 | Colorectum | SER | hormone-mediated signaling pathway | 49/2897 | 190/18723 | 1.54e-04 | 3.00e-03 | 49 |
| GO:00305221 | Colorectum | SER | intracellular receptor signaling pathway | 63/2897 | 265/18723 | 2.47e-04 | 4.20e-03 | 63 |
| GO:00713832 | Colorectum | MSS | cellular response to steroid hormone stimulus | 72/3467 | 204/18723 | 8.87e-09 | 5.43e-07 | 72 |
| GO:00434012 | Colorectum | MSS | steroid hormone mediated signaling pathway | 51/3467 | 136/18723 | 1.43e-07 | 6.67e-06 | 51 |
| GO:00305222 | Colorectum | MSS | intracellular receptor signaling pathway | 84/3467 | 265/18723 | 1.47e-07 | 6.79e-06 | 84 |
| GO:00485452 | Colorectum | MSS | response to steroid hormone | 101/3467 | 339/18723 | 2.60e-07 | 1.10e-05 | 101 |
| GO:00097552 | Colorectum | MSS | hormone-mediated signaling pathway | 63/3467 | 190/18723 | 9.26e-07 | 3.23e-05 | 63 |
| GO:00713833 | Colorectum | FAP | cellular response to steroid hormone stimulus | 59/2622 | 204/18723 | 2.12e-08 | 2.06e-06 | 59 |
| Page: 1 2 3 4 |
| Pathway ID | Tissue | Disease Stage | Description | Gene Ratio | Bg Ratio | pvalue | p.adjust | qvalue | Count |
| Page: 1 |
Top |
Cell-cell communication analysis |
| Identification of potential cell-cell interactions between two cell types and their ligand-receptor pairs for different disease states |
| Ligand | Receptor | LRpair | Pathway | Tissue | Disease Stage |
| Page: 1 |
Top |
Single-cell gene regulatory network inference analysis |
| Find out the significant the regulons (TFs) and the target genes of each regulon across cell types for different disease states |
| TF | Cell Type | Tissue | Disease Stage | Target Gene | RSS | Regulon Activity |
| ESRRG | LUMP | Breast | ADJ | SYT13,SP6,SLFN5, etc. | 2.48e-01 |  |
| ESRRG | CAF | Liver | Cirrhotic | DACH1,DMD,LAMA2, etc. | 1.29e-02 |  |
| ∗The dot plots of a searched regulon are shown for all cell subpopulations in each disease state of each tissue based on the regulon specific score inferred using pySCENIC and by calculating the average expression. |
| Page: 1 |
Top |
Somatic mutation of malignant transformation related genes |
| Annotation of somatic variants for genes involved in malignant transformation |
| Hugo Symbol | Variant Class | Variant Classification | dbSNP RS | HGVSc | HGVSp | HGVSp Short | SWISSPROT | BIOTYPE | SIFT | PolyPhen | Tumor Sample Barcode | Tissue | Histology | Sex | Age | Stage | Therapy Types | Drugs | Outcome |
| ESRRG | SNV | Missense_Mutation | rs751537343 | c.389A>G | p.Lys130Arg | p.K130R | P62508 | protein_coding | tolerated(0.17) | probably_damaging(0.969) | TCGA-AC-A23H-01 | Breast | breast invasive carcinoma | Female | >=65 | I/II | Unknown | Unknown | PD |
| ESRRG | SNV | Missense_Mutation | c.163N>T | p.Thr55Ser | p.T55S | P62508 | protein_coding | tolerated_low_confidence(0.6) | benign(0.344) | TCGA-AN-A0AK-01 | Breast | breast invasive carcinoma | Female | >=65 | I/II | Unknown | Unknown | SD | |
| ESRRG | SNV | Missense_Mutation | c.1113N>A | p.Met371Ile | p.M371I | P62508 | protein_coding | tolerated(0.1) | benign(0.001) | TCGA-B6-A0RL-01 | Breast | breast invasive carcinoma | Female | <65 | I/II | Unknown | Unknown | SD | |
| ESRRG | SNV | Missense_Mutation | novel | c.683N>C | p.Asn228Thr | p.N228T | P62508 | protein_coding | tolerated(0.45) | benign(0.275) | TCGA-BH-A1FH-01 | Breast | breast invasive carcinoma | Female | <65 | III/IV | Unknown | Unknown | PD |
| ESRRG | SNV | Missense_Mutation | c.151N>A | p.Pro51Thr | p.P51T | P62508 | protein_coding | deleterious(0) | probably_damaging(0.994) | TCGA-C8-A12X-01 | Breast | breast invasive carcinoma | Female | <65 | I/II | Unknown | Unknown | SD | |
| ESRRG | SNV | Missense_Mutation | c.424N>T | p.Gly142Trp | p.G142W | P62508 | protein_coding | deleterious(0) | probably_damaging(0.999) | TCGA-C8-A1HJ-01 | Breast | breast invasive carcinoma | Female | <65 | I/II | Unknown | Unknown | SD | |
| ESRRG | insertion | Nonsense_Mutation | novel | c.125_126insTATCTTTATATTTTAACAGAACTTATAAAGTAC | p.Ser42_Phe43insIlePheIlePheTerGlnAsnLeuTerSerThr | p.S42_F43insIFIF*QNL*ST | P62508 | protein_coding | TCGA-A8-A0A7-01 | Breast | breast invasive carcinoma | Female | <65 | I/II | Unknown | Unknown | SD | ||
| ESRRG | insertion | Nonsense_Mutation | novel | c.1044_1045insCTTTTGTTTTGACCCTATCTTTGAACTTTATCTTGGTTGC | p.Ser349LeufsTer4 | p.S349Lfs*4 | P62508 | protein_coding | TCGA-AO-A03R-01 | Breast | breast invasive carcinoma | Female | <65 | I/II | Chemotherapy | doxorubicin | SD | ||
| ESRRG | SNV | Missense_Mutation | novel | c.903C>A | p.Phe301Leu | p.F301L | P62508 | protein_coding | deleterious(0.04) | probably_damaging(0.962) | TCGA-2W-A8YY-01 | Cervix | cervical & endocervical cancer | Female | <65 | I/II | Chemotherapy | cisplatin | CR |
| ESRRG | SNV | Missense_Mutation | novel | c.1063C>A | p.Leu355Ile | p.L355I | P62508 | protein_coding | tolerated(0.31) | benign(0.284) | TCGA-C5-A8XH-01 | Cervix | cervical & endocervical cancer | Female | <65 | I/II | Unknown | Unknown | SD |
| Page: 1 2 3 4 5 6 7 8 9 10 11 |
Top |
Related drugs of malignant transformation related genes |
| Identification of chemicals and drugs interact with genes involved in malignant transfromation |
| (DGIdb 4.0) |
| Entrez ID | Symbol | Category | Interaction Types | Drug Claim Name | Drug Name | PMIDs |
| 2104 | ESRRG | DRUGGABLE GENOME, NUCLEAR HORMONE RECEPTOR | DES | DIETHYLSTILBESTROL | 12579585 | |
| 2104 | ESRRG | DRUGGABLE GENOME, NUCLEAR HORMONE RECEPTOR | agonist | 135649823 | ||
| 2104 | ESRRG | DRUGGABLE GENOME, NUCLEAR HORMONE RECEPTOR | agonist | 135650300 | GENISTEIN | |
| 2104 | ESRRG | DRUGGABLE GENOME, NUCLEAR HORMONE RECEPTOR | agonist | 135650324 | CHEMBL193836 | |
| 2104 | ESRRG | DRUGGABLE GENOME, NUCLEAR HORMONE RECEPTOR | antagonist | CHEMBL10041 | AFIMOXIFENE | |
| 2104 | ESRRG | DRUGGABLE GENOME, NUCLEAR HORMONE RECEPTOR | agonist | 135650213 | ||
| 2104 | ESRRG | DRUGGABLE GENOME, NUCLEAR HORMONE RECEPTOR | agonist | 135649858 | DAIDZEIN | |
| 2104 | ESRRG | DRUGGABLE GENOME, NUCLEAR HORMONE RECEPTOR | DIETHYLSTILBESTROL | DIETHYLSTILBESTROL | 12579585 | |
| 2104 | ESRRG | DRUGGABLE GENOME, NUCLEAR HORMONE RECEPTOR | agonist | 310264689 | CHEMBL201013 | |
| 2104 | ESRRG | DRUGGABLE GENOME, NUCLEAR HORMONE RECEPTOR | agonist | 135649800 | AFIMOXIFENE |
| Page: 1 2 |

Copyright 2023-Present -The University of Texas Health Science Center at Houston |