
|
|||||
|
 | |
| |
| |
| |
| |
| |
|
Gene: ESRRA |
Gene summary for ESRRA |
| Gene information | Species | Human | Gene symbol | ESRRA | Gene ID | 2101 |
| Gene name | estrogen related receptor alpha | |
| Gene Alias | ERR1 | |
| Cytomap | 11q13.1 | |
| Gene Type | protein-coding | GO ID | GO:0001501 | UniProtAcc | P11474 |
Top |
Malignant transformation analysis |
| Identification of the aberrant gene expression in precancerous and cancerous lesions by comparing the gene expression of stem-like cells in diseased tissues with normal stem cells |
| Entrez ID | Symbol | Replicates | Species | Organ | Tissue | Adj P-value | Log2FC | Malignancy |
| 2101 | ESRRA | HTA11_3410_2000001011 | Human | Colorectum | AD | 4.78e-06 | -3.46e-01 | 0.0155 |
| 2101 | ESRRA | HTA11_866_3004761011 | Human | Colorectum | AD | 2.65e-03 | -3.43e-01 | 0.096 |
| 2101 | ESRRA | HTA11_6818_2000001021 | Human | Colorectum | AD | 2.22e-02 | -4.43e-01 | 0.0588 |
| 2101 | ESRRA | HTA11_99999970781_79442 | Human | Colorectum | MSS | 7.42e-11 | -4.33e-01 | 0.294 |
| 2101 | ESRRA | F007 | Human | Colorectum | FAP | 1.08e-05 | -4.58e-01 | 0.1176 |
| 2101 | ESRRA | A002-C-010 | Human | Colorectum | FAP | 1.31e-02 | -2.89e-01 | 0.242 |
| 2101 | ESRRA | A001-C-207 | Human | Colorectum | FAP | 1.18e-04 | -3.02e-01 | 0.1278 |
| 2101 | ESRRA | A015-C-203 | Human | Colorectum | FAP | 1.04e-21 | -1.59e-01 | -0.1294 |
| 2101 | ESRRA | A015-C-204 | Human | Colorectum | FAP | 2.23e-02 | -1.02e-01 | -0.0228 |
| 2101 | ESRRA | A014-C-040 | Human | Colorectum | FAP | 3.68e-02 | -2.59e-01 | -0.1184 |
| 2101 | ESRRA | A002-C-201 | Human | Colorectum | FAP | 7.18e-09 | -1.94e-01 | 0.0324 |
| 2101 | ESRRA | A002-C-203 | Human | Colorectum | FAP | 1.95e-04 | -1.59e-01 | 0.2786 |
| 2101 | ESRRA | A001-C-119 | Human | Colorectum | FAP | 1.07e-10 | -4.90e-01 | -0.1557 |
| 2101 | ESRRA | A001-C-108 | Human | Colorectum | FAP | 4.25e-18 | -4.43e-01 | -0.0272 |
| 2101 | ESRRA | A002-C-205 | Human | Colorectum | FAP | 5.76e-19 | -4.61e-01 | -0.1236 |
| 2101 | ESRRA | A001-C-104 | Human | Colorectum | FAP | 1.17e-08 | -3.38e-01 | 0.0184 |
| 2101 | ESRRA | A015-C-005 | Human | Colorectum | FAP | 4.33e-05 | -2.74e-01 | -0.0336 |
| 2101 | ESRRA | A015-C-006 | Human | Colorectum | FAP | 1.42e-09 | -2.85e-01 | -0.0994 |
| 2101 | ESRRA | A015-C-106 | Human | Colorectum | FAP | 2.30e-05 | -1.26e-01 | -0.0511 |
| 2101 | ESRRA | A002-C-114 | Human | Colorectum | FAP | 2.12e-12 | -2.88e-01 | -0.1561 |
| Page: 1 2 3 4 5 6 7 8 |
| Tissue | Expression Dynamics | Abbreviation |
| Colorectum (GSE201348) |  | FAP: Familial adenomatous polyposis |
| CRC: Colorectal cancer | ||
| Colorectum (HTA11) |  | AD: Adenomas |
| SER: Sessile serrated lesions | ||
| MSI-H: Microsatellite-high colorectal cancer | ||
| MSS: Microsatellite stable colorectal cancer | ||
| Esophagus | 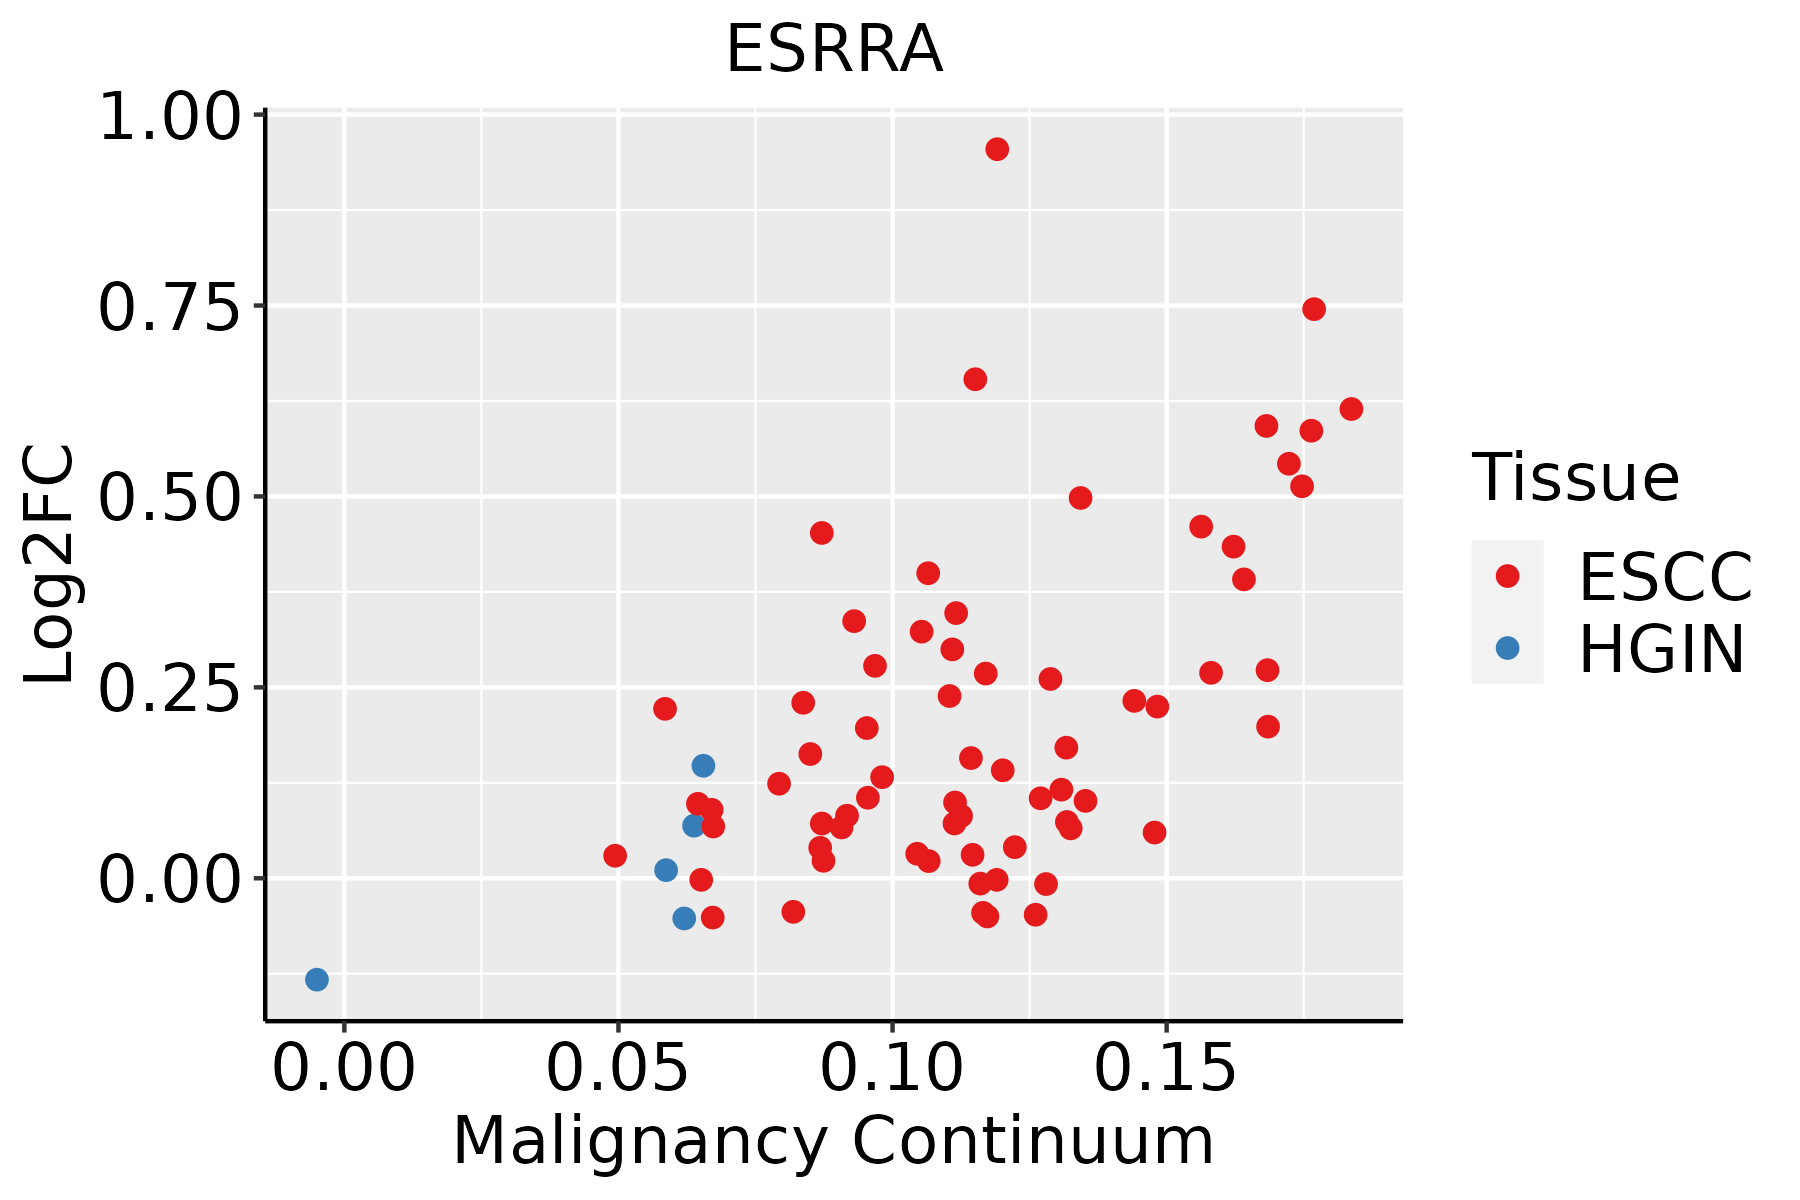 | ESCC: Esophageal squamous cell carcinoma |
| HGIN: High-grade intraepithelial neoplasias | ||
| LGIN: Low-grade intraepithelial neoplasias | ||
| Liver | 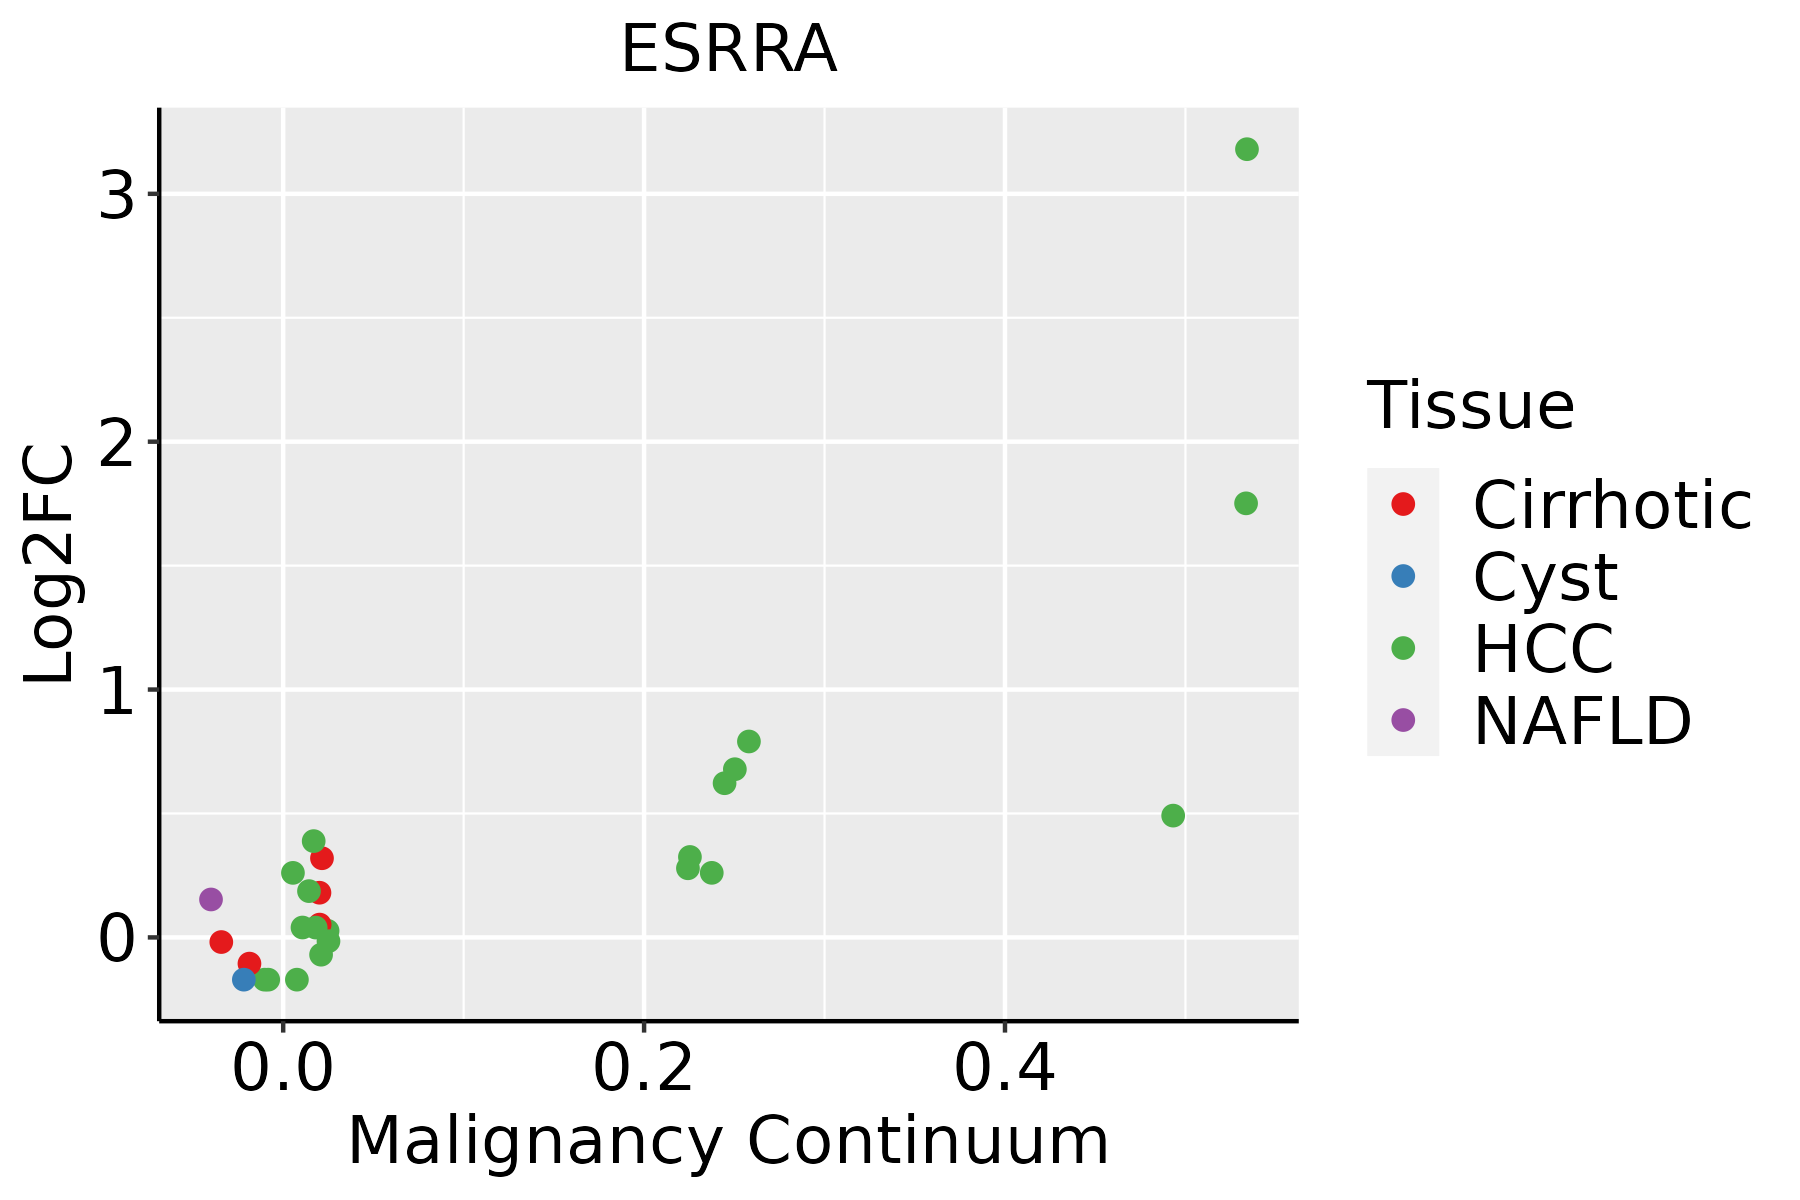 | HCC: Hepatocellular carcinoma |
| NAFLD: Non-alcoholic fatty liver disease | ||
| Oral Cavity | 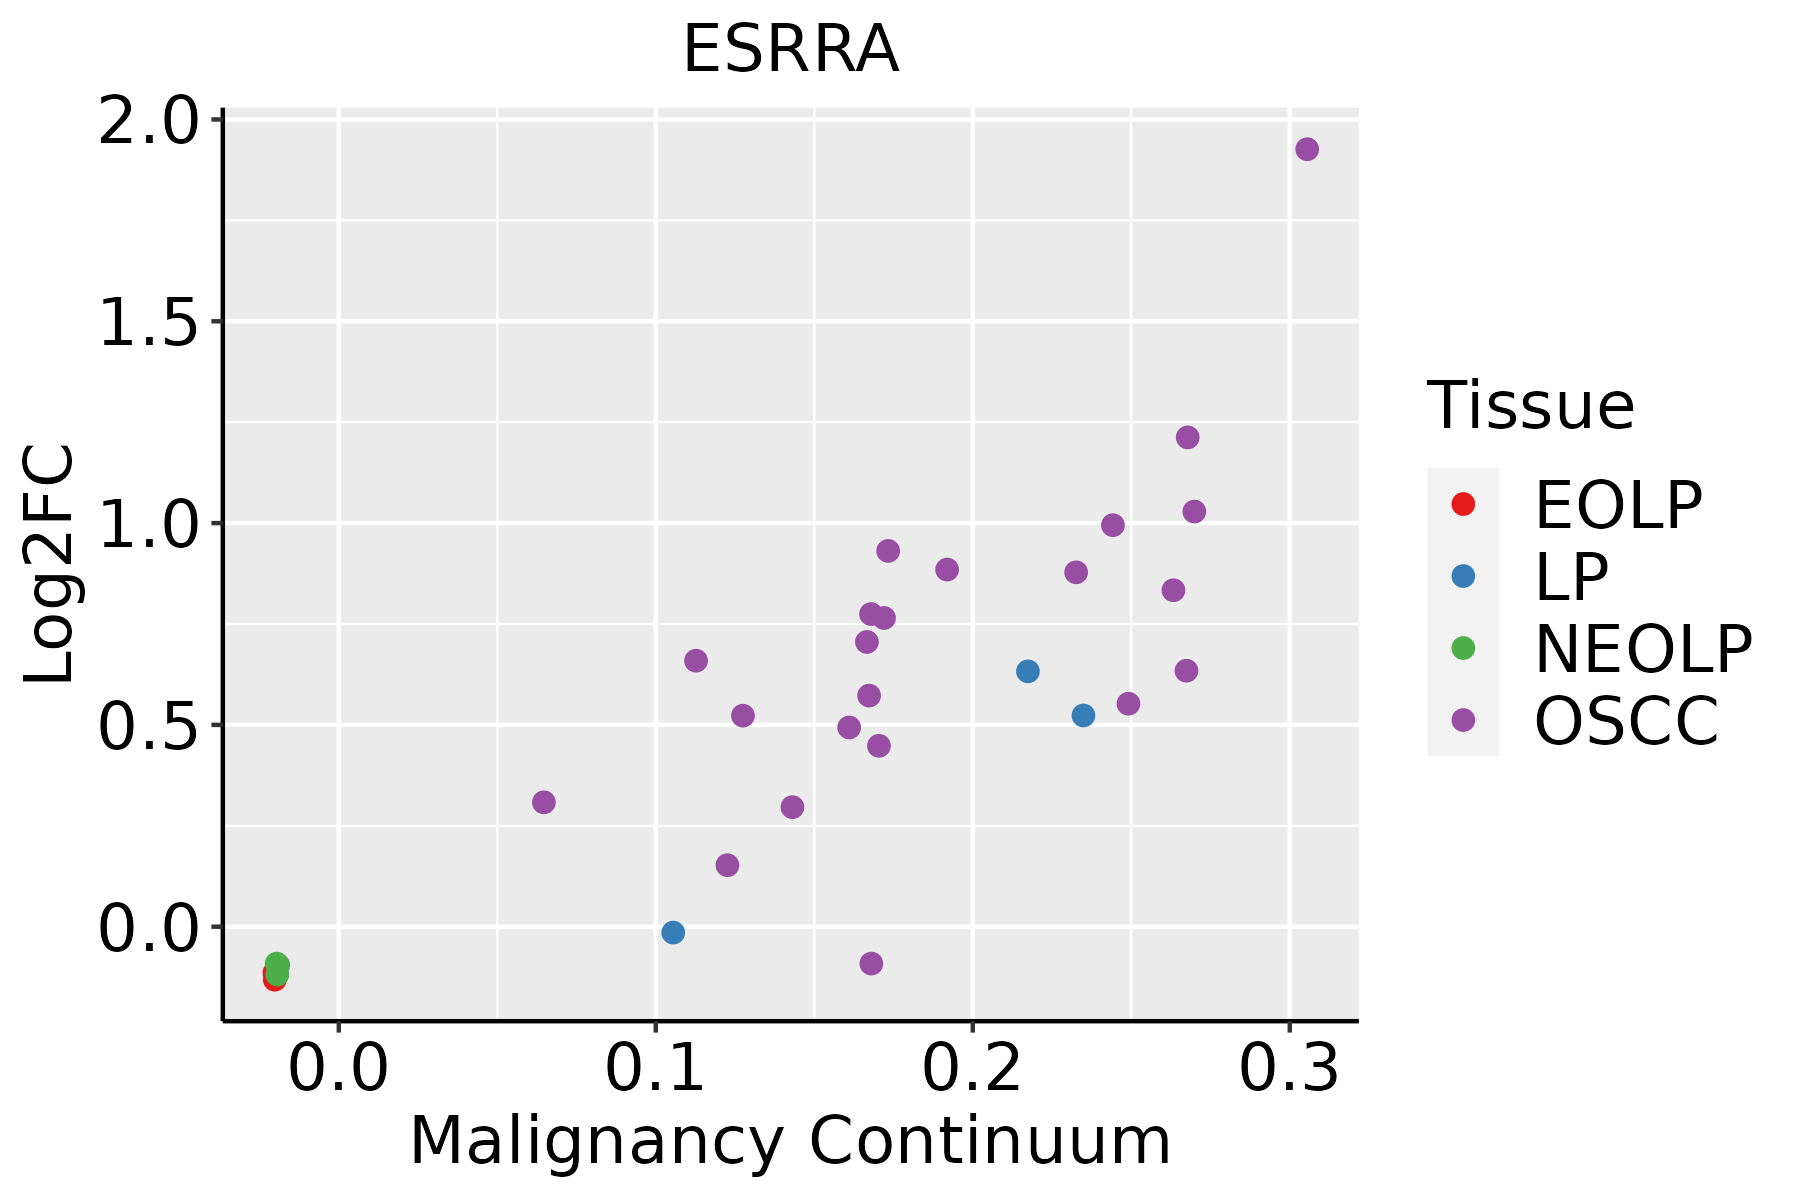 | EOLP: Erosive Oral lichen planus |
| LP: leukoplakia | ||
| NEOLP: Non-erosive oral lichen planus | ||
| OSCC: Oral squamous cell carcinoma | ||
| Skin | 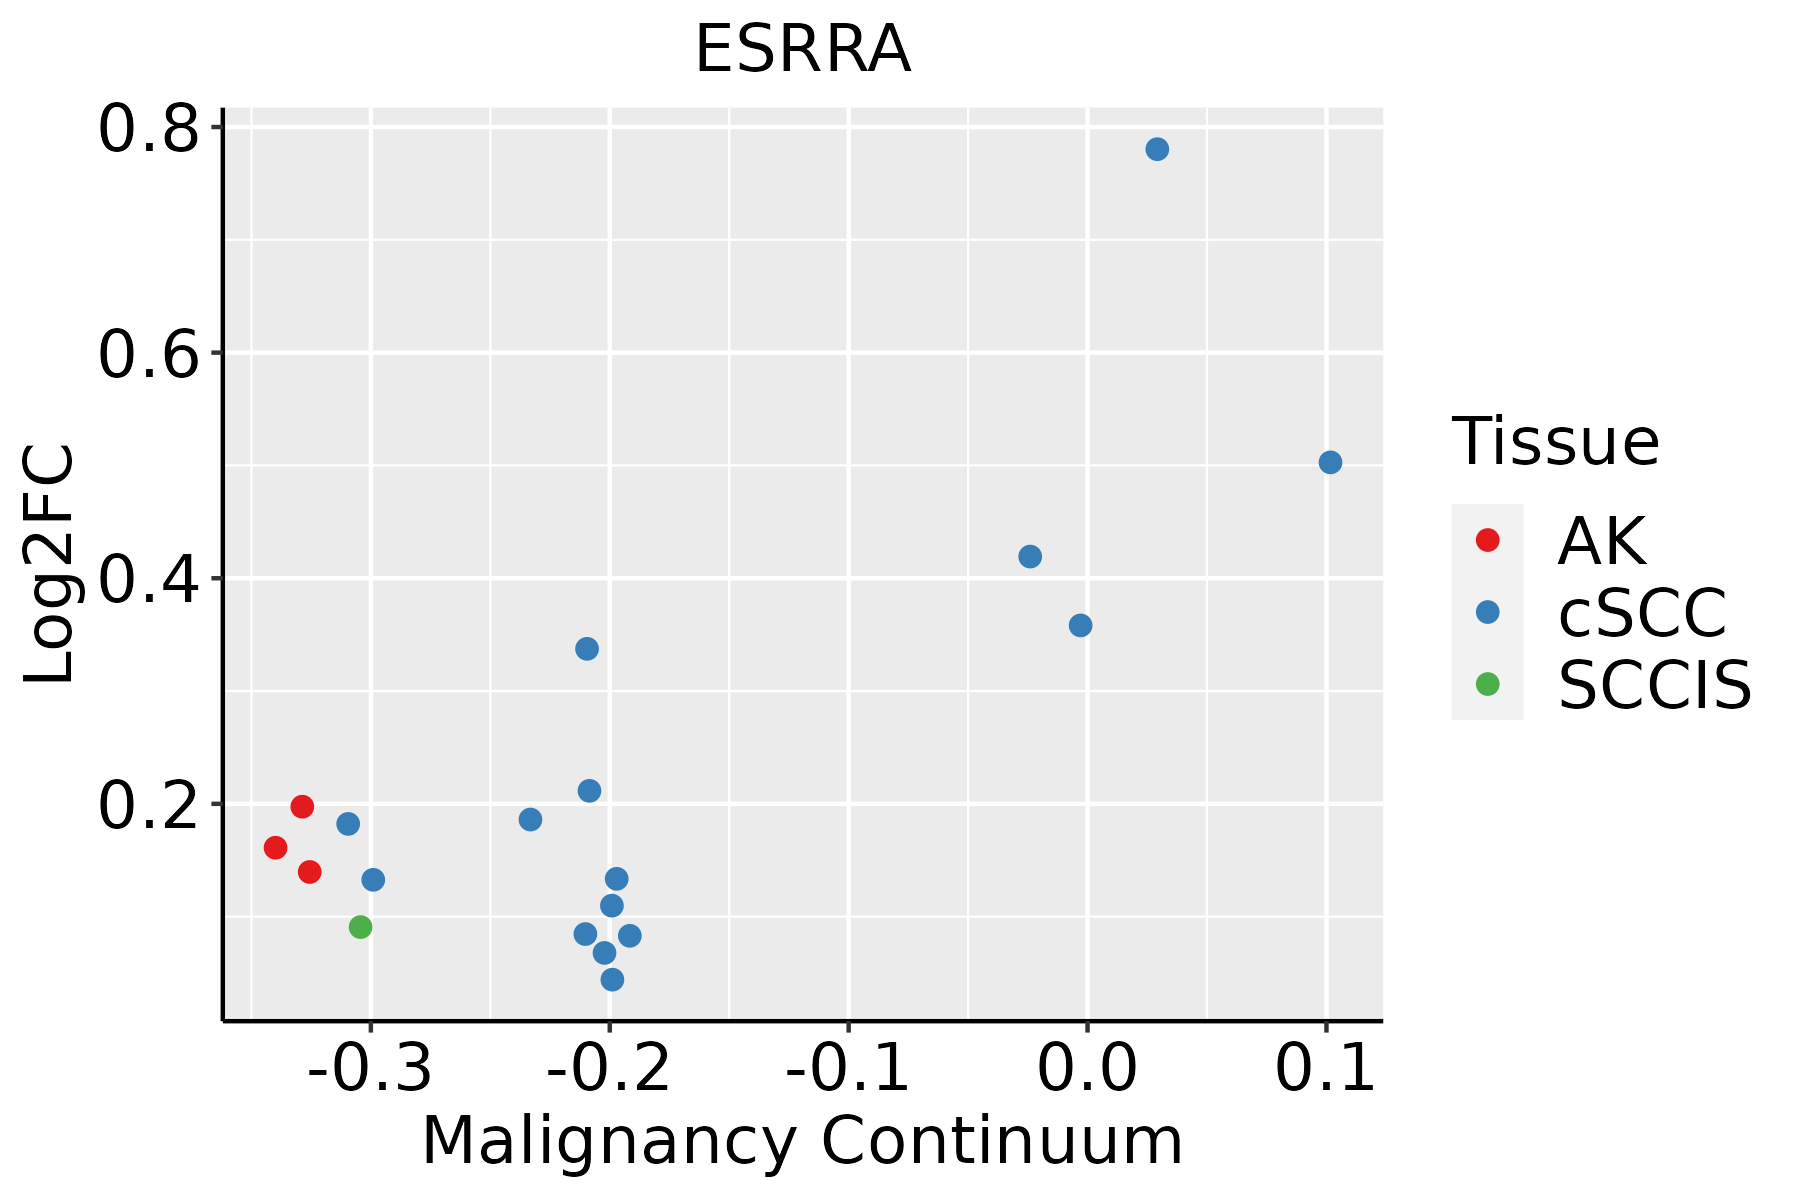 | AK: Actinic keratosis |
| cSCC: Cutaneous squamous cell carcinoma | ||
| SCCIS:squamous cell carcinoma in situ | ||
| Thyroid | 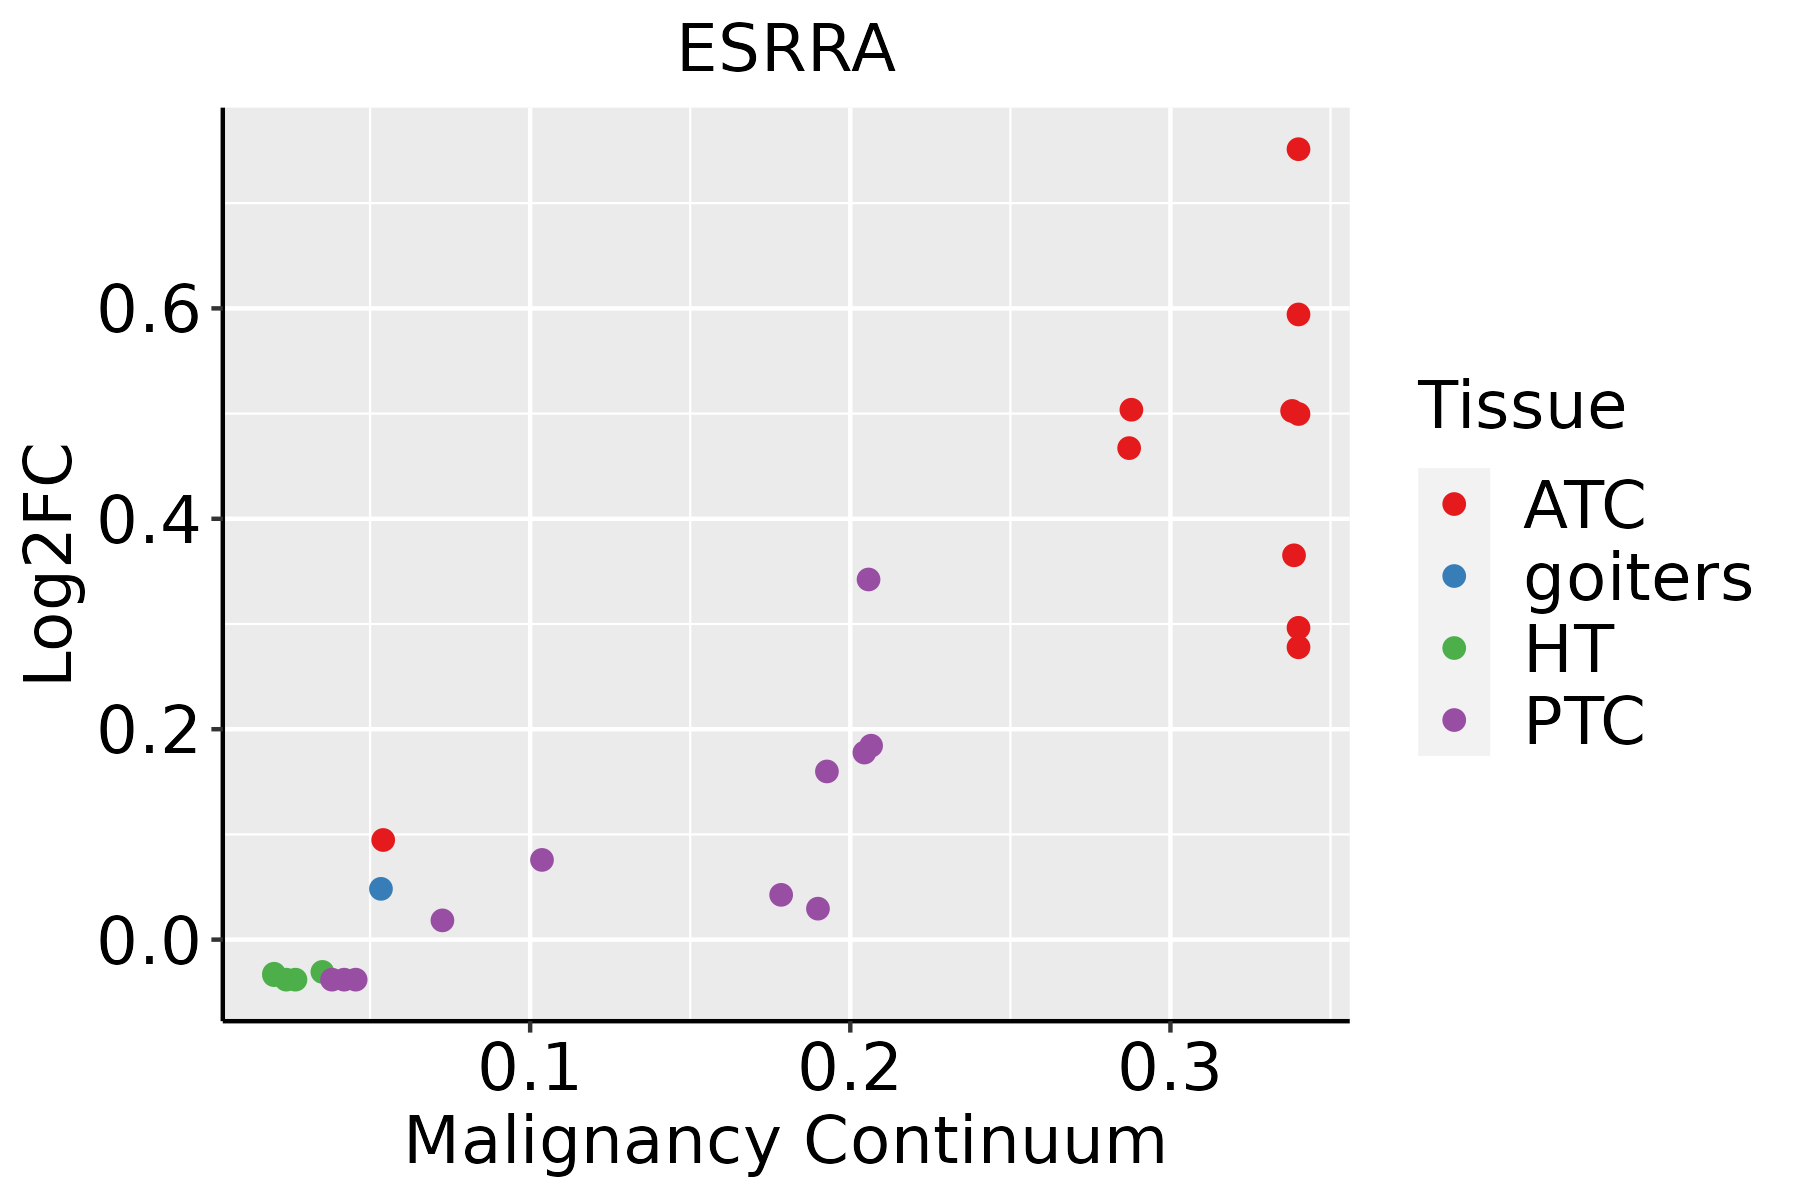 | ATC: Anaplastic thyroid cancer |
| HT: Hashimoto's thyroiditis | ||
| PTC: Papillary thyroid cancer |
| ∗log2FC in expression of this searched gene in stem-like cells from each diseased tissue sample relative to stem-like cells in normal samples in each tissue plotted against the malignancy continuum. Samples are colored based on if they are from different disease stage. |
Top |
Malignant transformation related pathway analysis |
| Find out the enriched GO biological processes and KEGG pathways involved in transition from healthy to precancer to cancer |
| Tissue | Disease Stage | Enriched GO biological Processes |
| Colorectum | AD |  |
| Colorectum | SER |  |
| Colorectum | MSS |  |
| Colorectum | MSI-H |  |
| Colorectum | FAP |  |
| ∗Top 15 enriched GO BP terms are showed in the bar plot of each disease state in each tissue. Each row represents a significant GO biological process which is colored according to the -log10(p.adjust). |
| Page: 1 2 3 4 5 6 7 8 9 |
| GO ID | Tissue | Disease Stage | Description | Gene Ratio | Bg Ratio | pvalue | p.adjust | Count |
| GO:0032868 | Colorectum | AD | response to insulin | 91/3918 | 264/18723 | 2.02e-07 | 8.48e-06 | 91 |
| GO:0071383 | Colorectum | AD | cellular response to steroid hormone stimulus | 73/3918 | 204/18723 | 6.31e-07 | 2.24e-05 | 73 |
| GO:1901653 | Colorectum | AD | cellular response to peptide | 114/3918 | 359/18723 | 8.32e-07 | 2.88e-05 | 114 |
| GO:0032869 | Colorectum | AD | cellular response to insulin stimulus | 72/3918 | 203/18723 | 1.10e-06 | 3.68e-05 | 72 |
| GO:0030099 | Colorectum | AD | myeloid cell differentiation | 119/3918 | 381/18723 | 1.24e-06 | 4.01e-05 | 119 |
| GO:0071375 | Colorectum | AD | cellular response to peptide hormone stimulus | 95/3918 | 290/18723 | 1.50e-06 | 4.66e-05 | 95 |
| GO:0043434 | Colorectum | AD | response to peptide hormone | 126/3918 | 414/18723 | 2.70e-06 | 7.86e-05 | 126 |
| GO:0030522 | Colorectum | AD | intracellular receptor signaling pathway | 87/3918 | 265/18723 | 3.69e-06 | 1.03e-04 | 87 |
| GO:0043401 | Colorectum | AD | steroid hormone mediated signaling pathway | 51/3918 | 136/18723 | 6.52e-06 | 1.63e-04 | 51 |
| GO:0048545 | Colorectum | AD | response to steroid hormone | 104/3918 | 339/18723 | 1.33e-05 | 2.90e-04 | 104 |
| GO:0009755 | Colorectum | AD | hormone-mediated signaling pathway | 64/3918 | 190/18723 | 2.78e-05 | 5.24e-04 | 64 |
| GO:0001649 | Colorectum | AD | osteoblast differentiation | 70/3918 | 229/18723 | 3.59e-04 | 4.18e-03 | 70 |
| GO:1903706 | Colorectum | AD | regulation of hemopoiesis | 99/3918 | 367/18723 | 3.08e-03 | 2.28e-02 | 99 |
| GO:0045637 | Colorectum | AD | regulation of myeloid cell differentiation | 61/3918 | 210/18723 | 3.17e-03 | 2.35e-02 | 61 |
| GO:0002573 | Colorectum | AD | myeloid leukocyte differentiation | 60/3918 | 208/18723 | 4.03e-03 | 2.81e-02 | 60 |
| GO:0001503 | Colorectum | AD | ossification | 106/3918 | 408/18723 | 7.68e-03 | 4.64e-02 | 106 |
| GO:1900078 | Colorectum | AD | positive regulation of cellular response to insulin stimulus | 11/3918 | 25/18723 | 7.89e-03 | 4.73e-02 | 11 |
| GO:00713832 | Colorectum | MSS | cellular response to steroid hormone stimulus | 72/3467 | 204/18723 | 8.87e-09 | 5.43e-07 | 72 |
| GO:00434012 | Colorectum | MSS | steroid hormone mediated signaling pathway | 51/3467 | 136/18723 | 1.43e-07 | 6.67e-06 | 51 |
| GO:00305222 | Colorectum | MSS | intracellular receptor signaling pathway | 84/3467 | 265/18723 | 1.47e-07 | 6.79e-06 | 84 |
| Page: 1 2 3 4 5 6 7 8 9 10 11 |
| Pathway ID | Tissue | Disease Stage | Description | Gene Ratio | Bg Ratio | pvalue | p.adjust | qvalue | Count |
| Page: 1 |
Top |
Cell-cell communication analysis |
| Identification of potential cell-cell interactions between two cell types and their ligand-receptor pairs for different disease states |
| Ligand | Receptor | LRpair | Pathway | Tissue | Disease Stage |
| Page: 1 |
Top |
Single-cell gene regulatory network inference analysis |
| Find out the significant the regulons (TFs) and the target genes of each regulon across cell types for different disease states |
| TF | Cell Type | Tissue | Disease Stage | Target Gene | RSS | Regulon Activity |
| ESRRA | ABS | Colorectum | FAP | SELENBP1,LINGO1,GPT, etc. | 2.00e-01 |  |
| ESRRA | KER | Esophagus | ESCC | RPS25,RNF26,PPP1R14B, etc. | 3.65e-01 |  |
| ESRRA | LYMEND | Pancreas | ADJ | SOX9,CLDN4,ADRA2A, etc. | 1.92e-01 |  |
| ESRRA | STM | Stomach | SIM | LRIF1,MT-ATP8,CHCHD10, etc. | 4.75e-01 |  |
| ∗The dot plots of a searched regulon are shown for all cell subpopulations in each disease state of each tissue based on the regulon specific score inferred using pySCENIC and by calculating the average expression. |
| Page: 1 |
Top |
Somatic mutation of malignant transformation related genes |
| Annotation of somatic variants for genes involved in malignant transformation |
| Hugo Symbol | Variant Class | Variant Classification | dbSNP RS | HGVSc | HGVSp | HGVSp Short | SWISSPROT | BIOTYPE | SIFT | PolyPhen | Tumor Sample Barcode | Tissue | Histology | Sex | Age | Stage | Therapy Types | Drugs | Outcome |
| ESRRA | insertion | Frame_Shift_Ins | novel | c.278_279insAGAGA | p.Ala94GlufsTer103 | p.A94Efs*103 | P11474 | protein_coding | TCGA-DS-A1OB-01 | Cervix | cervical & endocervical cancer | Female | <65 | I/II | Chemotherapy | carboplatin | PD | ||
| ESRRA | SNV | Missense_Mutation | c.902N>A | p.Gly301Asp | p.G301D | P11474 | protein_coding | deleterious(0.02) | probably_damaging(1) | TCGA-AA-3672-01 | Colorectum | colon adenocarcinoma | Female | >=65 | III/IV | Unknown | Unknown | SD | |
| ESRRA | SNV | Missense_Mutation | c.775N>C | p.Ser259Pro | p.S259P | P11474 | protein_coding | deleterious(0.04) | probably_damaging(1) | TCGA-AZ-6598-01 | Colorectum | colon adenocarcinoma | Female | >=65 | I/II | Unknown | Unknown | SD | |
| ESRRA | SNV | Missense_Mutation | c.779N>C | p.Val260Ala | p.V260A | P11474 | protein_coding | deleterious(0.01) | possibly_damaging(0.831) | TCGA-DM-A0XF-01 | Colorectum | colon adenocarcinoma | Female | >=65 | III/IV | Chemotherapy | mayo | CR | |
| ESRRA | SNV | Missense_Mutation | c.1255G>A | p.Glu419Lys | p.E419K | P11474 | protein_coding | deleterious(0) | probably_damaging(0.997) | TCGA-AG-4005-01 | Colorectum | rectum adenocarcinoma | Male | <65 | III/IV | Chemotherapy | folinic | CR | |
| ESRRA | SNV | Missense_Mutation | c.16G>A | p.Val6Met | p.V6M | P11474 | protein_coding | tolerated_low_confidence(0.1) | benign(0.012) | TCGA-EI-6507-01 | Colorectum | rectum adenocarcinoma | Male | <65 | I/II | Unknown | Unknown | SD | |
| ESRRA | SNV | Missense_Mutation | rs767507136 | c.826N>T | p.Arg276Cys | p.R276C | P11474 | protein_coding | deleterious(0) | probably_damaging(0.999) | TCGA-EI-6882-01 | Colorectum | rectum adenocarcinoma | Male | <65 | I/II | Unknown | Unknown | SD |
| ESRRA | SNV | Missense_Mutation | rs45585533 | c.518N>T | p.Pro173Leu | p.P173L | P11474 | protein_coding | tolerated(0.44) | benign(0.003) | TCGA-B5-A11E-01 | Endometrium | uterine corpus endometrioid carcinoma | Female | <65 | I/II | Unknown | Unknown | SD |
| ESRRA | SNV | Missense_Mutation | novel | c.972N>T | p.Glu324Asp | p.E324D | P11474 | protein_coding | deleterious(0.01) | probably_damaging(0.995) | TCGA-B5-A11E-01 | Endometrium | uterine corpus endometrioid carcinoma | Female | <65 | I/II | Unknown | Unknown | SD |
| ESRRA | SNV | Missense_Mutation | novel | c.47A>C | p.Glu16Ala | p.E16A | P11474 | protein_coding | deleterious_low_confidence(0) | possibly_damaging(0.625) | TCGA-BS-A0U8-01 | Endometrium | uterine corpus endometrioid carcinoma | Female | <65 | III/IV | Chemotherapy | doxorubicin | SD |
| Page: 1 2 3 |
Top |
Related drugs of malignant transformation related genes |
| Identification of chemicals and drugs interact with genes involved in malignant transfromation |
| (DGIdb 4.0) |
| Entrez ID | Symbol | Category | Interaction Types | Drug Claim Name | Drug Name | PMIDs |
| 2101 | ESRRA | NUCLEAR HORMONE RECEPTOR, DRUGGABLE GENOME | D-5519 | |||
| 2101 | ESRRA | NUCLEAR HORMONE RECEPTOR, DRUGGABLE GENOME | ESTRADIOL | ESTRADIOL | 23448346 | |
| 2101 | ESRRA | NUCLEAR HORMONE RECEPTOR, DRUGGABLE GENOME | antagonist | 135651333 | CHEMBL189753 | |
| 2101 | ESRRA | NUCLEAR HORMONE RECEPTOR, DRUGGABLE GENOME | Pregnenolone | PREGNENOLONE | ||
| 2101 | ESRRA | NUCLEAR HORMONE RECEPTOR, DRUGGABLE GENOME | Rimexolone | RIMEXOLONE | ||
| 2101 | ESRRA | NUCLEAR HORMONE RECEPTOR, DRUGGABLE GENOME | FULVESTRANT | FULVESTRANT | 23448346 | |
| 2101 | ESRRA | NUCLEAR HORMONE RECEPTOR, DRUGGABLE GENOME | agonist | 135650300 | GENISTEIN | |
| 2101 | ESRRA | NUCLEAR HORMONE RECEPTOR, DRUGGABLE GENOME | Dexamethasone palmitate | |||
| 2101 | ESRRA | NUCLEAR HORMONE RECEPTOR, DRUGGABLE GENOME | agonist | 135649823 | ||
| 2101 | ESRRA | NUCLEAR HORMONE RECEPTOR, DRUGGABLE GENOME | agonist | 135649858 | DAIDZEIN |
| Page: 1 2 |

Copyright 2023-Present -The University of Texas Health Science Center at Houston |