| Tissue | Expression Dynamics | Abbreviation |
| Cervix | 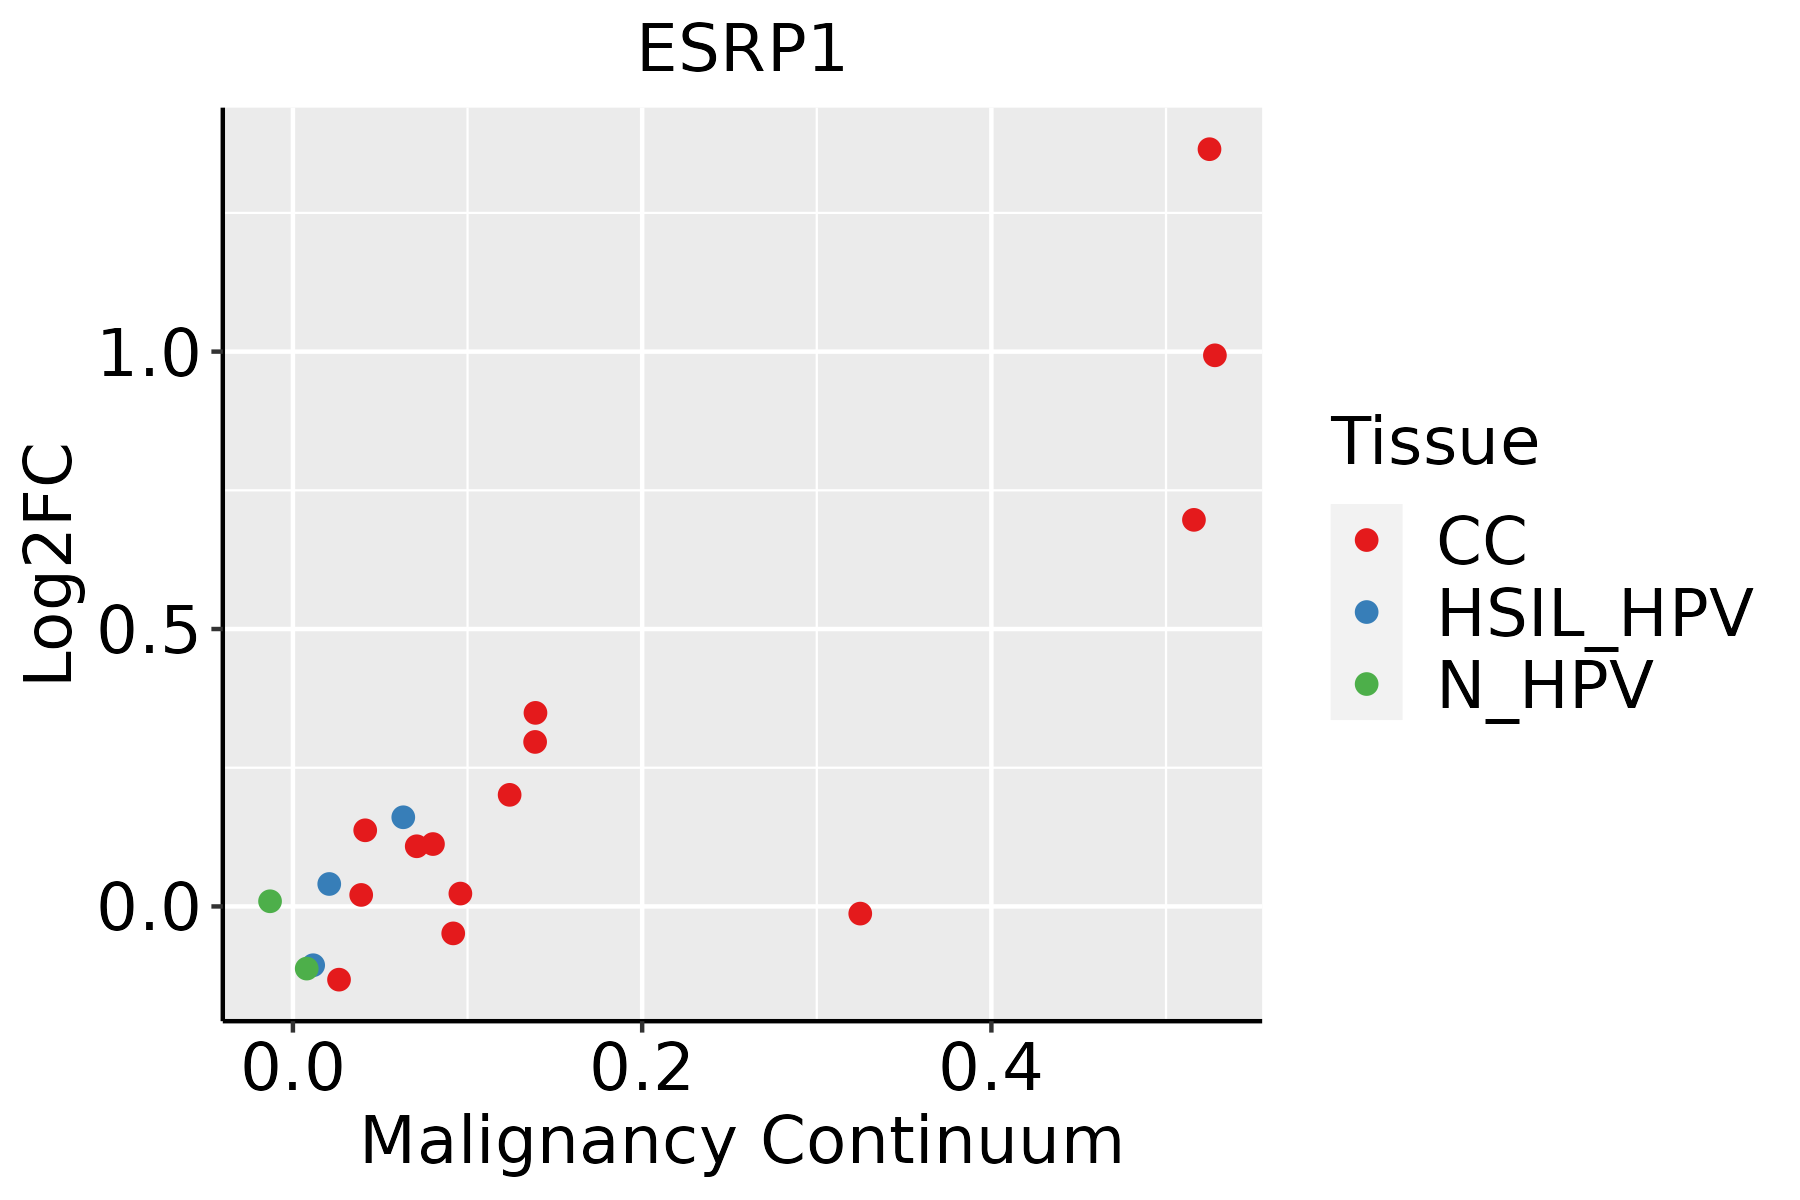 | CC: Cervix cancer |
| HSIL_HPV: HPV-infected high-grade squamous intraepithelial lesions |
| N_HPV: HPV-infected normal cervix |
| Colorectum (GSE201348) |  | FAP: Familial adenomatous polyposis |
| CRC: Colorectal cancer |
| Colorectum (HTA11) | 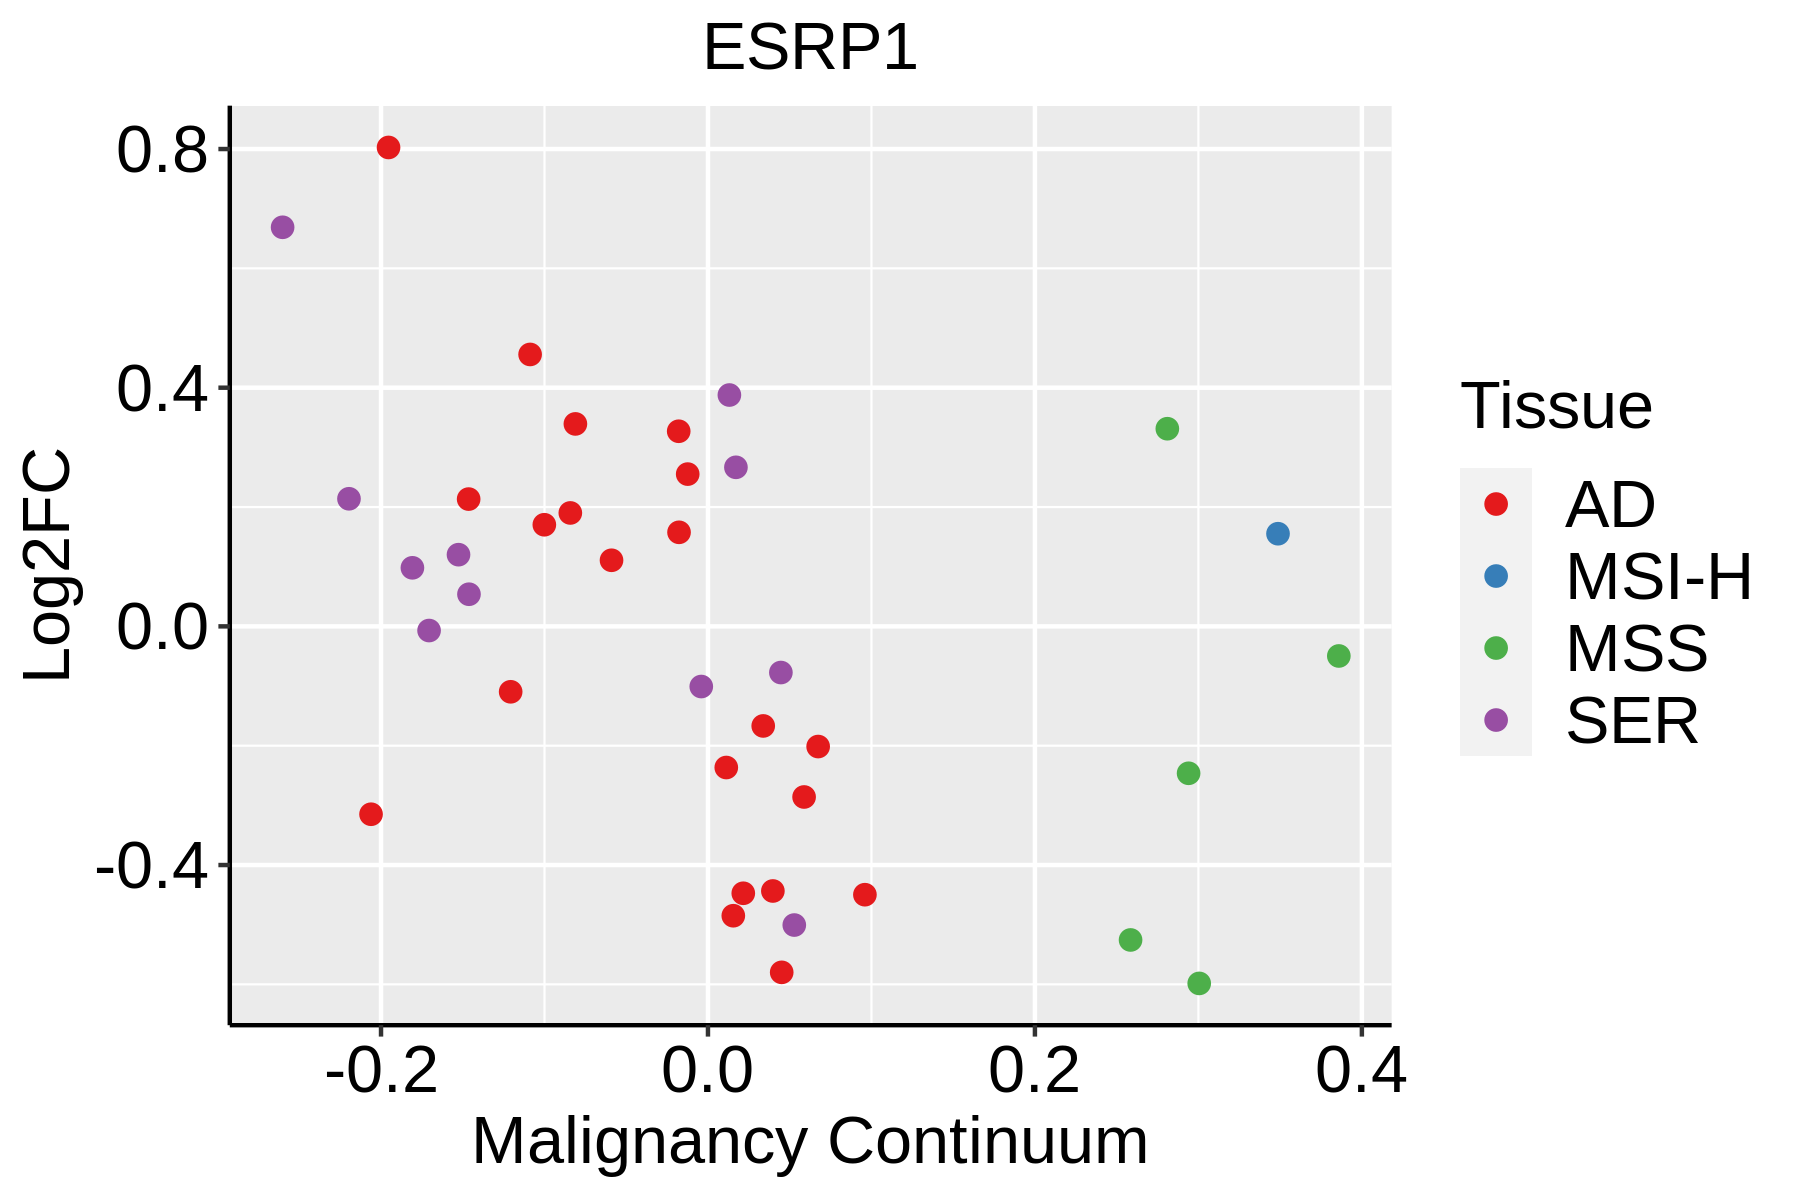 | AD: Adenomas |
| SER: Sessile serrated lesions |
| MSI-H: Microsatellite-high colorectal cancer |
| MSS: Microsatellite stable colorectal cancer |
| Esophagus | 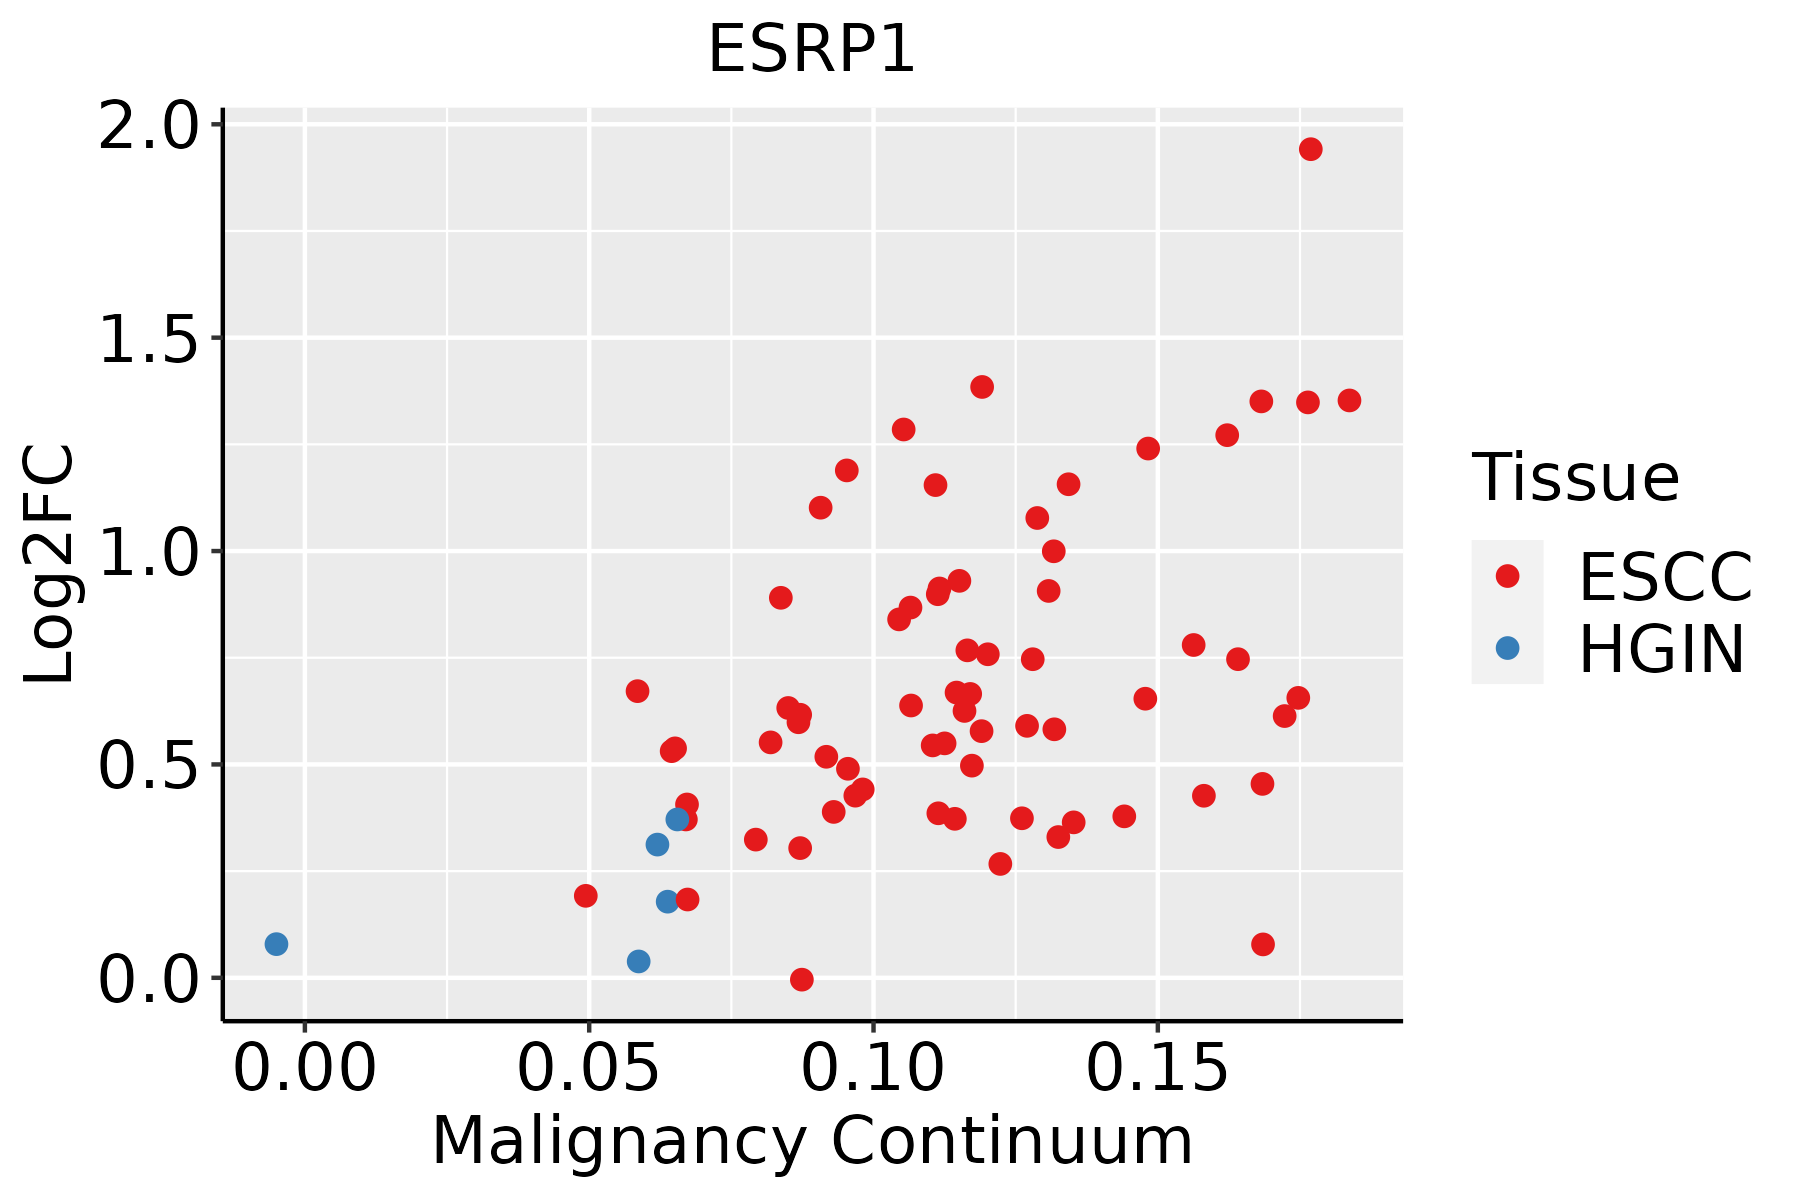 | ESCC: Esophageal squamous cell carcinoma |
| HGIN: High-grade intraepithelial neoplasias |
| LGIN: Low-grade intraepithelial neoplasias |
| Lung | 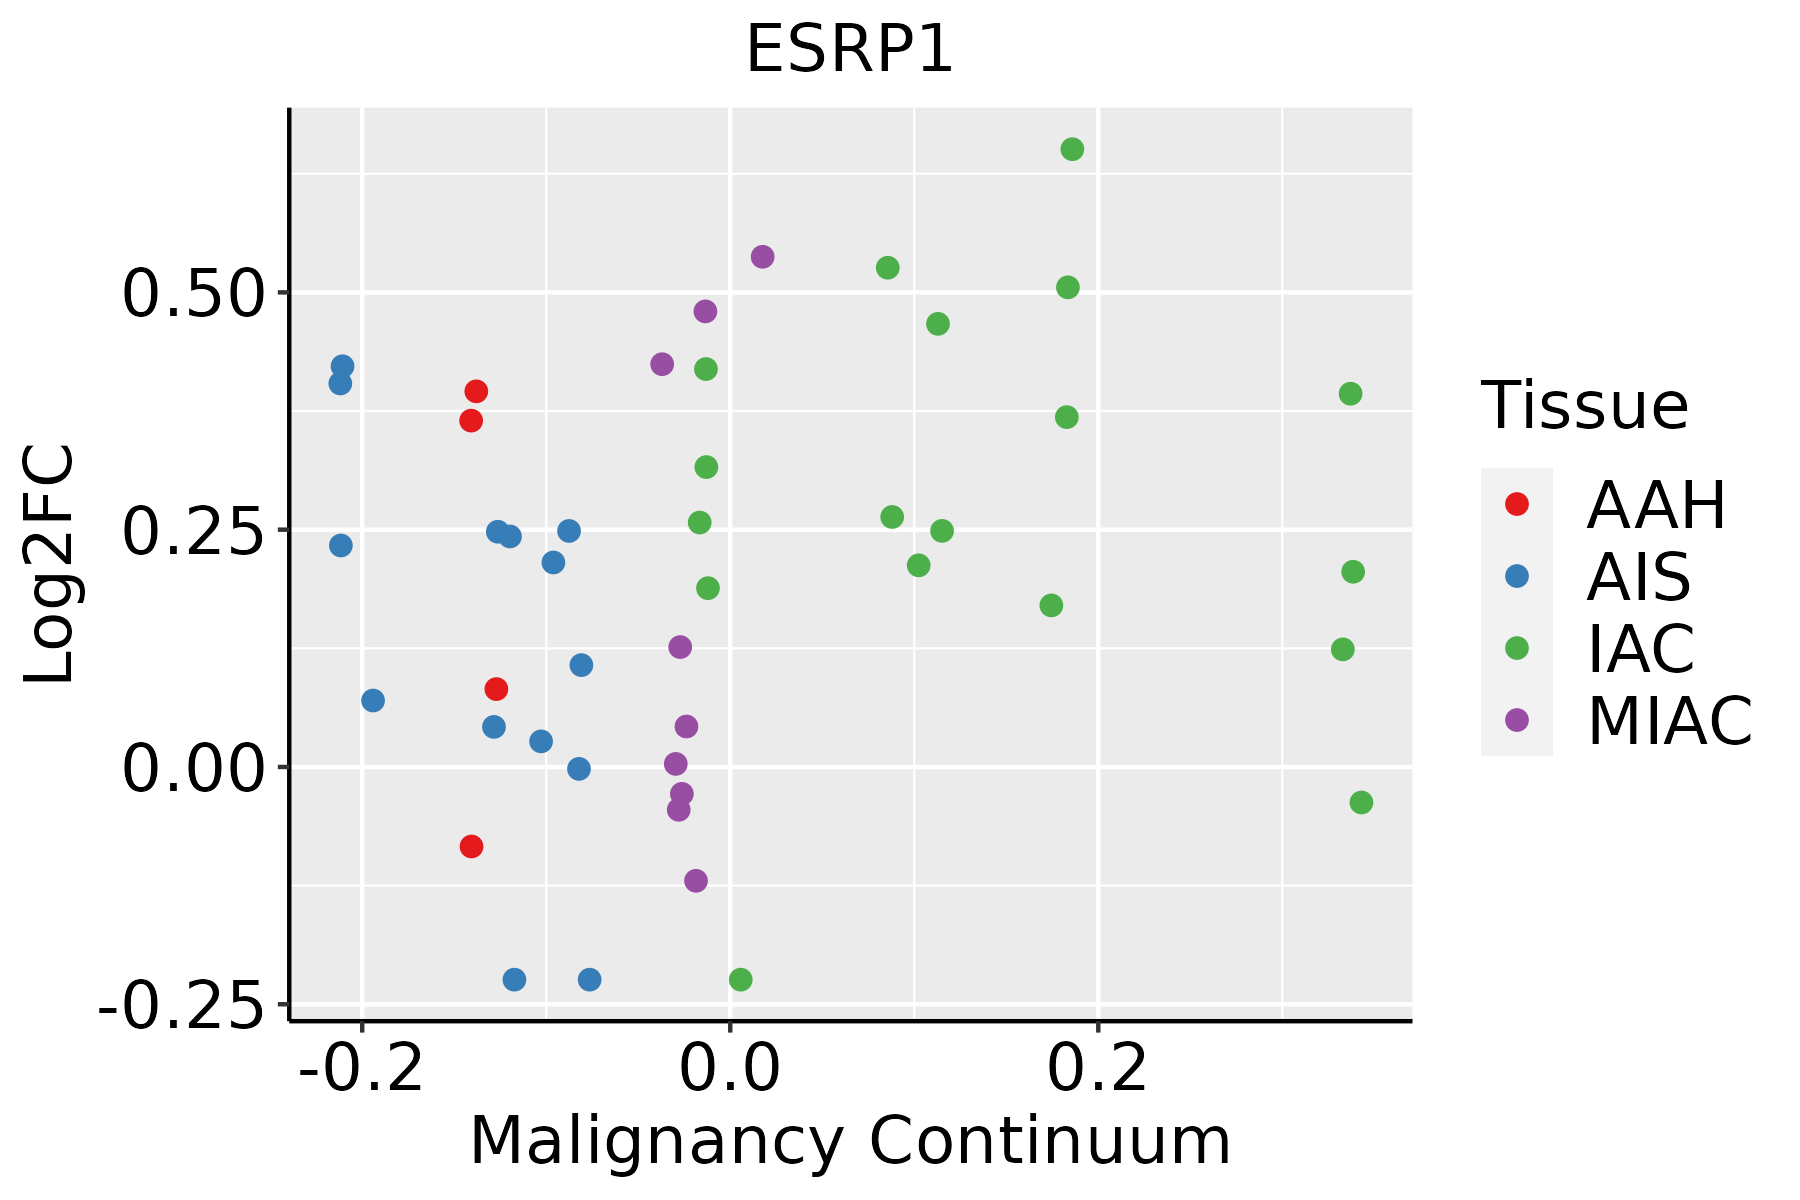 | AAH: Atypical adenomatous hyperplasia |
| AIS: Adenocarcinoma in situ |
| IAC: Invasive lung adenocarcinoma |
| MIA: Minimally invasive adenocarcinoma |
| Oral Cavity |  | EOLP: Erosive Oral lichen planus |
| LP: leukoplakia |
| NEOLP: Non-erosive oral lichen planus |
| OSCC: Oral squamous cell carcinoma |
| Prostate |  | BPH: Benign Prostatic Hyperplasia |
| Skin |  | AK: Actinic keratosis |
| cSCC: Cutaneous squamous cell carcinoma |
| SCCIS:squamous cell carcinoma in situ |
| Thyroid |  | ATC: Anaplastic thyroid cancer |
| HT: Hashimoto's thyroiditis |
| PTC: Papillary thyroid cancer |
| GO ID | Tissue | Disease Stage | Description | Gene Ratio | Bg Ratio | pvalue | p.adjust | Count |
| GO:00085446 | Cervix | CC | epidermis development | 83/2311 | 324/18723 | 3.91e-11 | 8.54e-09 | 83 |
| GO:00099137 | Cervix | CC | epidermal cell differentiation | 53/2311 | 202/18723 | 5.48e-08 | 3.25e-06 | 53 |
| GO:004348410 | Cervix | CC | regulation of RNA splicing | 42/2311 | 148/18723 | 1.25e-07 | 6.24e-06 | 42 |
| GO:00456822 | Cervix | CC | regulation of epidermis development | 22/2311 | 65/18723 | 5.56e-06 | 1.38e-04 | 22 |
| GO:00456042 | Cervix | CC | regulation of epidermal cell differentiation | 20/2311 | 58/18723 | 1.07e-05 | 2.33e-04 | 20 |
| GO:00308563 | Cervix | CC | regulation of epithelial cell differentiation | 36/2311 | 154/18723 | 1.02e-04 | 1.31e-03 | 36 |
| GO:000838010 | Cervix | CC | RNA splicing | 76/2311 | 434/18723 | 9.79e-04 | 8.19e-03 | 76 |
| GO:0008380 | Colorectum | AD | RNA splicing | 169/3918 | 434/18723 | 3.59e-18 | 2.04e-15 | 169 |
| GO:0043484 | Colorectum | AD | regulation of RNA splicing | 70/3918 | 148/18723 | 6.47e-13 | 1.16e-10 | 70 |
| GO:0035315 | Colorectum | AD | hair cell differentiation | 21/3918 | 47/18723 | 2.14e-04 | 2.82e-03 | 21 |
| GO:0042491 | Colorectum | AD | inner ear auditory receptor cell differentiation | 17/3918 | 38/18723 | 8.26e-04 | 8.13e-03 | 17 |
| GO:0042490 | Colorectum | AD | mechanoreceptor differentiation | 24/3918 | 67/18723 | 3.48e-03 | 2.52e-02 | 24 |
| GO:0009913 | Colorectum | AD | epidermal cell differentiation | 58/3918 | 202/18723 | 5.16e-03 | 3.42e-02 | 58 |
| GO:0008544 | Colorectum | AD | epidermis development | 87/3918 | 324/18723 | 5.99e-03 | 3.76e-02 | 87 |
| GO:00083801 | Colorectum | SER | RNA splicing | 123/2897 | 434/18723 | 3.84e-12 | 8.41e-10 | 123 |
| GO:00434841 | Colorectum | SER | regulation of RNA splicing | 49/2897 | 148/18723 | 7.02e-08 | 4.49e-06 | 49 |
| GO:00353151 | Colorectum | SER | hair cell differentiation | 15/2897 | 47/18723 | 3.68e-03 | 3.07e-02 | 15 |
| GO:00083802 | Colorectum | MSS | RNA splicing | 159/3467 | 434/18723 | 1.75e-19 | 1.22e-16 | 159 |
| GO:00434842 | Colorectum | MSS | regulation of RNA splicing | 66/3467 | 148/18723 | 2.44e-13 | 5.25e-11 | 66 |
| GO:00353152 | Colorectum | MSS | hair cell differentiation | 19/3467 | 47/18723 | 3.88e-04 | 4.86e-03 | 19 |
| Hugo Symbol | Variant Class | Variant Classification | dbSNP RS | HGVSc | HGVSp | HGVSp Short | SWISSPROT | BIOTYPE | SIFT | PolyPhen | Tumor Sample Barcode | Tissue | Histology | Sex | Age | Stage | Therapy Types | Drugs | Outcome |
| ESRP1 | SNV | Missense_Mutation | novel | c.1479N>G | p.Ile493Met | p.I493M | Q6NXG1 | protein_coding | deleterious(0) | probably_damaging(0.997) | TCGA-5L-AAT1-01 | Breast | breast invasive carcinoma | Female | <65 | III/IV | Hormone Therapy | letrozol | SD |
| ESRP1 | SNV | Missense_Mutation | novel | c.344G>T | p.Arg115Met | p.R115M | Q6NXG1 | protein_coding | deleterious(0) | probably_damaging(0.999) | TCGA-A2-A25A-01 | Breast | breast invasive carcinoma | Female | <65 | I/II | Unspecific | Cytoxan | SD |
| ESRP1 | SNV | Missense_Mutation | | c.451N>T | p.Pro151Ser | p.P151S | Q6NXG1 | protein_coding | tolerated(0.51) | benign(0.003) | TCGA-A8-A07W-01 | Breast | breast invasive carcinoma | Female | >=65 | III/IV | Hormone Therapy | exemestane | SD |
| ESRP1 | SNV | Missense_Mutation | | c.230C>G | p.Ser77Trp | p.S77W | Q6NXG1 | protein_coding | deleterious(0.02) | benign(0.404) | TCGA-A8-A09G-01 | Breast | breast invasive carcinoma | Female | >=65 | III/IV | Unknown | Unknown | SD |
| ESRP1 | SNV | Missense_Mutation | | c.148N>A | p.Glu50Lys | p.E50K | Q6NXG1 | protein_coding | tolerated(0.61) | benign(0) | TCGA-C8-A26Y-01 | Breast | breast invasive carcinoma | Female | >=65 | I/II | Unknown | Unknown | SD |
| ESRP1 | SNV | Missense_Mutation | | c.1496N>G | p.Asp499Gly | p.D499G | Q6NXG1 | protein_coding | deleterious(0.04) | possibly_damaging(0.882) | TCGA-E2-A1LH-01 | Breast | breast invasive carcinoma | Female | <65 | I/II | Chemotherapy | adriamycin | SD |
| ESRP1 | SNV | Missense_Mutation | novel | c.1651N>C | p.Cys551Arg | p.C551R | Q6NXG1 | protein_coding | tolerated(0.24) | benign(0.049) | TCGA-LL-A7SZ-01 | Breast | breast invasive carcinoma | Female | <65 | I/II | Chemotherapy | adriamycin | CR |
| ESRP1 | SNV | Missense_Mutation | novel | c.1777N>A | p.Ala593Thr | p.A593T | Q6NXG1 | protein_coding | tolerated(0.26) | benign(0.081) | TCGA-2W-A8YY-01 | Cervix | cervical & endocervical cancer | Female | <65 | I/II | Chemotherapy | cisplatin | CR |
| ESRP1 | SNV | Missense_Mutation | | c.1463N>T | p.Ser488Leu | p.S488L | Q6NXG1 | protein_coding | deleterious(0) | probably_damaging(1) | TCGA-IR-A3LL-01 | Cervix | cervical & endocervical cancer | Female | <65 | I/II | Chemotherapy | cisplatin | CR |
| ESRP1 | SNV | Missense_Mutation | | c.544N>C | p.Glu182Gln | p.E182Q | Q6NXG1 | protein_coding | tolerated(0.99) | benign(0.003) | TCGA-JW-A5VL-01 | Cervix | cervical & endocervical cancer | Female | <65 | I/II | Unknown | Unknown | SD |


