
|
|||||
|
 | |
| |
| |
| |
| |
| |
|
Gene: ESR2 |
Gene summary for ESR2 |
| Gene information | Species | Human | Gene symbol | ESR2 | Gene ID | 2100 |
| Gene name | estrogen receptor 2 | |
| Gene Alias | ER-BETA | |
| Cytomap | 14q23.2-q23.3 | |
| Gene Type | protein-coding | GO ID | GO:0000122 | UniProtAcc | F1D8N3 |
Top |
Malignant transformation analysis |
| Identification of the aberrant gene expression in precancerous and cancerous lesions by comparing the gene expression of stem-like cells in diseased tissues with normal stem cells |
| Entrez ID | Symbol | Replicates | Species | Organ | Tissue | Adj P-value | Log2FC | Malignancy |
| 2100 | ESR2 | AEH-subject1 | Human | Endometrium | AEH | 8.23e-05 | 1.22e-01 | -0.3059 |
| 2100 | ESR2 | EEC-subject1 | Human | Endometrium | EEC | 8.23e-05 | 1.48e-01 | -0.2682 |
| 2100 | ESR2 | EEC-subject3 | Human | Endometrium | EEC | 3.51e-03 | 1.43e-01 | -0.2525 |
| 2100 | ESR2 | EEC-subject4 | Human | Endometrium | EEC | 8.70e-09 | 2.52e-01 | -0.2571 |
| 2100 | ESR2 | EEC-subject5 | Human | Endometrium | EEC | 1.75e-04 | 1.24e-01 | -0.249 |
| Page: 1 |
| Tissue | Expression Dynamics | Abbreviation |
| Endometrium | 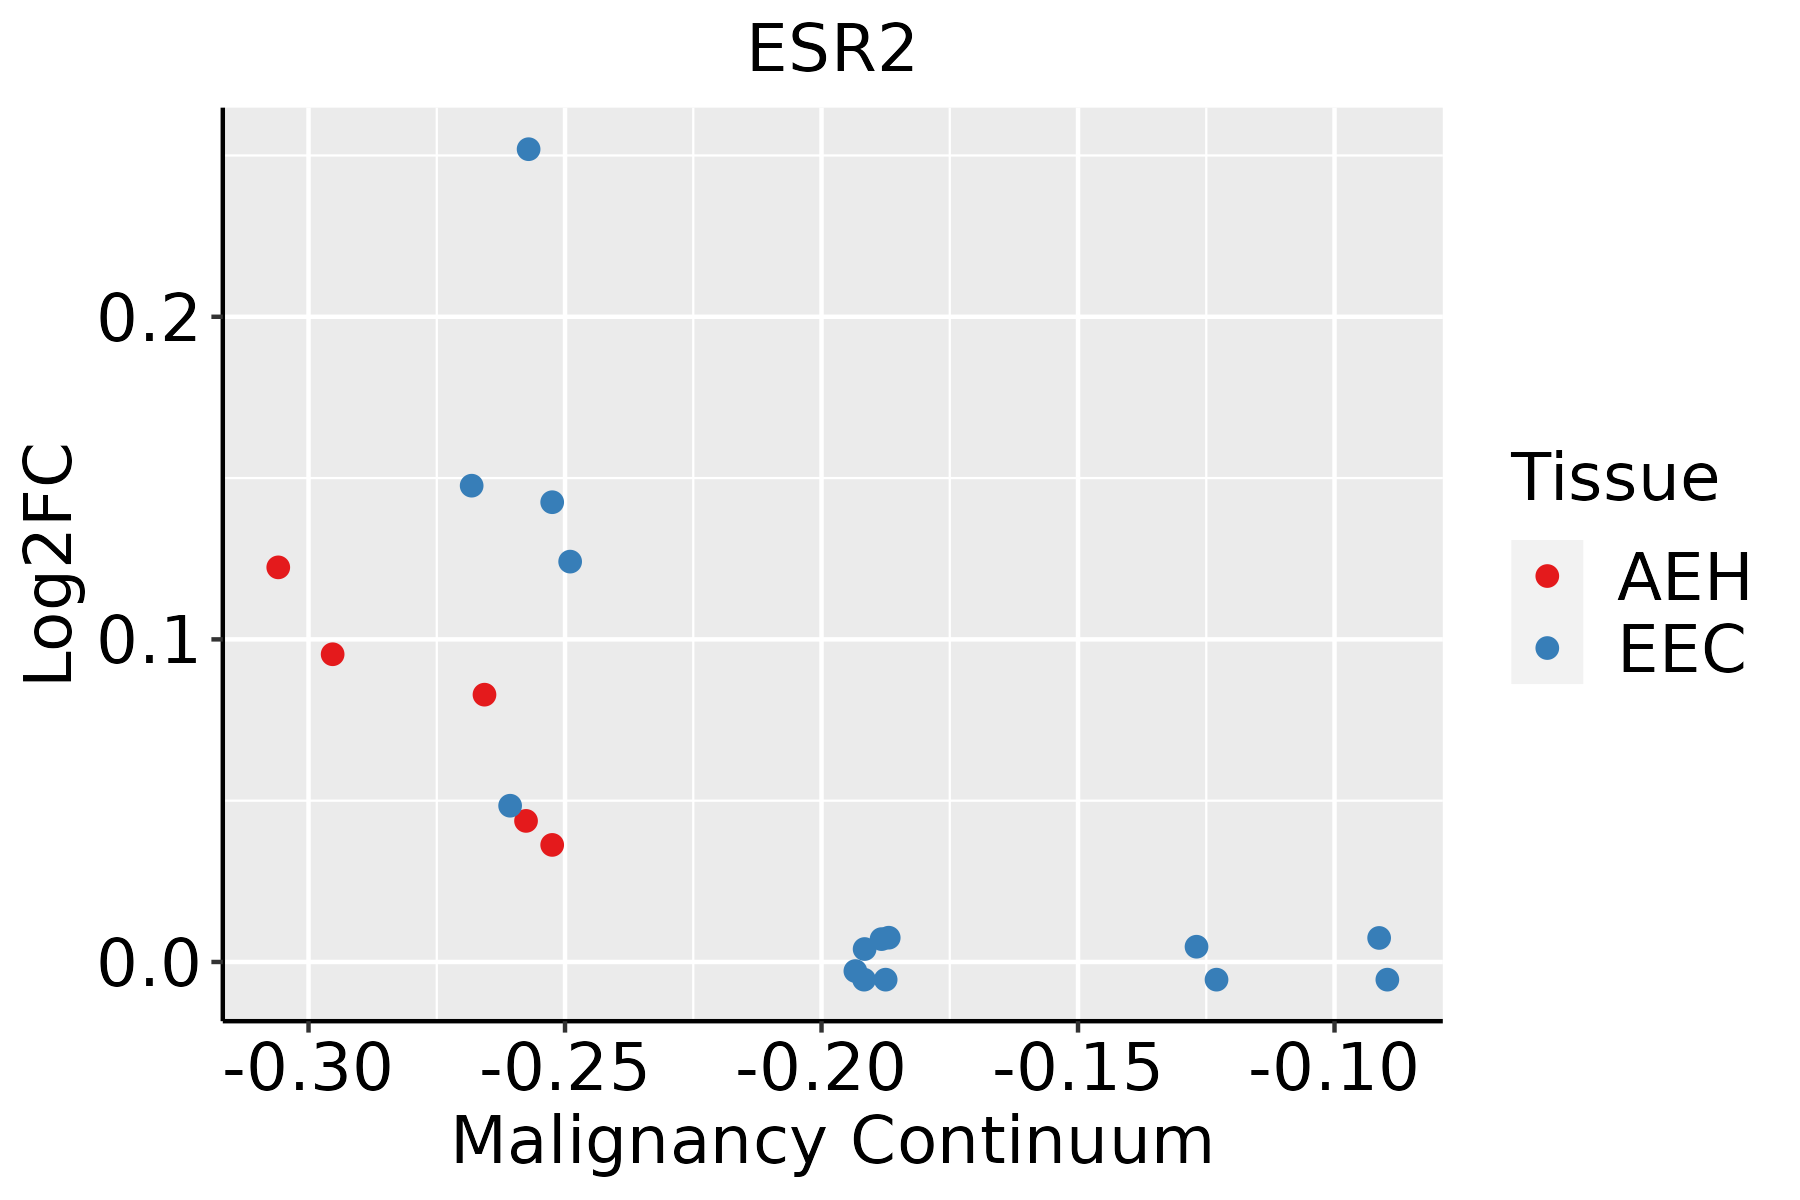 | AEH: Atypical endometrial hyperplasia |
| EEC: Endometrioid Cancer |
| ∗log2FC in expression of this searched gene in stem-like cells from each diseased tissue sample relative to stem-like cells in normal samples in each tissue plotted against the malignancy continuum. Samples are colored based on if they are from different disease stage. |
Top |
Malignant transformation related pathway analysis |
| Find out the enriched GO biological processes and KEGG pathways involved in transition from healthy to precancer to cancer |
| Tissue | Disease Stage | Enriched GO biological Processes |
| Colorectum | AD |  |
| Colorectum | SER |  |
| Colorectum | MSS |  |
| Colorectum | MSI-H |  |
| Colorectum | FAP |  |
| ∗Top 15 enriched GO BP terms are showed in the bar plot of each disease state in each tissue. Each row represents a significant GO biological process which is colored according to the -log10(p.adjust). |
| Page: 1 2 3 4 5 6 7 8 9 |
| GO ID | Tissue | Disease Stage | Description | Gene Ratio | Bg Ratio | pvalue | p.adjust | Count |
| GO:004854516 | Endometrium | AEH | response to steroid hormone | 76/2100 | 339/18723 | 2.15e-09 | 1.77e-07 | 76 |
| GO:003052210 | Endometrium | AEH | intracellular receptor signaling pathway | 60/2100 | 265/18723 | 7.16e-08 | 3.77e-06 | 60 |
| GO:00160499 | Endometrium | AEH | cell growth | 93/2100 | 482/18723 | 1.00e-07 | 4.99e-06 | 93 |
| GO:00323557 | Endometrium | AEH | response to estradiol | 34/2100 | 141/18723 | 1.13e-05 | 2.53e-04 | 34 |
| GO:007138310 | Endometrium | AEH | cellular response to steroid hormone stimulus | 44/2100 | 204/18723 | 1.41e-05 | 3.01e-04 | 44 |
| GO:00015589 | Endometrium | AEH | regulation of cell growth | 75/2100 | 414/18723 | 1.79e-05 | 3.65e-04 | 75 |
| GO:00305189 | Endometrium | AEH | intracellular steroid hormone receptor signaling pathway | 27/2100 | 116/18723 | 1.65e-04 | 2.15e-03 | 27 |
| GO:00459264 | Endometrium | AEH | negative regulation of growth | 47/2100 | 249/18723 | 2.36e-04 | 2.84e-03 | 47 |
| GO:00434019 | Endometrium | AEH | steroid hormone mediated signaling pathway | 29/2100 | 136/18723 | 4.71e-04 | 4.91e-03 | 29 |
| GO:00097558 | Endometrium | AEH | hormone-mediated signaling pathway | 37/2100 | 190/18723 | 5.64e-04 | 5.62e-03 | 37 |
| GO:00303082 | Endometrium | AEH | negative regulation of cell growth | 36/2100 | 188/18723 | 9.15e-04 | 8.37e-03 | 36 |
| GO:00510905 | Endometrium | AEH | regulation of DNA-binding transcription factor activity | 69/2100 | 440/18723 | 2.51e-03 | 1.87e-02 | 69 |
| GO:003052215 | Endometrium | EEC | intracellular receptor signaling pathway | 65/2168 | 265/18723 | 2.52e-09 | 1.96e-07 | 65 |
| GO:004854517 | Endometrium | EEC | response to steroid hormone | 77/2168 | 339/18723 | 3.80e-09 | 2.71e-07 | 77 |
| GO:001604915 | Endometrium | EEC | cell growth | 95/2168 | 482/18723 | 1.16e-07 | 5.54e-06 | 95 |
| GO:007138315 | Endometrium | EEC | cellular response to steroid hormone stimulus | 45/2168 | 204/18723 | 1.40e-05 | 2.79e-04 | 45 |
| GO:000155814 | Endometrium | EEC | regulation of cell growth | 77/2168 | 414/18723 | 1.64e-05 | 3.16e-04 | 77 |
| GO:003235514 | Endometrium | EEC | response to estradiol | 34/2168 | 141/18723 | 2.22e-05 | 3.98e-04 | 34 |
| GO:003051814 | Endometrium | EEC | intracellular steroid hormone receptor signaling pathway | 28/2168 | 116/18723 | 1.11e-04 | 1.52e-03 | 28 |
| GO:004592611 | Endometrium | EEC | negative regulation of growth | 48/2168 | 249/18723 | 2.58e-04 | 2.98e-03 | 48 |
| Page: 1 2 |
| Pathway ID | Tissue | Disease Stage | Description | Gene Ratio | Bg Ratio | pvalue | p.adjust | qvalue | Count |
| hsa0491525 | Endometrium | AEH | Estrogen signaling pathway | 35/1197 | 138/8465 | 3.10e-04 | 2.40e-03 | 1.75e-03 | 35 |
| hsa04915111 | Endometrium | AEH | Estrogen signaling pathway | 35/1197 | 138/8465 | 3.10e-04 | 2.40e-03 | 1.75e-03 | 35 |
| hsa0491526 | Endometrium | EEC | Estrogen signaling pathway | 34/1237 | 138/8465 | 1.19e-03 | 8.02e-03 | 5.98e-03 | 34 |
| hsa0491535 | Endometrium | EEC | Estrogen signaling pathway | 34/1237 | 138/8465 | 1.19e-03 | 8.02e-03 | 5.98e-03 | 34 |
| Page: 1 |
Top |
Cell-cell communication analysis |
| Identification of potential cell-cell interactions between two cell types and their ligand-receptor pairs for different disease states |
| Ligand | Receptor | LRpair | Pathway | Tissue | Disease Stage |
| Page: 1 |
Top |
Single-cell gene regulatory network inference analysis |
| Find out the significant the regulons (TFs) and the target genes of each regulon across cell types for different disease states |
| TF | Cell Type | Tissue | Disease Stage | Target Gene | RSS | Regulon Activity |
| ESR2 | IMGOB | Colorectum | FAP | SLC1A4,BTN2A2,HPCAL1, etc. | 2.16e-01 |  |
| ESR2 | GOB | Colorectum | FAP | SLC1A4,BTN2A2,HPCAL1, etc. | 1.05e-01 | |
| ESR2 | PLA | Colorectum | CRC | OGT,MSI2,NR5A2, etc. | 3.72e-01 |  |
| ESR2 | PLA | Colorectum | FAP | OGT,MSI2,NR5A2, etc. | 2.98e-01 | |
| ESR2 | PLA | Colorectum | Healthy | OGT,MSI2,NR5A2, etc. | 4.31e-01 |  |
| ESR2 | PLA | Colorectum | MSI-H | OGT,MSI2,NR5A2, etc. | 3.08e-01 |  |
| ESR2 | PLA | Colorectum | MSS | OGT,MSI2,NR5A2, etc. | 1.91e-01 |  |
| ESR2 | PVA | Endometrium | EEC | EPB41L3,AFF3,TMEM104, etc. | 2.52e-01 |  |
| ESR2 | PVA | Endometrium | Healthy | EPB41L3,AFF3,TMEM104, etc. | 2.82e-01 |  |
| ESR2 | MVA | Endometrium | Healthy | EPB41L3,AFF3,TMEM104, etc. | 1.93e-01 | |
| ∗The dot plots of a searched regulon are shown for all cell subpopulations in each disease state of each tissue based on the regulon specific score inferred using pySCENIC and by calculating the average expression. |
| Page: 1 2 |
Top |
Somatic mutation of malignant transformation related genes |
| Annotation of somatic variants for genes involved in malignant transformation |
| Hugo Symbol | Variant Class | Variant Classification | dbSNP RS | HGVSc | HGVSp | HGVSp Short | SWISSPROT | BIOTYPE | SIFT | PolyPhen | Tumor Sample Barcode | Tissue | Histology | Sex | Age | Stage | Therapy Types | Drugs | Outcome |
| ESR2 | SNV | Missense_Mutation | c.679N>T | p.Arg227Cys | p.R227C | Q92731 | protein_coding | deleterious(0.02) | probably_damaging(0.985) | TCGA-A8-A0A4-01 | Breast | breast invasive carcinoma | Female | >=65 | I/II | Hormone Therapy | tamoxiphen | CR | |
| ESR2 | SNV | Missense_Mutation | c.976N>A | p.Asp326Asn | p.D326N | Q92731 | protein_coding | deleterious(0.02) | possibly_damaging(0.466) | TCGA-AN-A046-01 | Breast | breast invasive carcinoma | Female | >=65 | I/II | Unknown | Unknown | SD | |
| ESR2 | SNV | Missense_Mutation | rs556956556 | c.631N>A | p.Glu211Lys | p.E211K | Q92731 | protein_coding | deleterious(0) | probably_damaging(0.993) | TCGA-AN-A046-01 | Breast | breast invasive carcinoma | Female | >=65 | I/II | Unknown | Unknown | SD |
| ESR2 | SNV | Missense_Mutation | c.439C>T | p.His147Tyr | p.H147Y | Q92731 | protein_coding | deleterious(0) | probably_damaging(0.931) | TCGA-D8-A1J8-01 | Breast | breast invasive carcinoma | Female | >=65 | I/II | Hormone Therapy | nolvadex | SD | |
| ESR2 | insertion | Nonsense_Mutation | novel | c.1451_1452insTTCCCTTGTTAGCAGAGGGCACATTTGAATGCAGC | p.Val485SerfsTer9 | p.V485Sfs*9 | Q92731 | protein_coding | TCGA-AN-A03X-01 | Breast | breast invasive carcinoma | Female | >=65 | I/II | Unknown | Unknown | SD | ||
| ESR2 | deletion | Frame_Shift_Del | novel | c.1016delN | p.Leu339Ter | p.L339* | Q92731 | protein_coding | TCGA-EW-A2FV-01 | Breast | breast invasive carcinoma | Female | <65 | III/IV | Chemotherapy | docetaxel | SD | ||
| ESR2 | SNV | Missense_Mutation | c.106T>C | p.Tyr36His | p.Y36H | Q92731 | protein_coding | deleterious(0) | probably_damaging(0.994) | TCGA-A6-6653-01 | Colorectum | colon adenocarcinoma | Male | >=65 | I/II | Unknown | Unknown | SD | |
| ESR2 | SNV | Missense_Mutation | c.659N>A | p.Arg220Gln | p.R220Q | Q92731 | protein_coding | deleterious(0.01) | benign(0.135) | TCGA-AA-3696-01 | Colorectum | colon adenocarcinoma | Female | >=65 | III/IV | Unknown | Unknown | PD | |
| ESR2 | SNV | Missense_Mutation | novel | c.552N>G | p.Ile184Met | p.I184M | Q92731 | protein_coding | tolerated(0.54) | possibly_damaging(0.74) | TCGA-AA-3984-01 | Colorectum | colon adenocarcinoma | Female | <65 | I/II | Unknown | Unknown | SD |
| ESR2 | SNV | Missense_Mutation | c.589C>T | p.Arg197Trp | p.R197W | Q92731 | protein_coding | deleterious(0) | probably_damaging(1) | TCGA-AD-6895-01 | Colorectum | colon adenocarcinoma | Male | >=65 | III/IV | Unknown | Unknown | SD |
| Page: 1 2 3 4 5 6 |
Top |
Related drugs of malignant transformation related genes |
| Identification of chemicals and drugs interact with genes involved in malignant transfromation |
| (DGIdb 4.0) |
| Entrez ID | Symbol | Category | Interaction Types | Drug Claim Name | Drug Name | PMIDs |
| 2100 | ESR2 | DRUGGABLE GENOME, TRANSCRIPTION FACTOR, NUCLEAR HORMONE RECEPTOR | VG-101 | 22114467 | ||
| 2100 | ESR2 | DRUGGABLE GENOME, TRANSCRIPTION FACTOR, NUCLEAR HORMONE RECEPTOR | ARZOXIFENE | ARZOXIFENE | ||
| 2100 | ESR2 | DRUGGABLE GENOME, TRANSCRIPTION FACTOR, NUCLEAR HORMONE RECEPTOR | OSPEMIFENE | OSPEMIFENE | ||
| 2100 | ESR2 | DRUGGABLE GENOME, TRANSCRIPTION FACTOR, NUCLEAR HORMONE RECEPTOR | antagonist | 178103927 | BAZEDOXIFENE | |
| 2100 | ESR2 | DRUGGABLE GENOME, TRANSCRIPTION FACTOR, NUCLEAR HORMONE RECEPTOR | agonist | 135651484 | ESTRONE | |
| 2100 | ESR2 | DRUGGABLE GENOME, TRANSCRIPTION FACTOR, NUCLEAR HORMONE RECEPTOR | ICI-164384 | CHEMBL1222035 | 20659801 | |
| 2100 | ESR2 | DRUGGABLE GENOME, TRANSCRIPTION FACTOR, NUCLEAR HORMONE RECEPTOR | goserelin | GOSERELIN | ||
| 2100 | ESR2 | DRUGGABLE GENOME, TRANSCRIPTION FACTOR, NUCLEAR HORMONE RECEPTOR | agonist | 178103650 | ETHINYL ESTRADIOL | |
| 2100 | ESR2 | DRUGGABLE GENOME, TRANSCRIPTION FACTOR, NUCLEAR HORMONE RECEPTOR | ERB-257 | |||
| 2100 | ESR2 | DRUGGABLE GENOME, TRANSCRIPTION FACTOR, NUCLEAR HORMONE RECEPTOR | antagonist | 135650105 |
| Page: 1 2 3 4 5 6 7 8 9 10 11 12 |

Copyright 2023-Present -The University of Texas Health Science Center at Houston |