Schematic overview of the cellular and molecular mechanisms involved in the cancer progression, including the proposed cellular and molecular mechanisms in cancer cells trajectory. AT1: alveolar type 1 cells; AT2: alveolar type 2 cells; AAH: atypical adenomatous hyperplasia; AIS: adenocarcinoma in situ; MIA: minimally invasive adenocarcinoma; IA: invasive adenocarcinoma; EMT: epithelial-mesenchymal transition

Home

Download

Statistics

Help

Contact

Center for Computational Systems Medicine
leaf

Gene summary

leaf

Malignant transformation analysis

leaf

Malignant transformation related pathway analysis

leaf

Cell-cell communication analysis

leaf

Single-cell gene regulatory network inference analysis

leaf

Somatic mutation of malignant transformation related genes

leaf

Related drugs of malignant transformation related genes

Gene: ESPN

Gene summary for ESPN

check button Gene summary.

Gene informationSpeciesHuman
Gene symbol

ESPN

Gene ID

83715

Gene nameespin
Gene AliasDFNB36
Cytomap1p36.31
Gene Typeprotein-coding
GO ID

GO:0003008

UniProtAcc

B1AK53


Top

Malignant transformation analysis

check button Identification of the aberrant gene expression in precancerous and cancerous lesions by comparing the gene expression of stem-like cells in diseased tissues with normal stem cells
check button Malignant transformation involving gene list.
Entrez IDSymbolReplicatesSpeciesOrganTissueAdj P-valueLog2FCMalignancy
83715ESPNLZE20THumanEsophagusESCC2.00e-093.25e-010.0662
83715ESPNLZE22THumanEsophagusESCC5.45e-085.91e-010.068
83715ESPNLZE24THumanEsophagusESCC2.42e-112.36e-010.0596
83715ESPNP1T-EHumanEsophagusESCC4.47e-052.97e-010.0875
83715ESPNP2T-EHumanEsophagusESCC4.01e-132.24e-010.1177
83715ESPNP4T-EHumanEsophagusESCC4.25e-255.83e-010.1323
83715ESPNP5T-EHumanEsophagusESCC5.59e-031.36e-010.1327
83715ESPNP8T-EHumanEsophagusESCC8.87e-326.10e-010.0889
83715ESPNP9T-EHumanEsophagusESCC1.82e-077.74e-020.1131
83715ESPNP10T-EHumanEsophagusESCC4.00e-112.30e-010.116
83715ESPNP11T-EHumanEsophagusESCC1.92e-031.76e-010.1426
83715ESPNP12T-EHumanEsophagusESCC4.91e-276.17e-010.1122
83715ESPNP15T-EHumanEsophagusESCC2.19e-264.73e-010.1149
83715ESPNP17T-EHumanEsophagusESCC2.09e-042.53e-010.1278
83715ESPNP20T-EHumanEsophagusESCC6.56e-173.79e-010.1124
83715ESPNP21T-EHumanEsophagusESCC3.82e-051.57e-010.1617
83715ESPNP23T-EHumanEsophagusESCC6.32e-142.80e-010.108
83715ESPNP24T-EHumanEsophagusESCC6.68e-092.35e-010.1287
83715ESPNP26T-EHumanEsophagusESCC8.23e-345.77e-010.1276
83715ESPNP27T-EHumanEsophagusESCC3.04e-234.42e-010.1055
Page: 1 2 3 4 

check button Transcriptomic changes along malignancy continuum.
TissueExpression DynamicsAbbreviation
EsophagusThe image shows the transcriptomic changes along malignancy continuum.log2FC in expression of this searched gene in stem-like cells from each diseased tissue sample relative to stem-like cells in normal samples in each tissue plotted against the malignancy continuum. Samples are colored based on if they are from different disease stage.
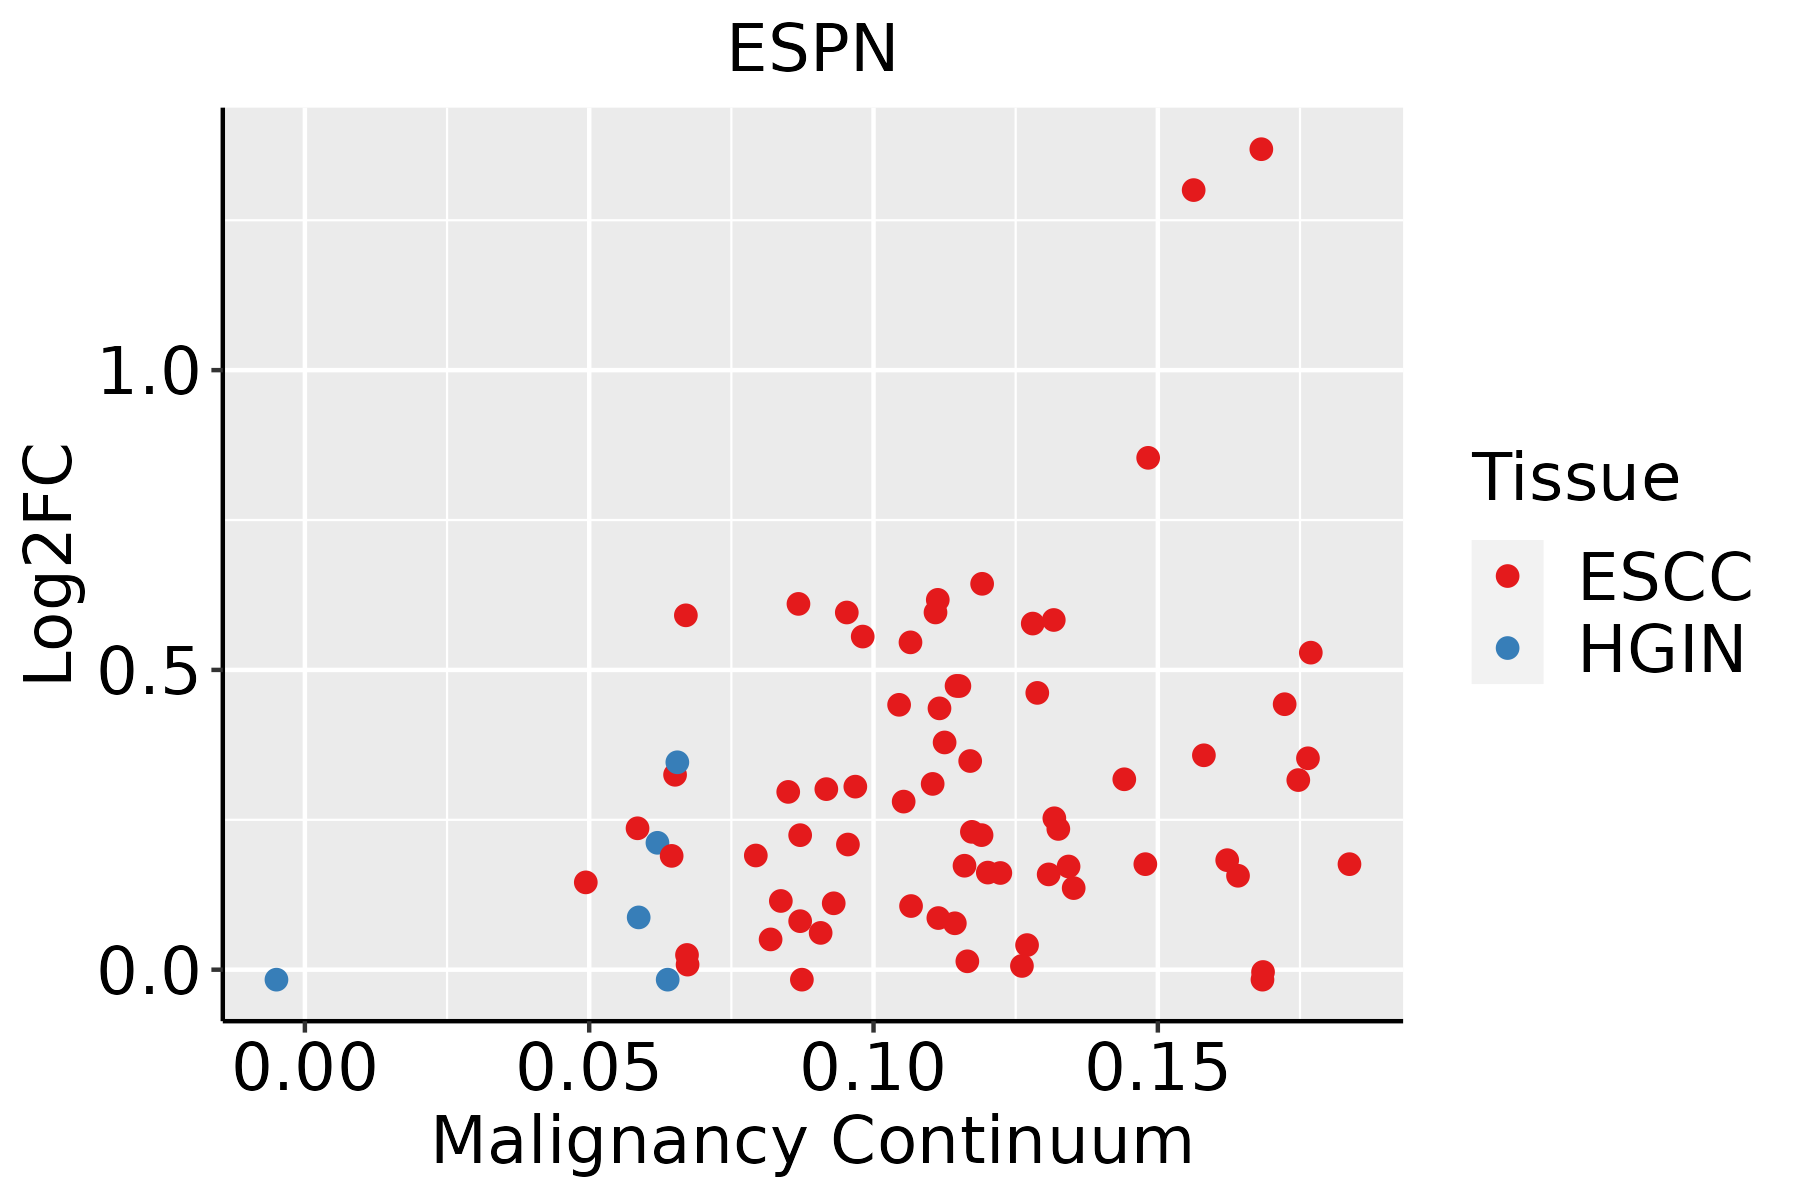
ESCC: Esophageal squamous cell carcinoma
HGIN: High-grade intraepithelial neoplasias
LGIN: Low-grade intraepithelial neoplasias
GCThe image shows the transcriptomic changes along malignancy continuum.log2FC in expression of this searched gene in stem-like cells from each diseased tissue sample relative to stem-like cells in normal samples in each tissue plotted against the malignancy continuum. Samples are colored based on if they are from different disease stage.
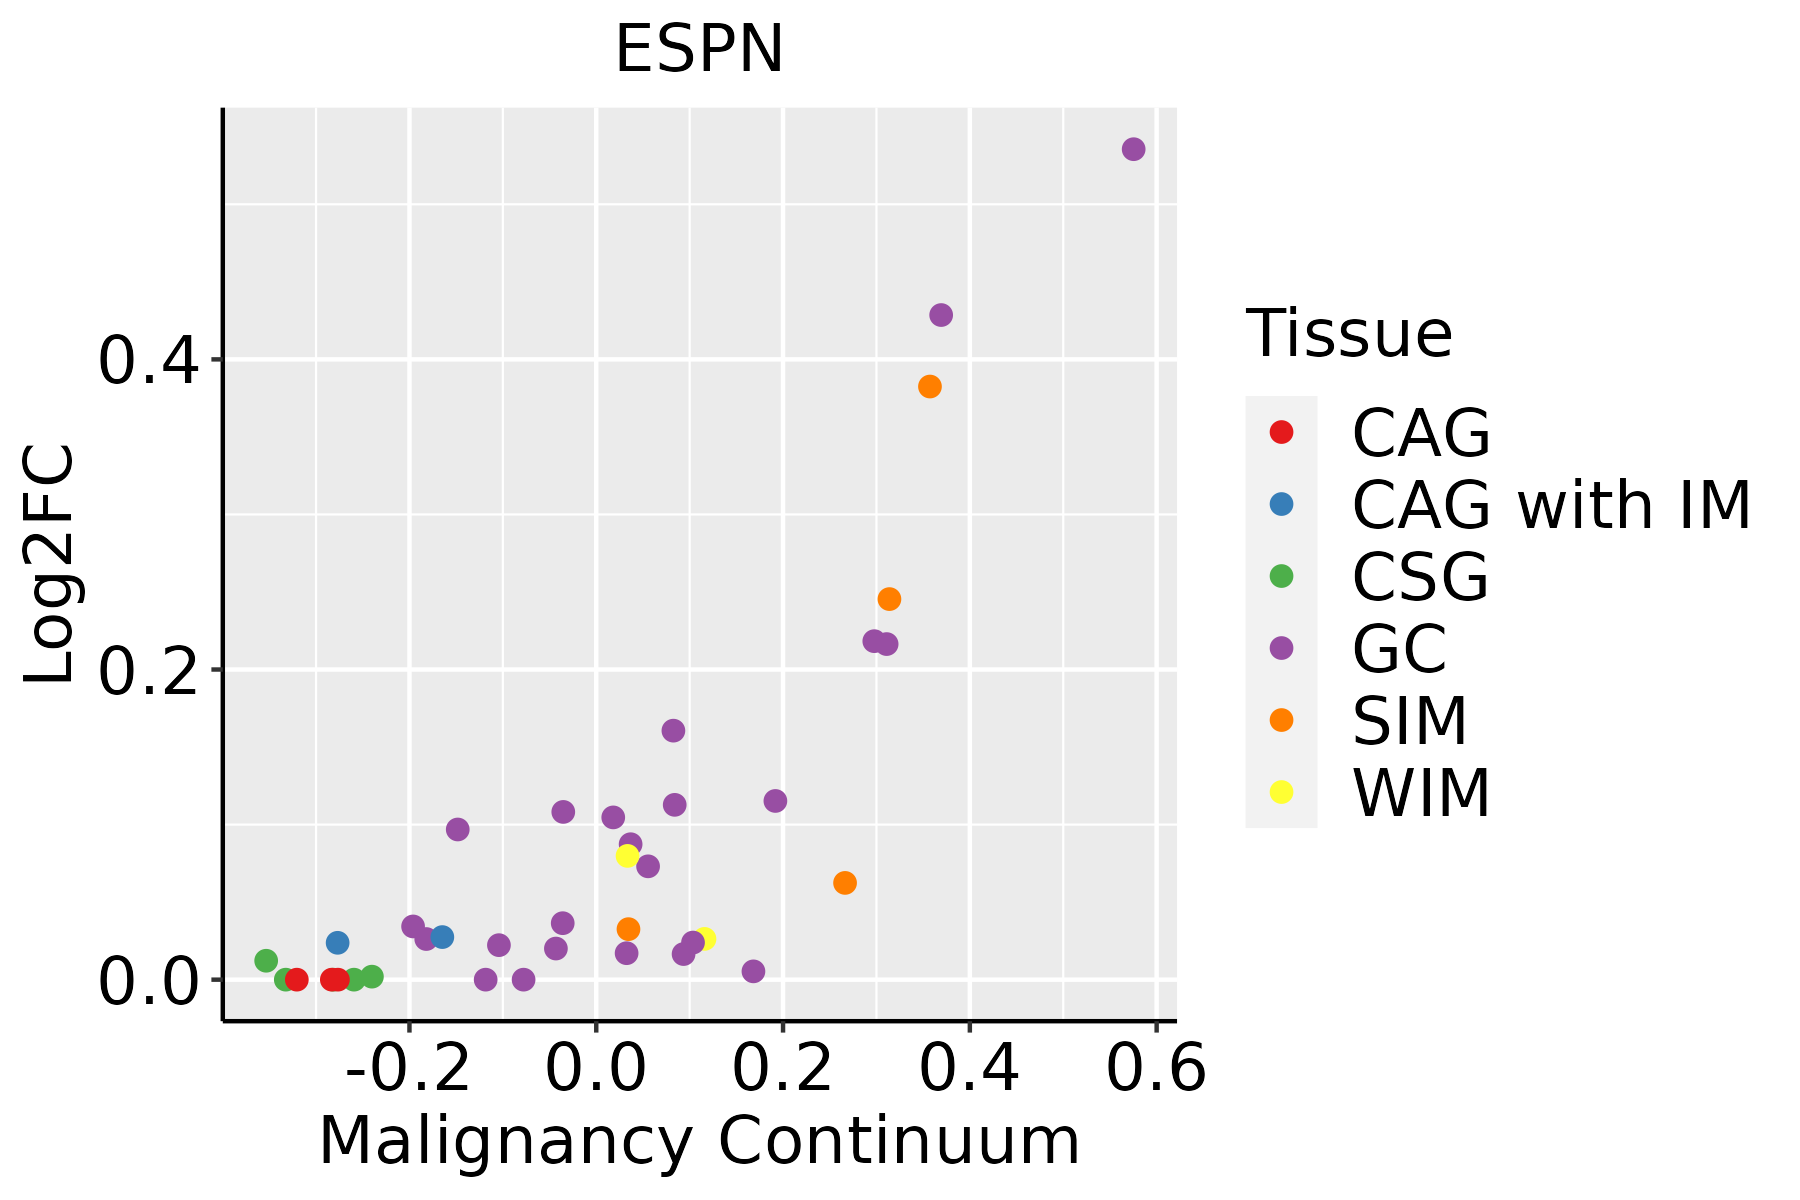
CAG: Chronic atrophic gastritis
CAG with IM: Chronic atrophic gastritis with intestinal metaplasia
CSG: Chronic superficial gastritis
GC: Gastric cancer
SIM: Severe intestinal metaplasia
WIM: Wild intestinal metaplasia
LiverThe image shows the transcriptomic changes along malignancy continuum.log2FC in expression of this searched gene in stem-like cells from each diseased tissue sample relative to stem-like cells in normal samples in each tissue plotted against the malignancy continuum. Samples are colored based on if they are from different disease stage.
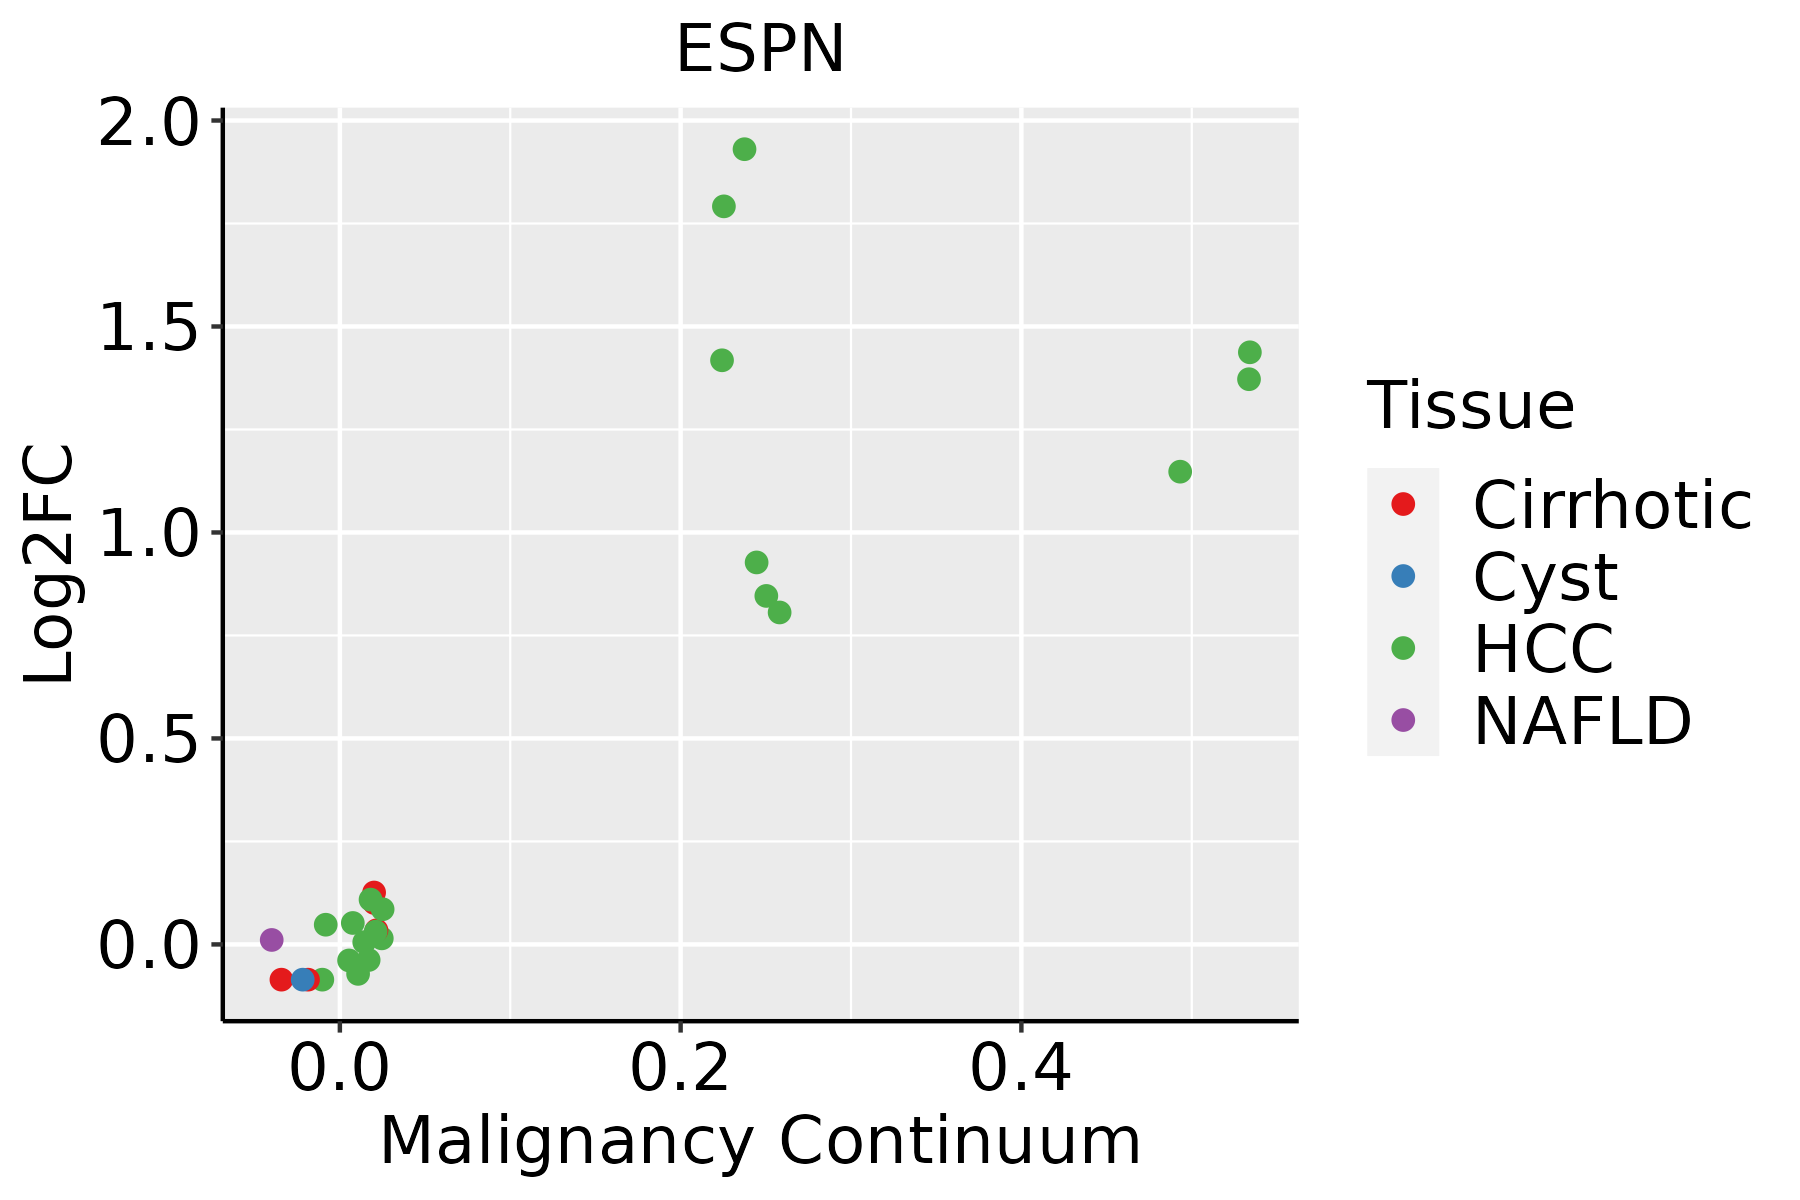
HCC: Hepatocellular carcinoma
NAFLD: Non-alcoholic fatty liver disease
Oral CavityThe image shows the transcriptomic changes along malignancy continuum.log2FC in expression of this searched gene in stem-like cells from each diseased tissue sample relative to stem-like cells in normal samples in each tissue plotted against the malignancy continuum. Samples are colored based on if they are from different disease stage.
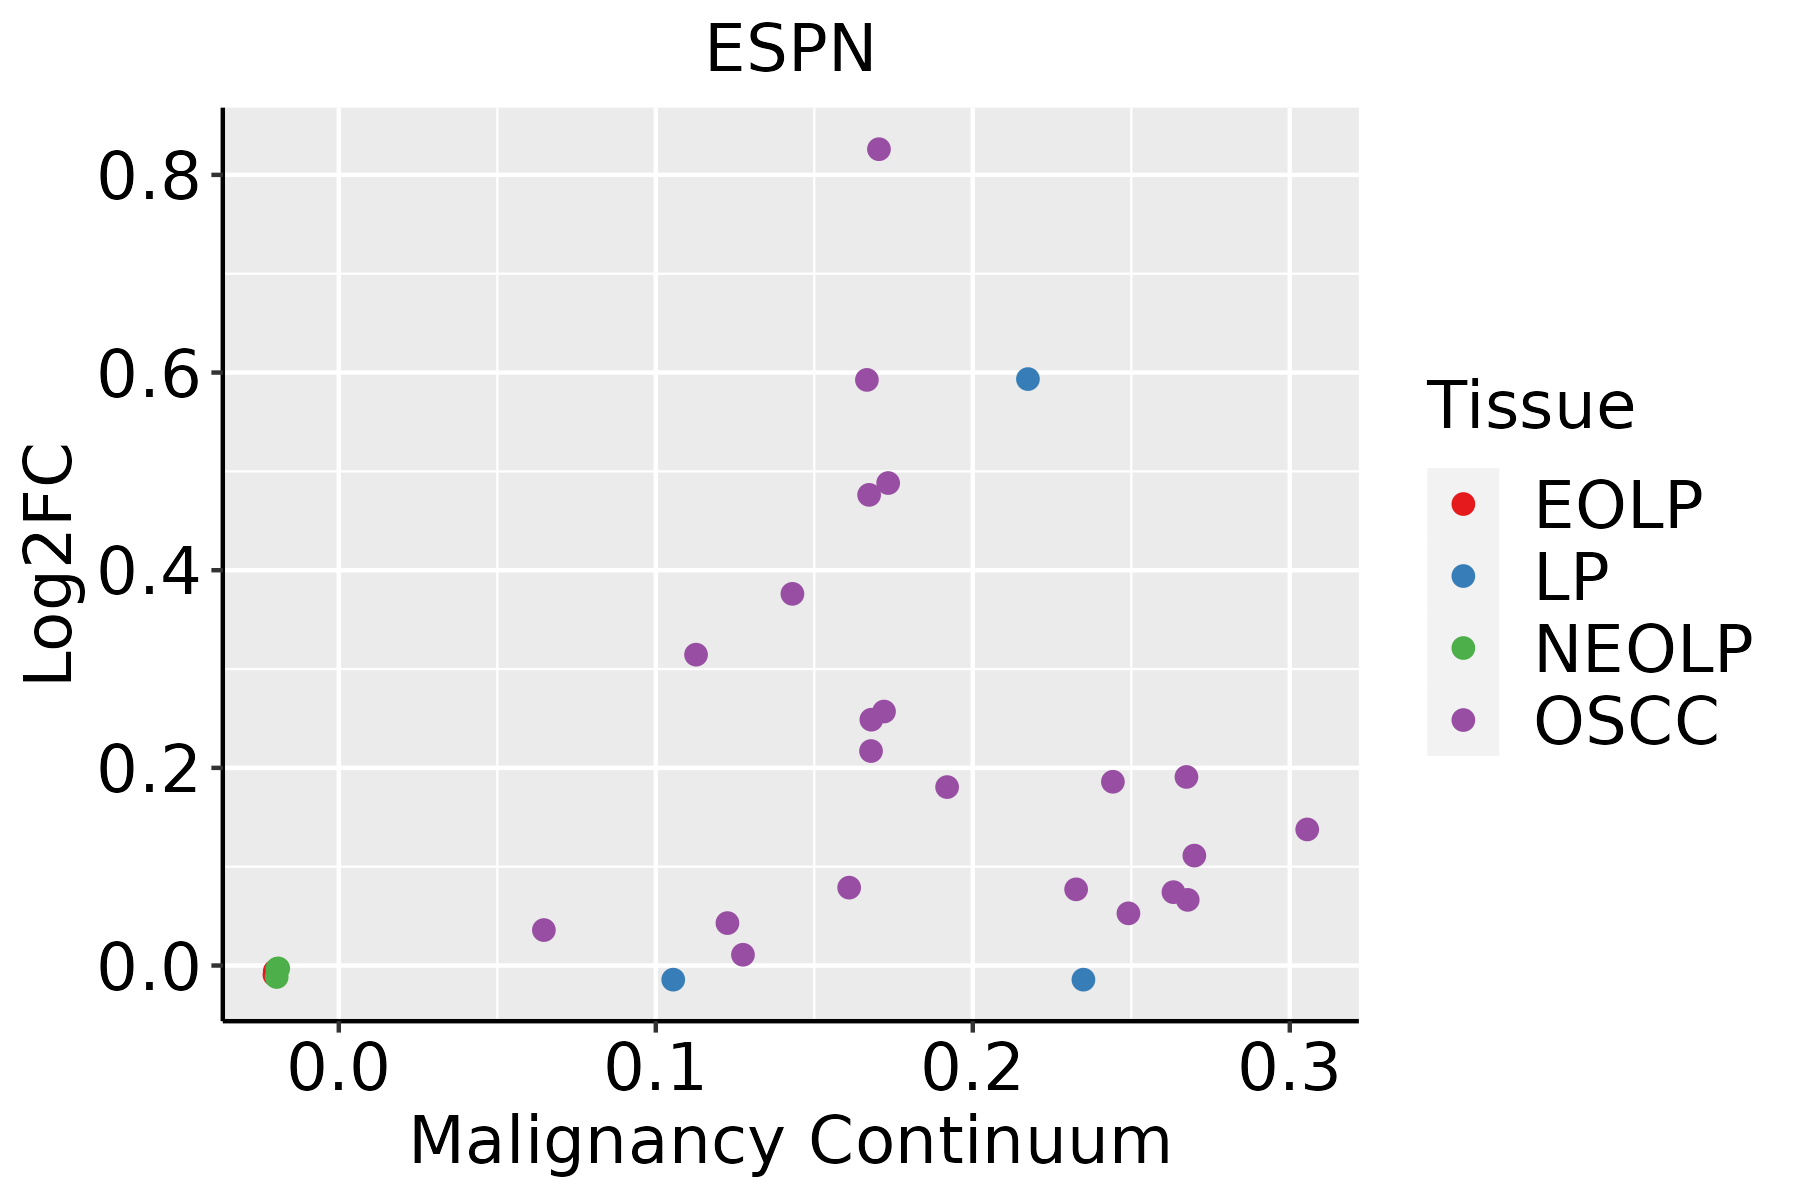
EOLP: Erosive Oral lichen planus
LP: leukoplakia
NEOLP: Non-erosive oral lichen planus
OSCC: Oral squamous cell carcinoma
∗log2FC in expression of this searched gene in stem-like cells from each diseased tissue sample relative to stem-like cells in normal samples in each tissue plotted against the malignancy continuum. Samples are colored based on if they are from different disease stage.

Top

Malignant transformation related pathway analysis

check buttonFind out the enriched GO biological processes and KEGG pathways involved in transition from healthy to precancer to cancer
check button Figure of enriched GO biological processes.
TissueDisease StageEnriched GO biological Processes
ColorectumADGO analysis - Figure of enriched GO biological processes: Top 15 enriched GO BP terms are showed in the bar plot of each disease state in each tissue. Each row represents a significant GO biological process which is colored according to the -log10(p.adjust).
ColorectumSERGO analysis - Figure of enriched GO biological processes: Top 15 enriched GO BP terms are showed in the bar plot of each disease state in each tissue. Each row represents a significant GO biological process which is colored according to the -log10(p.adjust).
ColorectumMSSGO analysis - Figure of enriched GO biological processes: Top 15 enriched GO BP terms are showed in the bar plot of each disease state in each tissue. Each row represents a significant GO biological process which is colored according to the -log10(p.adjust).
ColorectumMSI-HGO analysis - Figure of enriched GO biological processes: Top 15 enriched GO BP terms are showed in the bar plot of each disease state in each tissue. Each row represents a significant GO biological process which is colored according to the -log10(p.adjust).
ColorectumFAPGO analysis - Figure of enriched GO biological processes: Top 15 enriched GO BP terms are showed in the bar plot of each disease state in each tissue. Each row represents a significant GO biological process which is colored according to the -log10(p.adjust).
∗Top 15 enriched GO BP terms are showed in the bar plot of each disease state in each tissue. Each row represents a significant GO biological process which is colored according to the -log10(p.adjust).
Page: 1 2 3 4 5 6 7 8 9 

check button Enriched GO biological processes.
GO IDTissueDisease StageDescriptionGene RatioBg Ratiopvaluep.adjustCount
GO:000701527EsophagusESCCactin filament organization259/8552442/187232.37e-084.50e-07259
GO:005101727EsophagusESCCactin filament bundle assembly100/8552157/187233.87e-064.17e-05100
GO:006157227EsophagusESCCactin filament bundle organization101/8552161/187239.22e-068.82e-05101
GO:00300339EsophagusESCCmicrovillus assembly13/855216/187234.05e-031.62e-0213
GO:000701512LiverCirrhoticactin filament organization171/4634442/187233.93e-112.30e-09171
GO:005101712LiverCirrhoticactin filament bundle assembly69/4634157/187231.06e-073.05e-0669
GO:006157212LiverCirrhoticactin filament bundle organization70/4634161/187231.44e-073.87e-0670
GO:000701522LiverHCCactin filament organization252/7958442/187233.83e-101.25e-08252
GO:005101722LiverHCCactin filament bundle assembly96/7958157/187231.81e-062.52e-0596
GO:006157222LiverHCCactin filament bundle organization97/7958161/187234.04e-065.22e-0597
GO:00325286LiverHCCmicrovillus organization18/795824/187231.27e-036.92e-0318
GO:000701520Oral cavityOSCCactin filament organization230/7305442/187231.37e-082.77e-07230
GO:005101720Oral cavityOSCCactin filament bundle assembly86/7305157/187234.28e-053.70e-0486
GO:006157220Oral cavityOSCCactin filament bundle organization87/7305161/187237.49e-055.84e-0487
GO:0007015110Oral cavityLPactin filament organization143/4623442/187231.44e-041.65e-03143
GO:0051017110Oral cavityLPactin filament bundle assembly53/4623157/187236.54e-033.83e-0253
GO:00070156StomachGCactin filament organization67/1159442/187237.96e-122.20e-0967
GO:00325285StomachGCmicrovillus organization13/115924/187232.41e-103.75e-0813
GO:00615726StomachGCactin filament bundle organization30/1159161/187235.07e-083.40e-0630
GO:00510176StomachGCactin filament bundle assembly29/1159157/187231.03e-076.28e-0629
Page: 1 2 

check button Enriched KEGG pathways.
Pathway IDTissueDisease StageDescriptionGene RatioBg Ratiopvaluep.adjustqvalueCount
Page: 1 

Top

Cell-cell communication analysis

check buttonIdentification of potential cell-cell interactions between two cell types and their ligand-receptor pairs for different disease states
LigandReceptorLRpairPathwayTissueDisease Stage
Page: 1 

Top

Single-cell gene regulatory network inference analysis

check buttonFind out the significant the regulons (TFs) and the target genes of each regulon across cell types for different disease states
TFCell TypeTissueDisease StageTarget GeneRSSRegulon Activity
∗The dot plots of a searched regulon are shown for all cell subpopulations in each disease state of each tissue based on the regulon specific score inferred using pySCENIC and by calculating the average expression.
Page: 1 

Top

Somatic mutation of malignant transformation related genes

check buttonAnnotation of somatic variants for genes involved in malignant transformation
Hugo SymbolVariant ClassVariant ClassificationdbSNP RSHGVScHGVSpHGVSp ShortSWISSPROTBIOTYPESIFTPolyPhenTumor Sample BarcodeTissueHistologySexAgeStageTherapy TypesDrugsOutcome
ESPNSNVMissense_Mutationc.1129N>Ap.Leu377Ilep.L377IB1AK53protein_codingdeleterious(0)possibly_damaging(0.459)TCGA-AO-A128-01Breastbreast invasive carcinomaFemale<65I/IIChemotherapydoxorubicinSD
ESPNSNVMissense_Mutationrs751233233c.352N>Ap.Glu118Lysp.E118KB1AK53protein_codingtolerated(0.1)benign(0.066)TCGA-BH-A0H5-01Breastbreast invasive carcinomaFemale<65I/IIChemotherapycytoxanCR
ESPNSNVMissense_Mutationc.1159N>Ap.His387Asnp.H387NB1AK53protein_codingdeleterious(0.01)benign(0.367)TCGA-BH-A0HP-01Breastbreast invasive carcinomaFemale>=65III/IVChemotherapydoxorubicinSD
ESPNSNVMissense_Mutationc.1980N>Tp.Lys660Asnp.K660NB1AK53protein_codingdeleterious(0.02)probably_damaging(1)TCGA-BH-A201-01Breastbreast invasive carcinomaFemale<65I/IIUnknownUnknownSD
ESPNSNVMissense_Mutationnovelc.1208G>Cp.Arg403Thrp.R403TB1AK53protein_codingtolerated(0.29)benign(0)TCGA-PE-A5DE-01Breastbreast invasive carcinomaFemale<65I/IIChemotherapytaxotereCR
ESPNSNVMissense_Mutationnovelc.1939N>Ap.Ser647Thrp.S647TB1AK53protein_codingtolerated(0.06)possibly_damaging(0.771)TCGA-S3-AA10-01Breastbreast invasive carcinomaFemale>=65I/IIChemotherapycytoxanCR
ESPNSNVMissense_Mutationrs762623964c.1004N>Ap.Arg335Hisp.R335HB1AK53protein_codingdeleterious(0.02)probably_damaging(0.939)TCGA-C5-A1MH-01Cervixcervical & endocervical cancerFemale>=65III/IVChemotherapycisplatinPD
ESPNSNVMissense_Mutationc.2295G>Cp.Lys765Asnp.K765NB1AK53protein_codingdeleterious(0)probably_damaging(0.987)TCGA-EK-A2PG-01Cervixcervical & endocervical cancerFemale>=65I/IIUnknownUnknownSD
ESPNSNVMissense_Mutationnovelc.592N>Cp.Asp198Hisp.D198HB1AK53protein_codingdeleterious(0.01)possibly_damaging(0.837)TCGA-ZJ-AAXA-01Cervixcervical & endocervical cancerFemale<65I/IIUnknownUnknownSD
ESPNSNVMissense_Mutationc.1400N>Tp.Ala467Valp.A467VB1AK53protein_codingdeleterious_low_confidence(0)benign(0.157)TCGA-AZ-5407-01Colorectumcolon adenocarcinomaFemale<65I/IIUnknownUnknownSD
Page: 1 2 3 4 5 

Top

Related drugs of malignant transformation related genes

check buttonIdentification of chemicals and drugs interact with genes involved in malignant transfromation
(DGIdb 4.0)
Entrez IDSymbolCategoryInteraction TypesDrug Claim NameDrug NamePMIDs
Page: 1