
|
|||||
|
 | |
| |
| |
| |
| |
| |
|
Gene: ESCO1 |
Gene summary for ESCO1 |
| Gene information | Species | Human | Gene symbol | ESCO1 | Gene ID | 114799 |
| Gene name | establishment of sister chromatid cohesion N-acetyltransferase 1 | |
| Gene Alias | A930014I12Rik | |
| Cytomap | 18q11.2 | |
| Gene Type | protein-coding | GO ID | GO:0000819 | UniProtAcc | A0A024RC19 |
Top |
Malignant transformation analysis |
| Identification of the aberrant gene expression in precancerous and cancerous lesions by comparing the gene expression of stem-like cells in diseased tissues with normal stem cells |
| Entrez ID | Symbol | Replicates | Species | Organ | Tissue | Adj P-value | Log2FC | Malignancy |
| 114799 | ESCO1 | LZE3D | Human | Esophagus | HGIN | 1.08e-02 | 6.34e-01 | 0.0668 |
| 114799 | ESCO1 | LZE4T | Human | Esophagus | ESCC | 9.24e-15 | 4.54e-01 | 0.0811 |
| 114799 | ESCO1 | LZE5T | Human | Esophagus | ESCC | 1.17e-04 | 4.46e-01 | 0.0514 |
| 114799 | ESCO1 | LZE7T | Human | Esophagus | ESCC | 2.18e-07 | 4.62e-01 | 0.0667 |
| 114799 | ESCO1 | LZE8T | Human | Esophagus | ESCC | 1.62e-03 | 1.67e-01 | 0.067 |
| 114799 | ESCO1 | LZE20T | Human | Esophagus | ESCC | 1.04e-03 | 9.80e-02 | 0.0662 |
| 114799 | ESCO1 | LZE24T | Human | Esophagus | ESCC | 1.20e-16 | 3.65e-01 | 0.0596 |
| 114799 | ESCO1 | P1T-E | Human | Esophagus | ESCC | 7.76e-08 | 4.51e-01 | 0.0875 |
| 114799 | ESCO1 | P2T-E | Human | Esophagus | ESCC | 2.44e-26 | 4.71e-01 | 0.1177 |
| 114799 | ESCO1 | P4T-E | Human | Esophagus | ESCC | 1.24e-30 | 7.68e-01 | 0.1323 |
| 114799 | ESCO1 | P5T-E | Human | Esophagus | ESCC | 9.19e-23 | 4.10e-01 | 0.1327 |
| 114799 | ESCO1 | P8T-E | Human | Esophagus | ESCC | 3.66e-24 | 4.48e-01 | 0.0889 |
| 114799 | ESCO1 | P9T-E | Human | Esophagus | ESCC | 1.09e-18 | 4.72e-01 | 0.1131 |
| 114799 | ESCO1 | P10T-E | Human | Esophagus | ESCC | 8.80e-24 | 3.80e-01 | 0.116 |
| 114799 | ESCO1 | P11T-E | Human | Esophagus | ESCC | 8.54e-13 | 4.94e-01 | 0.1426 |
| 114799 | ESCO1 | P12T-E | Human | Esophagus | ESCC | 2.16e-33 | 5.68e-01 | 0.1122 |
| 114799 | ESCO1 | P15T-E | Human | Esophagus | ESCC | 1.85e-18 | 4.32e-01 | 0.1149 |
| 114799 | ESCO1 | P16T-E | Human | Esophagus | ESCC | 1.34e-15 | 3.73e-01 | 0.1153 |
| 114799 | ESCO1 | P17T-E | Human | Esophagus | ESCC | 2.73e-04 | 3.29e-01 | 0.1278 |
| 114799 | ESCO1 | P19T-E | Human | Esophagus | ESCC | 1.11e-03 | 3.31e-01 | 0.1662 |
| Page: 1 2 3 4 5 6 |
| Tissue | Expression Dynamics | Abbreviation |
| Esophagus |  | ESCC: Esophageal squamous cell carcinoma |
| HGIN: High-grade intraepithelial neoplasias | ||
| LGIN: Low-grade intraepithelial neoplasias | ||
| Liver | 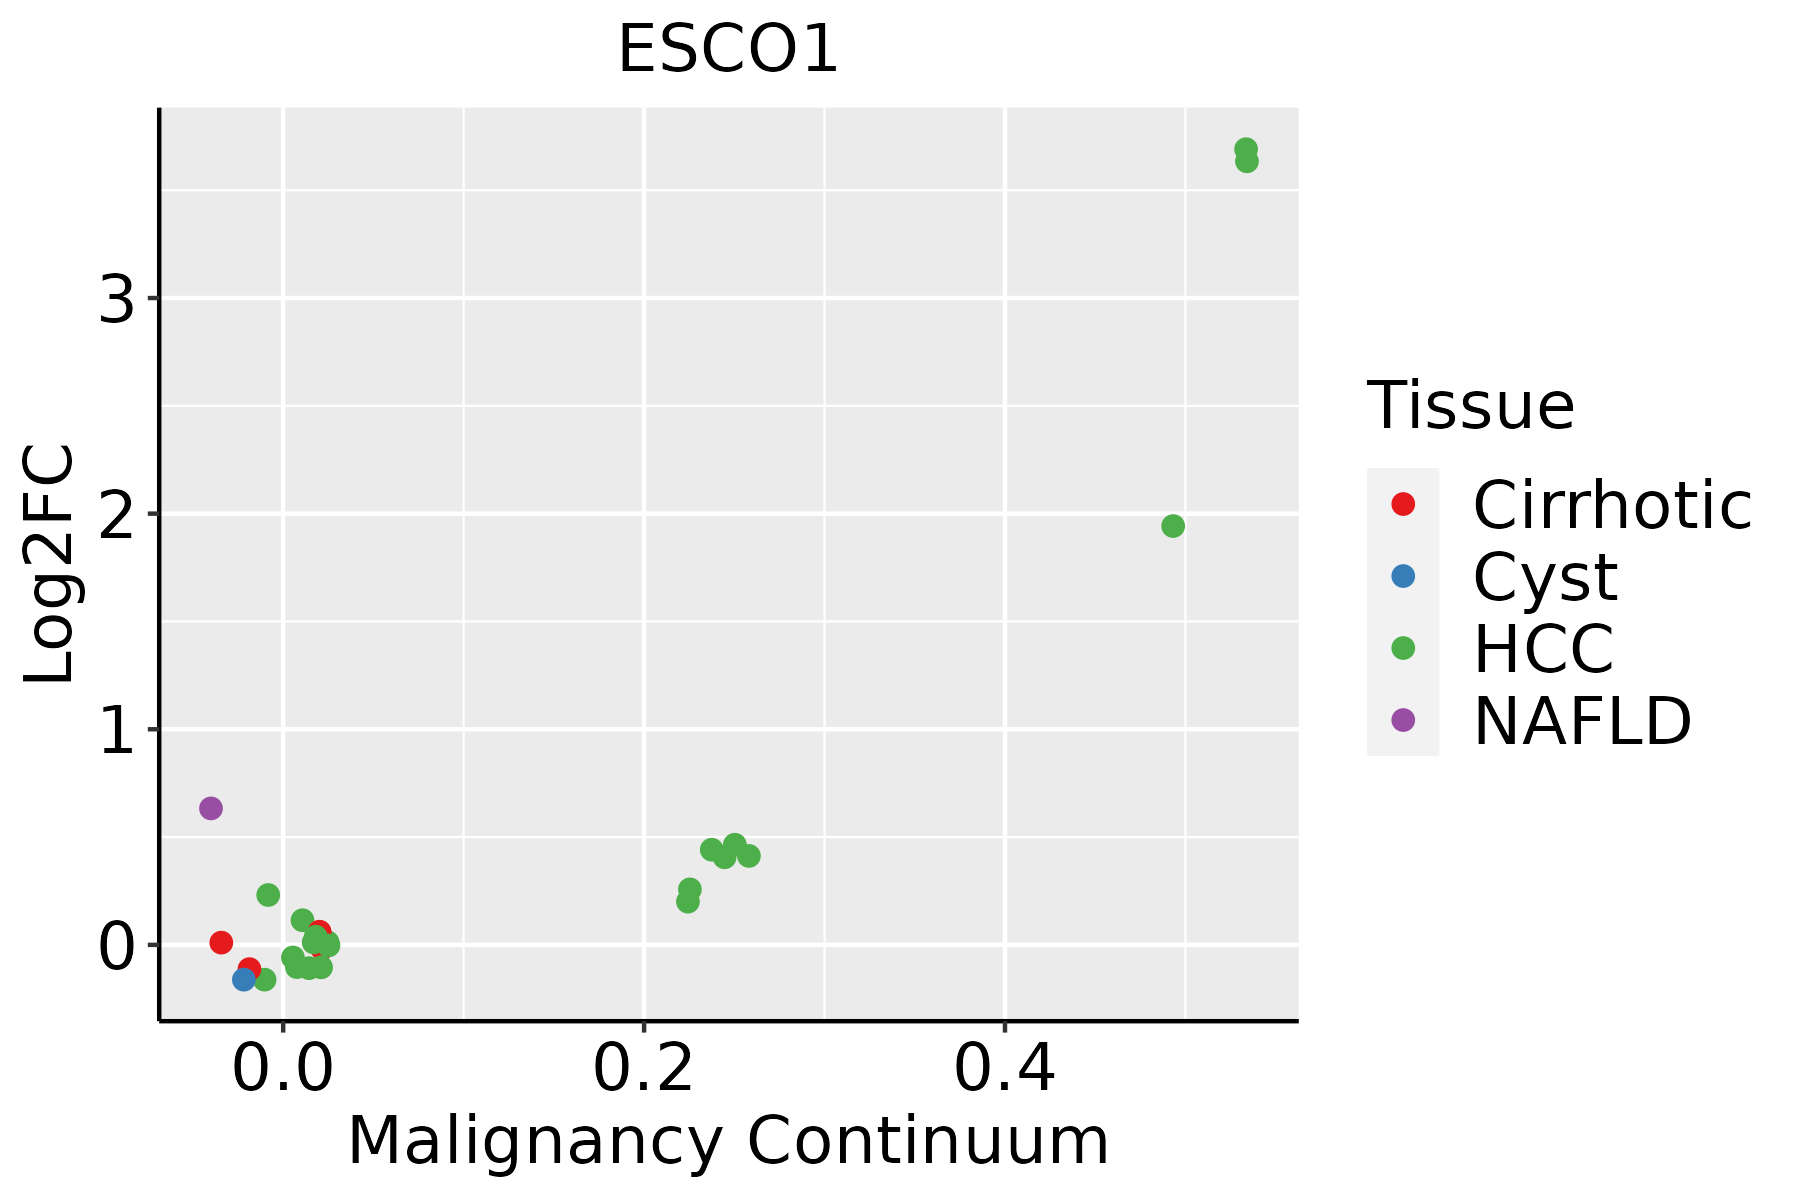 | HCC: Hepatocellular carcinoma |
| NAFLD: Non-alcoholic fatty liver disease | ||
| Oral Cavity |  | EOLP: Erosive Oral lichen planus |
| LP: leukoplakia | ||
| NEOLP: Non-erosive oral lichen planus | ||
| OSCC: Oral squamous cell carcinoma | ||
| Skin | 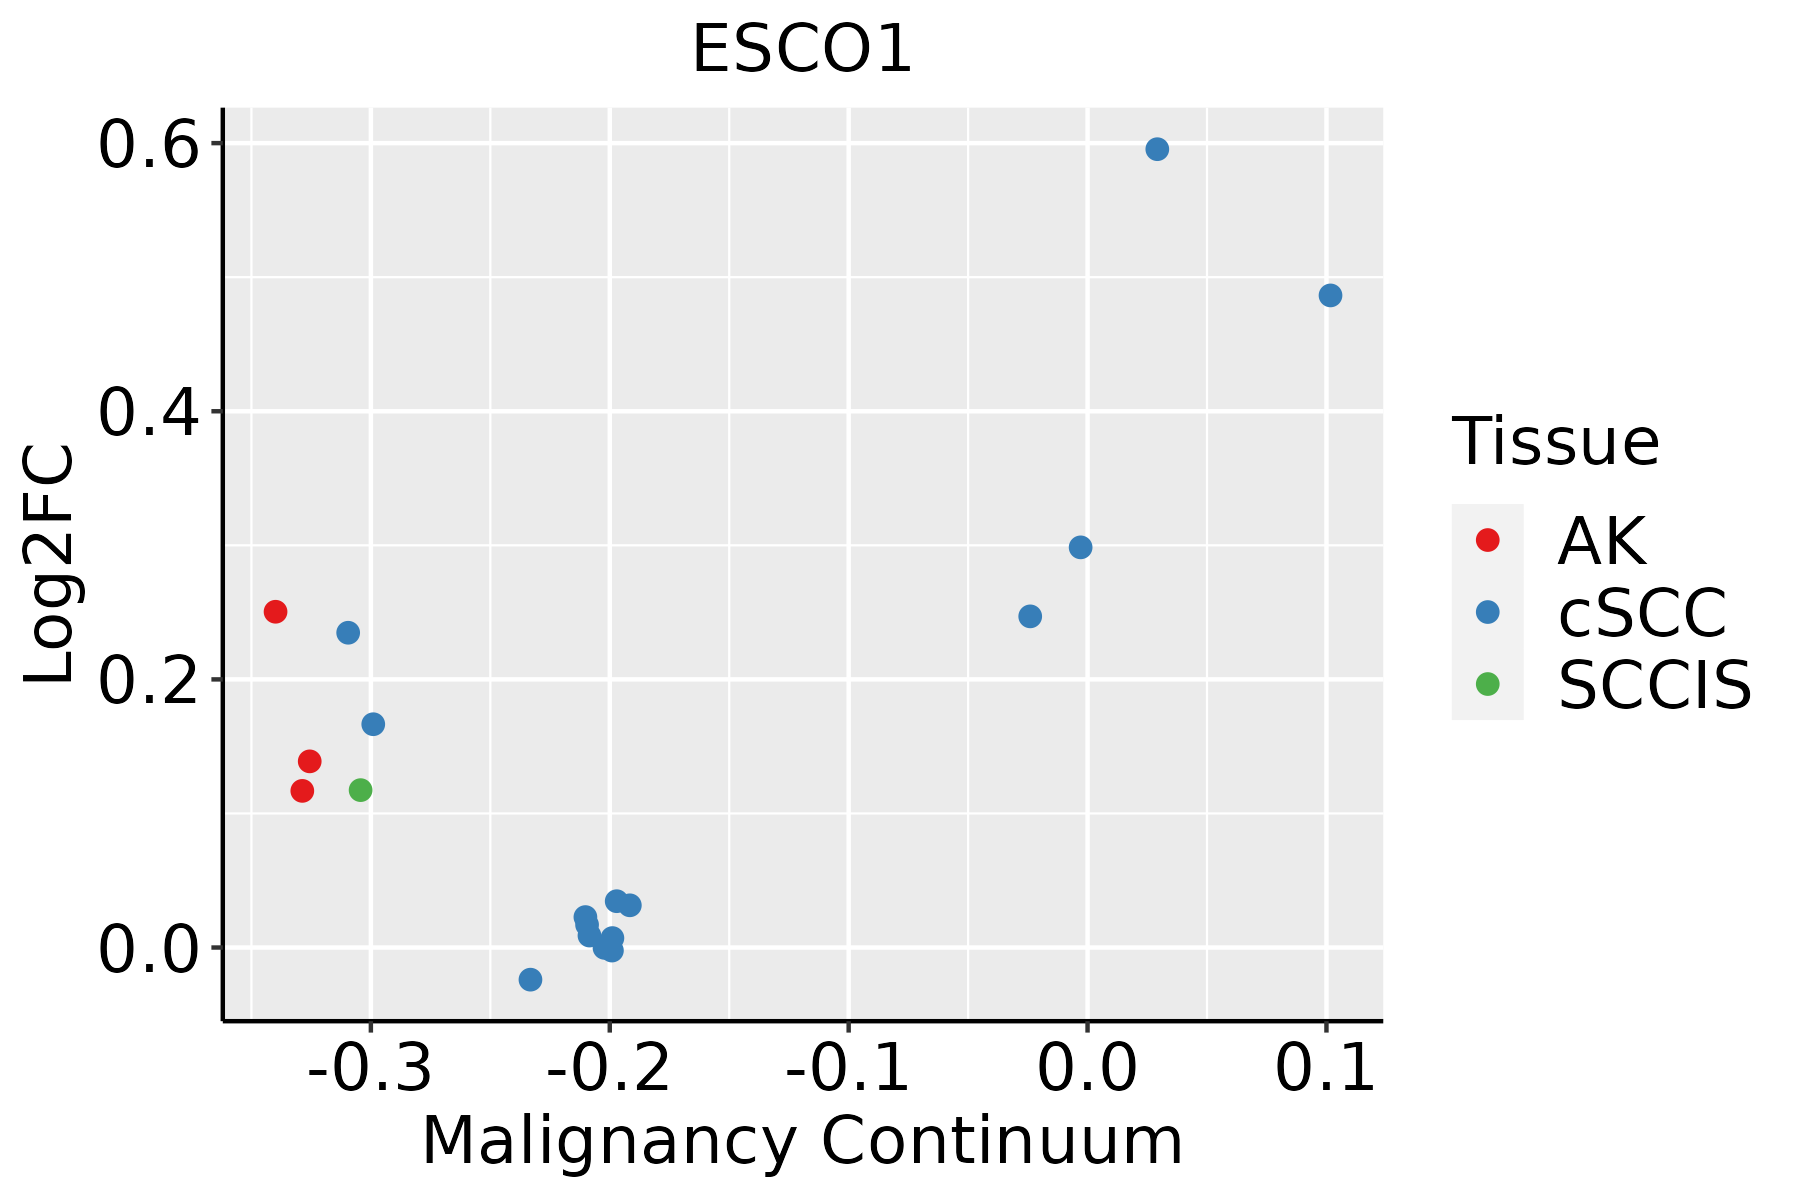 | AK: Actinic keratosis |
| cSCC: Cutaneous squamous cell carcinoma | ||
| SCCIS:squamous cell carcinoma in situ | ||
| Thyroid |  | ATC: Anaplastic thyroid cancer |
| HT: Hashimoto's thyroiditis | ||
| PTC: Papillary thyroid cancer |
| ∗log2FC in expression of this searched gene in stem-like cells from each diseased tissue sample relative to stem-like cells in normal samples in each tissue plotted against the malignancy continuum. Samples are colored based on if they are from different disease stage. |
Top |
Malignant transformation related pathway analysis |
| Find out the enriched GO biological processes and KEGG pathways involved in transition from healthy to precancer to cancer |
| Tissue | Disease Stage | Enriched GO biological Processes |
| Colorectum | AD |  |
| Colorectum | SER |  |
| Colorectum | MSS |  |
| Colorectum | MSI-H |  |
| Colorectum | FAP |  |
| ∗Top 15 enriched GO BP terms are showed in the bar plot of each disease state in each tissue. Each row represents a significant GO biological process which is colored according to the -log10(p.adjust). |
| Page: 1 2 3 4 5 6 7 8 9 |
| GO ID | Tissue | Disease Stage | Description | Gene Ratio | Bg Ratio | pvalue | p.adjust | Count |
| GO:00008194 | Esophagus | ESCC | sister chromatid segregation | 157/8552 | 202/18723 | 8.41e-21 | 1.33e-18 | 157 |
| GO:001820514 | Esophagus | ESCC | peptidyl-lysine modification | 259/8552 | 376/18723 | 3.90e-20 | 5.26e-18 | 259 |
| GO:000705911 | Esophagus | ESCC | chromosome segregation | 238/8552 | 346/18723 | 1.72e-18 | 1.82e-16 | 238 |
| GO:00062604 | Esophagus | ESCC | DNA replication | 181/8552 | 260/18723 | 3.55e-15 | 2.05e-13 | 181 |
| GO:001839413 | Esophagus | ESCC | peptidyl-lysine acetylation | 123/8552 | 169/18723 | 6.58e-13 | 2.94e-11 | 123 |
| GO:00988133 | Esophagus | ESCC | nuclear chromosome segregation | 187/8552 | 281/18723 | 1.00e-12 | 4.36e-11 | 187 |
| GO:004354313 | Esophagus | ESCC | protein acylation | 165/8552 | 243/18723 | 1.69e-12 | 7.14e-11 | 165 |
| GO:000647313 | Esophagus | ESCC | protein acetylation | 140/8552 | 201/18723 | 4.37e-12 | 1.69e-10 | 140 |
| GO:00062754 | Esophagus | ESCC | regulation of DNA replication | 73/8552 | 107/18723 | 1.97e-06 | 2.28e-05 | 73 |
| GO:00070627 | Esophagus | ESCC | sister chromatid cohesion | 40/8552 | 62/18723 | 2.14e-03 | 9.54e-03 | 40 |
| GO:0018205 | Liver | NAFLD | peptidyl-lysine modification | 65/1882 | 376/18723 | 9.42e-06 | 3.02e-04 | 65 |
| GO:0043543 | Liver | NAFLD | protein acylation | 43/1882 | 243/18723 | 1.70e-04 | 3.07e-03 | 43 |
| GO:0006473 | Liver | NAFLD | protein acetylation | 37/1882 | 201/18723 | 2.10e-04 | 3.61e-03 | 37 |
| GO:0018394 | Liver | NAFLD | peptidyl-lysine acetylation | 32/1882 | 169/18723 | 3.24e-04 | 5.00e-03 | 32 |
| GO:00064731 | Liver | Cirrhotic | protein acetylation | 84/4634 | 201/18723 | 7.50e-08 | 2.25e-06 | 84 |
| GO:00183941 | Liver | Cirrhotic | peptidyl-lysine acetylation | 73/4634 | 169/18723 | 1.08e-07 | 3.07e-06 | 73 |
| GO:00435431 | Liver | Cirrhotic | protein acylation | 95/4634 | 243/18723 | 4.73e-07 | 1.07e-05 | 95 |
| GO:00182051 | Liver | Cirrhotic | peptidyl-lysine modification | 134/4634 | 376/18723 | 1.29e-06 | 2.59e-05 | 134 |
| GO:0000819 | Liver | Cirrhotic | sister chromatid segregation | 65/4634 | 202/18723 | 1.01e-02 | 4.52e-02 | 65 |
| GO:00182052 | Liver | HCC | peptidyl-lysine modification | 230/7958 | 376/18723 | 1.51e-13 | 8.32e-12 | 230 |
| Page: 1 2 3 4 |
| Pathway ID | Tissue | Disease Stage | Description | Gene Ratio | Bg Ratio | pvalue | p.adjust | qvalue | Count |
| hsa0411023 | Esophagus | ESCC | Cell cycle | 126/4205 | 157/8465 | 1.34e-15 | 5.60e-14 | 2.87e-14 | 126 |
| hsa0411033 | Esophagus | ESCC | Cell cycle | 126/4205 | 157/8465 | 1.34e-15 | 5.60e-14 | 2.87e-14 | 126 |
| hsa041104 | Liver | Cirrhotic | Cell cycle | 61/2530 | 157/8465 | 9.53e-03 | 3.21e-02 | 1.98e-02 | 61 |
| hsa0411011 | Liver | Cirrhotic | Cell cycle | 61/2530 | 157/8465 | 9.53e-03 | 3.21e-02 | 1.98e-02 | 61 |
| hsa041102 | Liver | HCC | Cell cycle | 106/4020 | 157/8465 | 2.54e-07 | 3.04e-06 | 1.69e-06 | 106 |
| hsa041103 | Liver | HCC | Cell cycle | 106/4020 | 157/8465 | 2.54e-07 | 3.04e-06 | 1.69e-06 | 106 |
| hsa041108 | Oral cavity | OSCC | Cell cycle | 118/3704 | 157/8465 | 7.15e-16 | 2.66e-14 | 1.35e-14 | 118 |
| hsa0411015 | Oral cavity | OSCC | Cell cycle | 118/3704 | 157/8465 | 7.15e-16 | 2.66e-14 | 1.35e-14 | 118 |
| Page: 1 |
Top |
Cell-cell communication analysis |
| Identification of potential cell-cell interactions between two cell types and their ligand-receptor pairs for different disease states |
| Ligand | Receptor | LRpair | Pathway | Tissue | Disease Stage |
| Page: 1 |
Top |
Single-cell gene regulatory network inference analysis |
| Find out the significant the regulons (TFs) and the target genes of each regulon across cell types for different disease states |
| TF | Cell Type | Tissue | Disease Stage | Target Gene | RSS | Regulon Activity |
| ∗The dot plots of a searched regulon are shown for all cell subpopulations in each disease state of each tissue based on the regulon specific score inferred using pySCENIC and by calculating the average expression. |
| Page: 1 |
Top |
Somatic mutation of malignant transformation related genes |
| Annotation of somatic variants for genes involved in malignant transformation |
| Hugo Symbol | Variant Class | Variant Classification | dbSNP RS | HGVSc | HGVSp | HGVSp Short | SWISSPROT | BIOTYPE | SIFT | PolyPhen | Tumor Sample Barcode | Tissue | Histology | Sex | Age | Stage | Therapy Types | Drugs | Outcome |
| ESCO1 | SNV | Missense_Mutation | rs200657231 | c.1718N>A | p.Arg573Gln | p.R573Q | Q5FWF5 | protein_coding | tolerated(0.31) | benign(0) | TCGA-AN-A046-01 | Breast | breast invasive carcinoma | Female | >=65 | I/II | Unknown | Unknown | SD |
| ESCO1 | SNV | Missense_Mutation | c.928A>G | p.Ile310Val | p.I310V | Q5FWF5 | protein_coding | deleterious(0) | benign(0.277) | TCGA-BH-A0WA-01 | Breast | breast invasive carcinoma | Female | >=65 | I/II | Unknown | Unknown | SD | |
| ESCO1 | SNV | Missense_Mutation | c.1699G>T | p.Asp567Tyr | p.D567Y | Q5FWF5 | protein_coding | deleterious(0) | benign(0.275) | TCGA-BH-A18P-01 | Breast | breast invasive carcinoma | Female | <65 | I/II | Unknown | Unknown | PD | |
| ESCO1 | SNV | Missense_Mutation | novel | c.1847N>G | p.Ala616Gly | p.A616G | Q5FWF5 | protein_coding | deleterious(0) | probably_damaging(0.999) | TCGA-GM-A4E0-01 | Breast | breast invasive carcinoma | Female | >=65 | III/IV | Chemotherapy | xeloda | CR |
| ESCO1 | insertion | Nonsense_Mutation | novel | c.2153_2154insCAGGAGTTTGAGACCAGCCTTGCCAACATTGTGA | p.Val719ArgfsTer11 | p.V719Rfs*11 | Q5FWF5 | protein_coding | TCGA-A8-A06X-01 | Breast | breast invasive carcinoma | Female | >=65 | I/II | Unknown | Unknown | SD | ||
| ESCO1 | insertion | Nonsense_Mutation | novel | c.2060_2061insAAACCTGTTCTCTACTGAAAATACAAAAATTAGCTGAG | p.Met688AsnfsTer12 | p.M688Nfs*12 | Q5FWF5 | protein_coding | TCGA-A8-A09X-01 | Breast | breast invasive carcinoma | Female | <65 | III/IV | Unknown | Unknown | SD | ||
| ESCO1 | deletion | Frame_Shift_Del | novel | c.2151delN | p.Val718Ter | p.V718* | Q5FWF5 | protein_coding | TCGA-EW-A2FV-01 | Breast | breast invasive carcinoma | Female | <65 | III/IV | Chemotherapy | docetaxel | SD | ||
| ESCO1 | SNV | Missense_Mutation | c.1688N>G | p.Ser563Cys | p.S563C | Q5FWF5 | protein_coding | deleterious(0) | possibly_damaging(0.707) | TCGA-EK-A2RA-01 | Cervix | cervical & endocervical cancer | Female | >=65 | I/II | Unknown | Unknown | SD | |
| ESCO1 | SNV | Missense_Mutation | novel | c.2128C>G | p.Leu710Val | p.L710V | Q5FWF5 | protein_coding | deleterious(0) | possibly_damaging(0.514) | TCGA-VS-A958-01 | Cervix | cervical & endocervical cancer | Female | <65 | I/II | Chemotherapy | cisplatin | CR |
| ESCO1 | SNV | Missense_Mutation | c.1747N>T | p.His583Tyr | p.H583Y | Q5FWF5 | protein_coding | tolerated(0.42) | benign(0.035) | TCGA-AA-3697-01 | Colorectum | colon adenocarcinoma | Male | >=65 | I/II | Unknown | Unknown | SD |
| Page: 1 2 3 4 5 6 7 8 9 10 11 |
Top |
Related drugs of malignant transformation related genes |
| Identification of chemicals and drugs interact with genes involved in malignant transfromation |
| (DGIdb 4.0) |
| Entrez ID | Symbol | Category | Interaction Types | Drug Claim Name | Drug Name | PMIDs |
| Page: 1 |

Copyright 2023-Present -The University of Texas Health Science Center at Houston |