
|
|||||
|
 | |
| |
| |
| |
| |
| |
|
Gene: ERVK3-1 |
Gene summary for ERVK3-1 |
| Gene information | Species | Human | Gene symbol | ERVK3-1 | Gene ID | 105372481 |
| Gene name | endogenous retrovirus group K3 member 1 | |
| Gene Alias | ERVK3-1 | |
| Cytomap | 19q13.43 | |
| Gene Type | ncRNA | GO ID | NA | UniProtAcc | NA |
Top |
Malignant transformation analysis |
| Identification of the aberrant gene expression in precancerous and cancerous lesions by comparing the gene expression of stem-like cells in diseased tissues with normal stem cells |
| Entrez ID | Symbol | Replicates | Species | Organ | Tissue | Adj P-value | Log2FC | Malignancy |
| 105372481 | ERVK3-1 | LZE2T | Human | Esophagus | ESCC | 4.11e-04 | 4.26e-01 | 0.082 |
| 105372481 | ERVK3-1 | LZE4T | Human | Esophagus | ESCC | 4.23e-12 | 3.67e-01 | 0.0811 |
| 105372481 | ERVK3-1 | LZE5T | Human | Esophagus | ESCC | 1.12e-05 | 4.75e-01 | 0.0514 |
| 105372481 | ERVK3-1 | LZE7T | Human | Esophagus | ESCC | 4.10e-15 | 8.29e-01 | 0.0667 |
| 105372481 | ERVK3-1 | LZE8T | Human | Esophagus | ESCC | 3.30e-12 | 2.67e-01 | 0.067 |
| 105372481 | ERVK3-1 | LZE20T | Human | Esophagus | ESCC | 5.44e-09 | 3.31e-01 | 0.0662 |
| 105372481 | ERVK3-1 | LZE22D1 | Human | Esophagus | HGIN | 1.05e-06 | 2.16e-01 | 0.0595 |
| 105372481 | ERVK3-1 | LZE22T | Human | Esophagus | ESCC | 1.76e-07 | 4.51e-01 | 0.068 |
| 105372481 | ERVK3-1 | LZE24T | Human | Esophagus | ESCC | 6.26e-24 | 6.69e-01 | 0.0596 |
| 105372481 | ERVK3-1 | LZE21T | Human | Esophagus | ESCC | 1.28e-04 | 3.04e-01 | 0.0655 |
| 105372481 | ERVK3-1 | LZE6T | Human | Esophagus | ESCC | 7.79e-12 | 5.02e-01 | 0.0845 |
| 105372481 | ERVK3-1 | P1T-E | Human | Esophagus | ESCC | 1.33e-12 | 5.74e-01 | 0.0875 |
| 105372481 | ERVK3-1 | P2T-E | Human | Esophagus | ESCC | 1.08e-30 | 4.41e-01 | 0.1177 |
| 105372481 | ERVK3-1 | P4T-E | Human | Esophagus | ESCC | 4.90e-36 | 7.93e-01 | 0.1323 |
| 105372481 | ERVK3-1 | P5T-E | Human | Esophagus | ESCC | 8.98e-13 | 2.28e-01 | 0.1327 |
| 105372481 | ERVK3-1 | P8T-E | Human | Esophagus | ESCC | 1.25e-56 | 9.53e-01 | 0.0889 |
| 105372481 | ERVK3-1 | P9T-E | Human | Esophagus | ESCC | 1.14e-14 | 2.93e-01 | 0.1131 |
| 105372481 | ERVK3-1 | P10T-E | Human | Esophagus | ESCC | 2.61e-50 | 8.81e-01 | 0.116 |
| 105372481 | ERVK3-1 | P11T-E | Human | Esophagus | ESCC | 2.14e-22 | 9.08e-01 | 0.1426 |
| 105372481 | ERVK3-1 | P12T-E | Human | Esophagus | ESCC | 5.03e-34 | 6.08e-01 | 0.1122 |
| Page: 1 2 3 4 |
| Tissue | Expression Dynamics | Abbreviation |
| Esophagus | 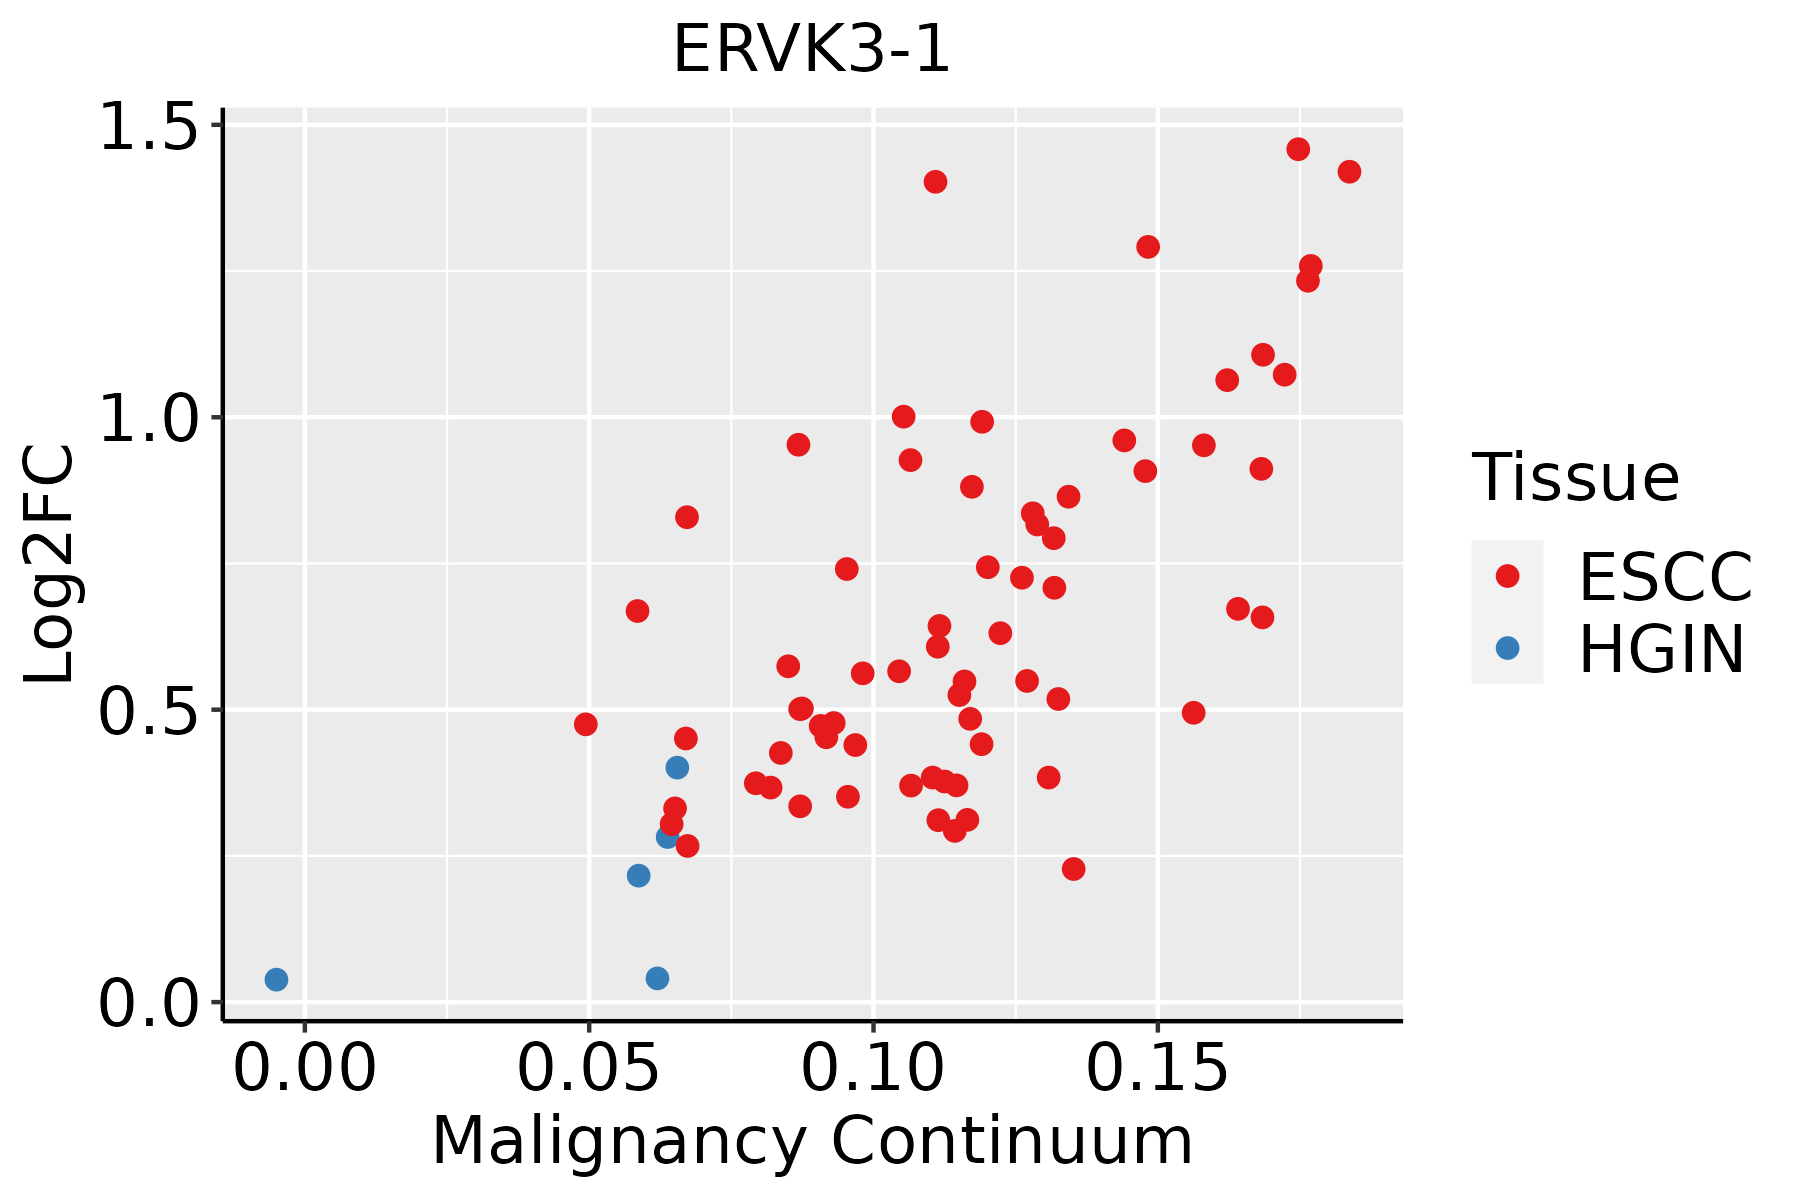 | ESCC: Esophageal squamous cell carcinoma |
| HGIN: High-grade intraepithelial neoplasias | ||
| LGIN: Low-grade intraepithelial neoplasias |
| ∗log2FC in expression of this searched gene in stem-like cells from each diseased tissue sample relative to stem-like cells in normal samples in each tissue plotted against the malignancy continuum. Samples are colored based on if they are from different disease stage. |
Top |
Malignant transformation related pathway analysis |
| Find out the enriched GO biological processes and KEGG pathways involved in transition from healthy to precancer to cancer |
| Tissue | Disease Stage | Enriched GO biological Processes |
| Colorectum | AD |  |
| Colorectum | SER |  |
| Colorectum | MSS |  |
| Colorectum | MSI-H |  |
| Colorectum | FAP |  |
| ∗Top 15 enriched GO BP terms are showed in the bar plot of each disease state in each tissue. Each row represents a significant GO biological process which is colored according to the -log10(p.adjust). |
| Page: 1 2 3 4 5 6 7 8 9 |
| GO ID | Tissue | Disease Stage | Description | Gene Ratio | Bg Ratio | pvalue | p.adjust | Count |
| Page: 1 |
| Pathway ID | Tissue | Disease Stage | Description | Gene Ratio | Bg Ratio | pvalue | p.adjust | qvalue | Count |
| Page: 1 |
Top |
Cell-cell communication analysis |
| Identification of potential cell-cell interactions between two cell types and their ligand-receptor pairs for different disease states |
| Ligand | Receptor | LRpair | Pathway | Tissue | Disease Stage |
| Page: 1 |
Top |
Single-cell gene regulatory network inference analysis |
| Find out the significant the regulons (TFs) and the target genes of each regulon across cell types for different disease states |
| TF | Cell Type | Tissue | Disease Stage | Target Gene | RSS | Regulon Activity |
| ∗The dot plots of a searched regulon are shown for all cell subpopulations in each disease state of each tissue based on the regulon specific score inferred using pySCENIC and by calculating the average expression. |
| Page: 1 |
Top |
Somatic mutation of malignant transformation related genes |
| Annotation of somatic variants for genes involved in malignant transformation |
| Hugo Symbol | Variant Class | Variant Classification | dbSNP RS | HGVSc | HGVSp | HGVSp Short | SWISSPROT | BIOTYPE | SIFT | PolyPhen | Tumor Sample Barcode | Tissue | Histology | Sex | Age | Stage | Therapy Types | Drugs | Outcome |
| ERVK3-1 | SNV | Missense_Mutation | novel | c.71G>A | p.Gly24Glu | p.G24E | protein_coding | tolerated_low_confidence(0.78) | probably_damaging(0.97) | TCGA-VS-A958-01 | Cervix | cervical & endocervical cancer | Female | <65 | I/II | Chemotherapy | cisplatin | CR | |
| ERVK3-1 | SNV | Missense_Mutation | rs11558785 | c.76N>T | p.Arg26Trp | p.R26W | protein_coding | deleterious_low_confidence(0) | benign(0.029) | TCGA-AJ-A3OJ-01 | Endometrium | uterine corpus endometrioid carcinoma | Female | <65 | I/II | Chemotherapy | carboplatin | CR | |
| ERVK3-1 | SNV | Missense_Mutation | novel | c.250C>T | p.Arg84Cys | p.R84C | protein_coding | deleterious(0.05) | possibly_damaging(0.833) | TCGA-AP-A0LM-01 | Endometrium | uterine corpus endometrioid carcinoma | Female | <65 | III/IV | Chemotherapy | cisplatin | SD | |
| ERVK3-1 | SNV | Missense_Mutation | rs188023367 | c.326C>T | p.Ser109Leu | p.S109L | protein_coding | tolerated_low_confidence(0.06) | possibly_damaging(0.514) | TCGA-AP-A0LM-01 | Endometrium | uterine corpus endometrioid carcinoma | Female | <65 | III/IV | Chemotherapy | cisplatin | SD | |
| ERVK3-1 | SNV | Missense_Mutation | rs188835108 | c.136N>T | p.Arg46Trp | p.R46W | protein_coding | deleterious_low_confidence(0.02) | possibly_damaging(0.833) | TCGA-AX-A2HC-01 | Endometrium | uterine corpus endometrioid carcinoma | Female | <65 | III/IV | Chemotherapy | paclitaxel | PD | |
| ERVK3-1 | SNV | Missense_Mutation | novel | c.59N>G | p.Asp20Gly | p.D20G | protein_coding | tolerated_low_confidence(0.62) | possibly_damaging(0.737) | TCGA-AX-A2HD-01 | Endometrium | uterine corpus endometrioid carcinoma | Female | >=65 | III/IV | Unknown | Unknown | SD | |
| ERVK3-1 | SNV | Missense_Mutation | rs187330410 | c.314C>T | p.Ala105Val | p.A105V | protein_coding | tolerated_low_confidence(0.26) | possibly_damaging(0.691) | TCGA-B5-A3FC-01 | Endometrium | uterine corpus endometrioid carcinoma | Female | <65 | I/II | Unknown | Unknown | SD | |
| ERVK3-1 | SNV | Missense_Mutation | novel | c.41N>T | p.Cys14Phe | p.C14F | protein_coding | tolerated_low_confidence(1) | possibly_damaging(0.516) | TCGA-BG-A0M0-01 | Endometrium | uterine corpus endometrioid carcinoma | Female | >=65 | I/II | Unknown | Unknown | SD | |
| ERVK3-1 | SNV | Missense_Mutation | novel | c.7N>T | p.Val3Leu | p.V3L | protein_coding | deleterious_low_confidence(0) | unknown(0) | TCGA-BG-A222-01 | Endometrium | uterine corpus endometrioid carcinoma | Female | <65 | I/II | Unknown | Unknown | SD |
| Page: 1 |
Top |
Related drugs of malignant transformation related genes |
| Identification of chemicals and drugs interact with genes involved in malignant transfromation |
| (DGIdb 4.0) |
| Entrez ID | Symbol | Category | Interaction Types | Drug Claim Name | Drug Name | PMIDs |
| Page: 1 |

Copyright 2023-Present -The University of Texas Health Science Center at Houston |