
|
|||||
|
 | |
| |
| |
| |
| |
| |
|
Gene: ERP44 |
Gene summary for ERP44 |
| Gene information | Species | Human | Gene symbol | ERP44 | Gene ID | 23071 |
| Gene name | endoplasmic reticulum protein 44 | |
| Gene Alias | PDIA10 | |
| Cytomap | 9q31.1 | |
| Gene Type | protein-coding | GO ID | GO:0006457 | UniProtAcc | Q9BS26 |
Top |
Malignant transformation analysis |
| Identification of the aberrant gene expression in precancerous and cancerous lesions by comparing the gene expression of stem-like cells in diseased tissues with normal stem cells |
| Entrez ID | Symbol | Replicates | Species | Organ | Tissue | Adj P-value | Log2FC | Malignancy |
| 23071 | ERP44 | LZE2T | Human | Esophagus | ESCC | 2.01e-02 | 7.13e-01 | 0.082 |
| 23071 | ERP44 | LZE4T | Human | Esophagus | ESCC | 1.71e-19 | 4.71e-01 | 0.0811 |
| 23071 | ERP44 | LZE7T | Human | Esophagus | ESCC | 4.35e-04 | 3.81e-01 | 0.0667 |
| 23071 | ERP44 | LZE20T | Human | Esophagus | ESCC | 3.62e-05 | 2.38e-01 | 0.0662 |
| 23071 | ERP44 | LZE24T | Human | Esophagus | ESCC | 2.18e-20 | 6.79e-01 | 0.0596 |
| 23071 | ERP44 | LZE6T | Human | Esophagus | ESCC | 6.85e-06 | 5.83e-01 | 0.0845 |
| 23071 | ERP44 | P2T-E | Human | Esophagus | ESCC | 5.42e-52 | 9.29e-01 | 0.1177 |
| 23071 | ERP44 | P4T-E | Human | Esophagus | ESCC | 4.75e-38 | 9.21e-01 | 0.1323 |
| 23071 | ERP44 | P5T-E | Human | Esophagus | ESCC | 5.81e-22 | 3.43e-01 | 0.1327 |
| 23071 | ERP44 | P8T-E | Human | Esophagus | ESCC | 2.60e-32 | 5.93e-01 | 0.0889 |
| 23071 | ERP44 | P9T-E | Human | Esophagus | ESCC | 2.81e-21 | 5.77e-01 | 0.1131 |
| 23071 | ERP44 | P10T-E | Human | Esophagus | ESCC | 2.19e-33 | 6.54e-01 | 0.116 |
| 23071 | ERP44 | P11T-E | Human | Esophagus | ESCC | 4.26e-30 | 1.24e+00 | 0.1426 |
| 23071 | ERP44 | P12T-E | Human | Esophagus | ESCC | 3.52e-36 | 6.23e-01 | 0.1122 |
| 23071 | ERP44 | P15T-E | Human | Esophagus | ESCC | 7.10e-27 | 6.34e-01 | 0.1149 |
| 23071 | ERP44 | P16T-E | Human | Esophagus | ESCC | 1.21e-32 | 6.34e-01 | 0.1153 |
| 23071 | ERP44 | P17T-E | Human | Esophagus | ESCC | 3.76e-14 | 4.73e-01 | 0.1278 |
| 23071 | ERP44 | P19T-E | Human | Esophagus | ESCC | 1.94e-04 | 7.48e-01 | 0.1662 |
| 23071 | ERP44 | P20T-E | Human | Esophagus | ESCC | 2.99e-20 | 4.96e-01 | 0.1124 |
| 23071 | ERP44 | P21T-E | Human | Esophagus | ESCC | 8.23e-64 | 1.42e+00 | 0.1617 |
| Page: 1 2 3 4 5 6 |
| Tissue | Expression Dynamics | Abbreviation |
| Esophagus |  | ESCC: Esophageal squamous cell carcinoma |
| HGIN: High-grade intraepithelial neoplasias | ||
| LGIN: Low-grade intraepithelial neoplasias | ||
| Liver | 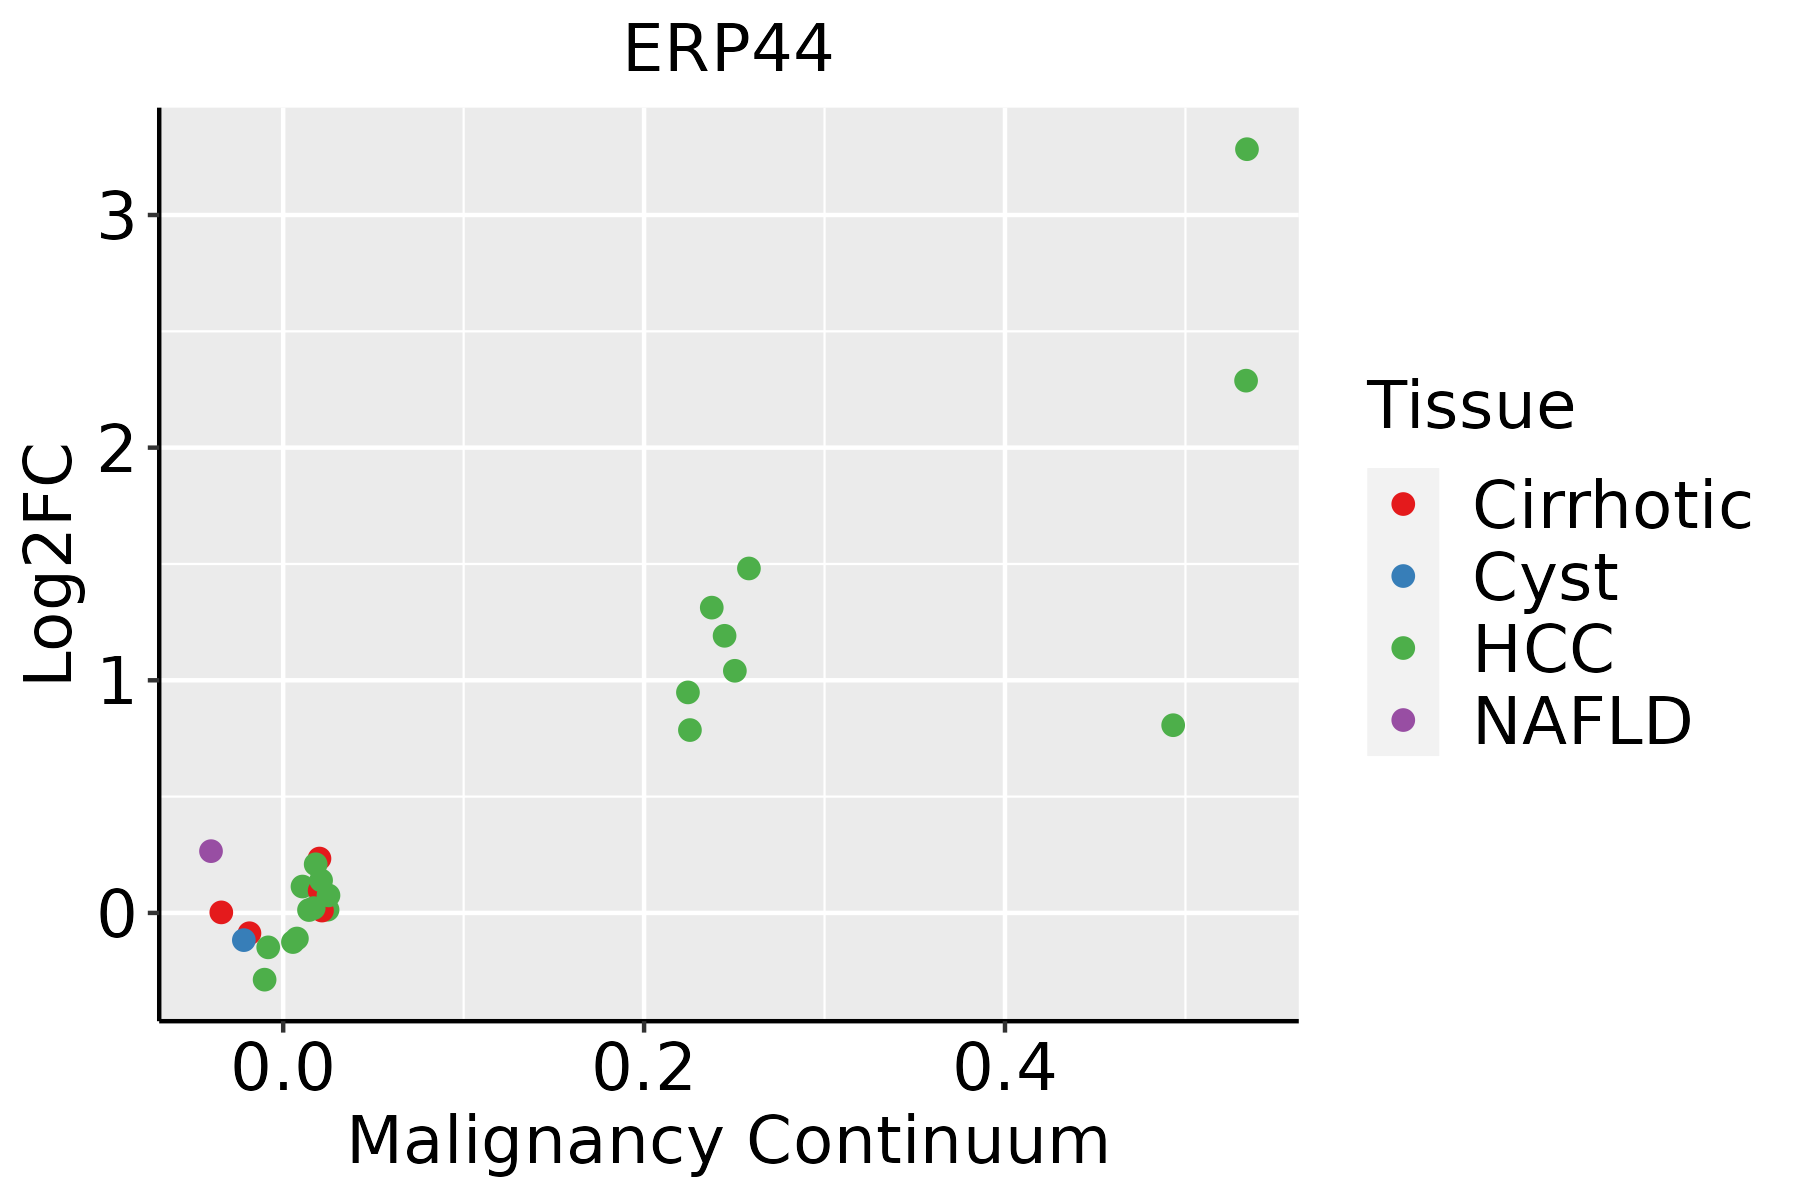 | HCC: Hepatocellular carcinoma |
| NAFLD: Non-alcoholic fatty liver disease | ||
| Oral Cavity | 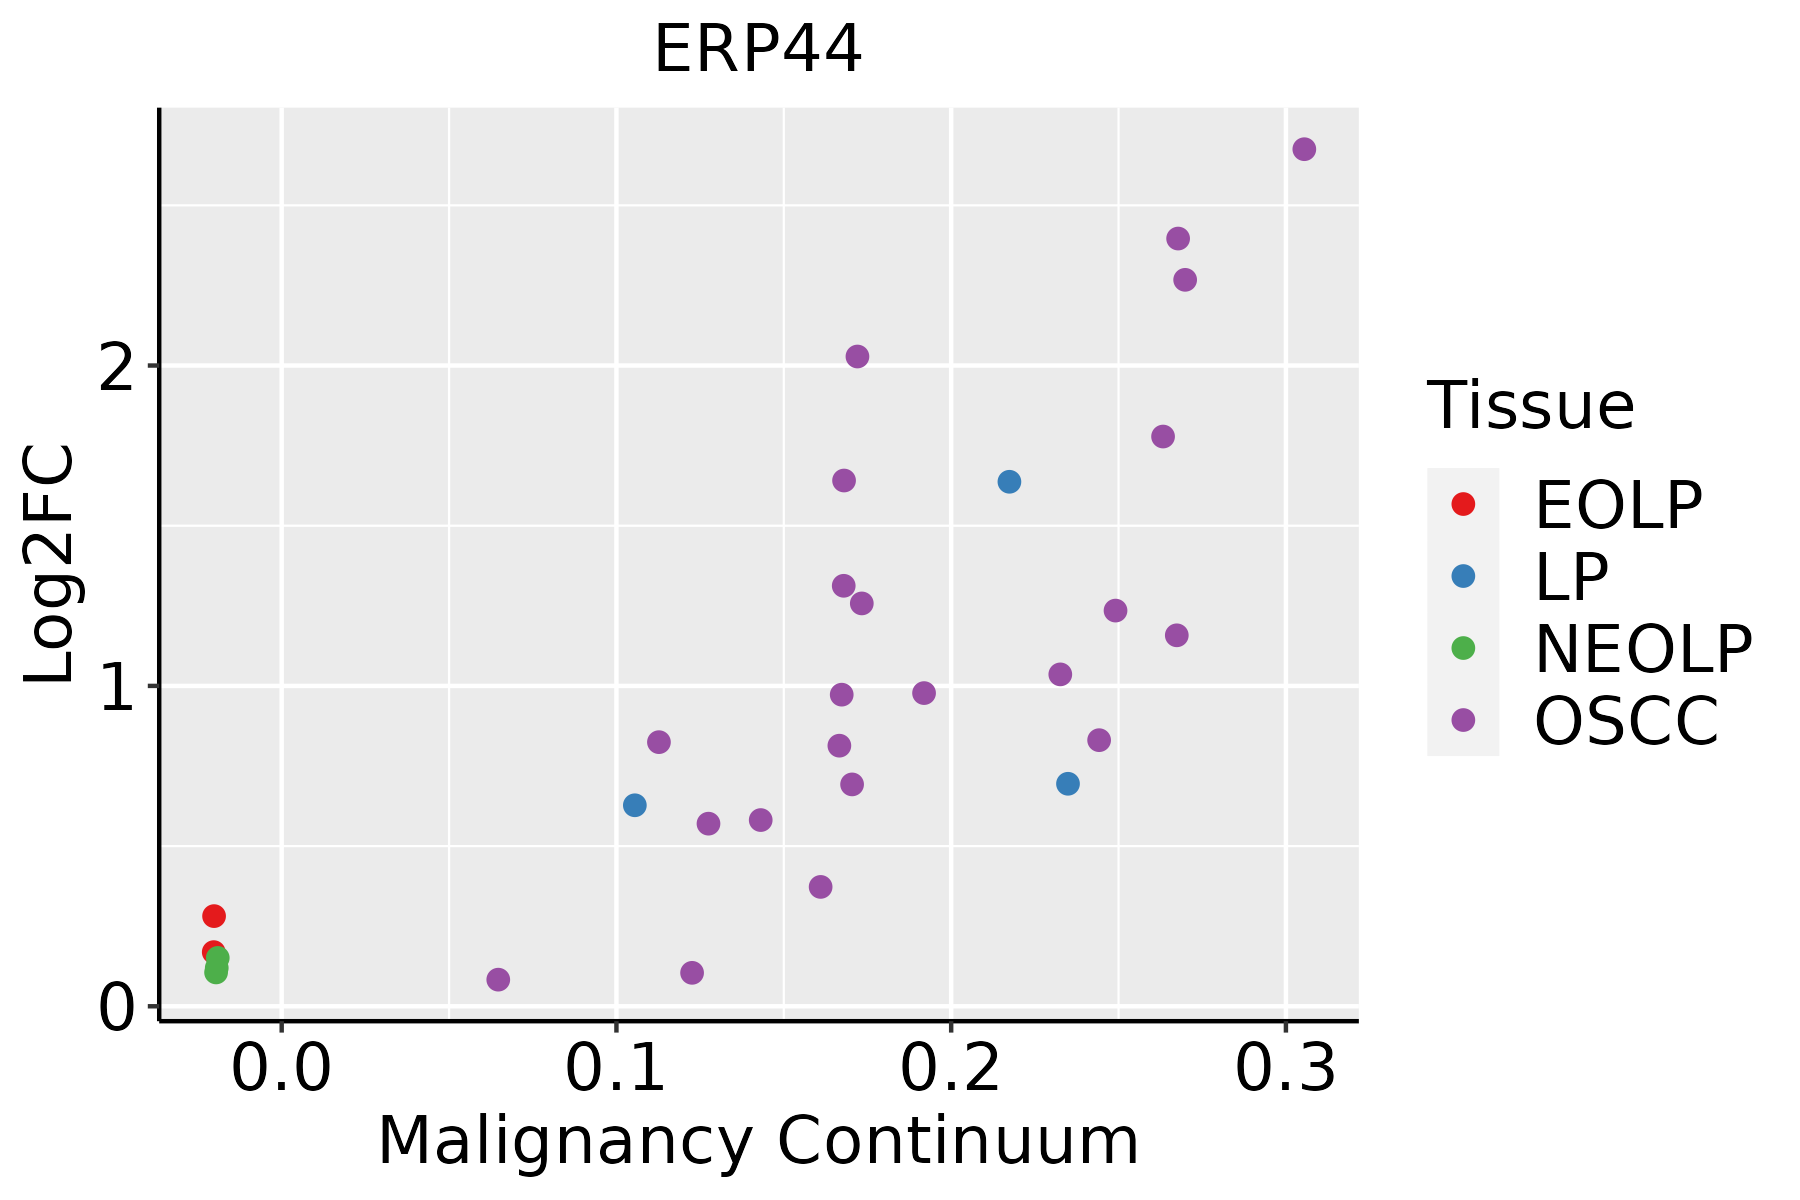 | EOLP: Erosive Oral lichen planus |
| LP: leukoplakia | ||
| NEOLP: Non-erosive oral lichen planus | ||
| OSCC: Oral squamous cell carcinoma | ||
| Skin |  | AK: Actinic keratosis |
| cSCC: Cutaneous squamous cell carcinoma | ||
| SCCIS:squamous cell carcinoma in situ | ||
| Thyroid |  | ATC: Anaplastic thyroid cancer |
| HT: Hashimoto's thyroiditis | ||
| PTC: Papillary thyroid cancer |
| ∗log2FC in expression of this searched gene in stem-like cells from each diseased tissue sample relative to stem-like cells in normal samples in each tissue plotted against the malignancy continuum. Samples are colored based on if they are from different disease stage. |
Top |
Malignant transformation related pathway analysis |
| Find out the enriched GO biological processes and KEGG pathways involved in transition from healthy to precancer to cancer |
| Tissue | Disease Stage | Enriched GO biological Processes |
| Colorectum | AD |  |
| Colorectum | SER |  |
| Colorectum | MSS |  |
| Colorectum | MSI-H |  |
| Colorectum | FAP |  |
| ∗Top 15 enriched GO BP terms are showed in the bar plot of each disease state in each tissue. Each row represents a significant GO biological process which is colored according to the -log10(p.adjust). |
| Page: 1 2 3 4 5 6 7 8 9 |
| GO ID | Tissue | Disease Stage | Description | Gene Ratio | Bg Ratio | pvalue | p.adjust | Count |
| GO:0034976111 | Esophagus | ESCC | response to endoplasmic reticulum stress | 192/8552 | 256/18723 | 7.15e-22 | 1.30e-19 | 192 |
| GO:0006457110 | Esophagus | ESCC | protein folding | 163/8552 | 212/18723 | 1.13e-20 | 1.74e-18 | 163 |
| GO:0035966111 | Esophagus | ESCC | response to topologically incorrect protein | 125/8552 | 159/18723 | 1.44e-17 | 1.27e-15 | 125 |
| GO:0006986111 | Esophagus | ESCC | response to unfolded protein | 107/8552 | 137/18723 | 7.01e-15 | 3.87e-13 | 107 |
| GO:00091002 | Esophagus | ESCC | glycoprotein metabolic process | 226/8552 | 387/18723 | 2.64e-07 | 3.94e-06 | 226 |
| GO:004545419 | Esophagus | ESCC | cell redox homeostasis | 29/8552 | 35/18723 | 6.61e-06 | 6.75e-05 | 29 |
| GO:00064577 | Liver | Cirrhotic | protein folding | 114/4634 | 212/18723 | 9.23e-20 | 2.31e-17 | 114 |
| GO:00349767 | Liver | Cirrhotic | response to endoplasmic reticulum stress | 130/4634 | 256/18723 | 1.72e-19 | 3.86e-17 | 130 |
| GO:00359667 | Liver | Cirrhotic | response to topologically incorrect protein | 91/4634 | 159/18723 | 2.07e-18 | 3.60e-16 | 91 |
| GO:00069867 | Liver | Cirrhotic | response to unfolded protein | 79/4634 | 137/18723 | 1.99e-16 | 2.49e-14 | 79 |
| GO:00454547 | Liver | Cirrhotic | cell redox homeostasis | 16/4634 | 35/18723 | 5.53e-03 | 2.80e-02 | 16 |
| GO:003497612 | Liver | HCC | response to endoplasmic reticulum stress | 189/7958 | 256/18723 | 1.43e-24 | 4.06e-22 | 189 |
| GO:000645712 | Liver | HCC | protein folding | 160/7958 | 212/18723 | 1.07e-22 | 1.88e-20 | 160 |
| GO:003596612 | Liver | HCC | response to topologically incorrect protein | 123/7958 | 159/18723 | 2.60e-19 | 3.44e-17 | 123 |
| GO:000698612 | Liver | HCC | response to unfolded protein | 103/7958 | 137/18723 | 6.50e-15 | 4.48e-13 | 103 |
| GO:004545412 | Liver | HCC | cell redox homeostasis | 26/7958 | 35/18723 | 1.37e-04 | 1.11e-03 | 26 |
| GO:0009100 | Liver | HCC | glycoprotein metabolic process | 193/7958 | 387/18723 | 1.89e-03 | 9.62e-03 | 193 |
| GO:000645718 | Oral cavity | OSCC | protein folding | 154/7305 | 212/18723 | 1.89e-23 | 4.60e-21 | 154 |
| GO:003497620 | Oral cavity | OSCC | response to endoplasmic reticulum stress | 178/7305 | 256/18723 | 2.59e-23 | 6.06e-21 | 178 |
| GO:003596620 | Oral cavity | OSCC | response to topologically incorrect protein | 117/7305 | 159/18723 | 6.93e-19 | 8.60e-17 | 117 |
| Page: 1 2 3 |
| Pathway ID | Tissue | Disease Stage | Description | Gene Ratio | Bg Ratio | pvalue | p.adjust | qvalue | Count |
| Page: 1 |
Top |
Cell-cell communication analysis |
| Identification of potential cell-cell interactions between two cell types and their ligand-receptor pairs for different disease states |
| Ligand | Receptor | LRpair | Pathway | Tissue | Disease Stage |
| Page: 1 |
Top |
Single-cell gene regulatory network inference analysis |
| Find out the significant the regulons (TFs) and the target genes of each regulon across cell types for different disease states |
| TF | Cell Type | Tissue | Disease Stage | Target Gene | RSS | Regulon Activity |
| ∗The dot plots of a searched regulon are shown for all cell subpopulations in each disease state of each tissue based on the regulon specific score inferred using pySCENIC and by calculating the average expression. |
| Page: 1 |
Top |
Somatic mutation of malignant transformation related genes |
| Annotation of somatic variants for genes involved in malignant transformation |
| Hugo Symbol | Variant Class | Variant Classification | dbSNP RS | HGVSc | HGVSp | HGVSp Short | SWISSPROT | BIOTYPE | SIFT | PolyPhen | Tumor Sample Barcode | Tissue | Histology | Sex | Age | Stage | Therapy Types | Drugs | Outcome |
| ERP44 | SNV | Missense_Mutation | c.1036N>G | p.Gln346Glu | p.Q346E | Q9BS26 | protein_coding | tolerated(0.12) | possibly_damaging(0.678) | TCGA-A2-A0CL-01 | Breast | breast invasive carcinoma | Female | <65 | III/IV | Chemotherapy | cytoxan | SD | |
| ERP44 | insertion | Frame_Shift_Ins | novel | c.683_684insTATCTCTTTCTCCC | p.Asn229IlefsTer9 | p.N229Ifs*9 | Q9BS26 | protein_coding | TCGA-BH-A0B8-01 | Breast | breast invasive carcinoma | Female | <65 | I/II | Hormone Therapy | arimidex | SD | ||
| ERP44 | SNV | Missense_Mutation | c.494N>C | p.Gly165Ala | p.G165A | Q9BS26 | protein_coding | tolerated(0.22) | benign(0.103) | TCGA-DS-A0VM-01 | Cervix | cervical & endocervical cancer | Female | <65 | I/II | Chemotherapy | cisplatin | PD | |
| ERP44 | SNV | Missense_Mutation | novel | c.677N>G | p.Ala226Gly | p.A226G | Q9BS26 | protein_coding | tolerated(0.11) | benign(0) | TCGA-VS-A9U7-01 | Cervix | cervical & endocervical cancer | Female | <65 | I/II | Chemotherapy | cisplatin | CR |
| ERP44 | SNV | Missense_Mutation | novel | c.766N>G | p.Leu256Val | p.L256V | Q9BS26 | protein_coding | deleterious(0) | probably_damaging(0.971) | TCGA-AA-3492-01 | Colorectum | colon adenocarcinoma | Female | >=65 | I/II | Unknown | Unknown | SD |
| ERP44 | SNV | Missense_Mutation | c.340C>T | p.Arg114Cys | p.R114C | Q9BS26 | protein_coding | deleterious(0) | probably_damaging(0.967) | TCGA-AA-3950-01 | Colorectum | colon adenocarcinoma | Female | >=65 | I/II | Unknown | Unknown | SD | |
| ERP44 | SNV | Missense_Mutation | rs776153086 | c.442C>T | p.Arg148Trp | p.R148W | Q9BS26 | protein_coding | tolerated(0.05) | benign(0.031) | TCGA-AD-5900-01 | Colorectum | colon adenocarcinoma | Male | >=65 | I/II | Unknown | Unknown | SD |
| ERP44 | SNV | Missense_Mutation | novel | c.1159N>A | p.Phe387Ile | p.F387I | Q9BS26 | protein_coding | deleterious(0) | probably_damaging(1) | TCGA-AG-3893-01 | Colorectum | rectum adenocarcinoma | Male | >=65 | III/IV | Chemotherapy | folinic | CR |
| ERP44 | SNV | Missense_Mutation | rs746106972 | c.1208N>A | p.Arg403Gln | p.R403Q | Q9BS26 | protein_coding | deleterious(0.01) | benign(0.124) | TCGA-A5-A0G2-01 | Endometrium | uterine corpus endometrioid carcinoma | Female | <65 | III/IV | Unknown | Unknown | SD |
| ERP44 | SNV | Missense_Mutation | rs140677553 | c.602N>T | p.Pro201Leu | p.P201L | Q9BS26 | protein_coding | deleterious(0.02) | benign(0.067) | TCGA-A5-A0G2-01 | Endometrium | uterine corpus endometrioid carcinoma | Female | <65 | III/IV | Unknown | Unknown | SD |
| Page: 1 2 3 4 5 |
Top |
Related drugs of malignant transformation related genes |
| Identification of chemicals and drugs interact with genes involved in malignant transfromation |
| (DGIdb 4.0) |
| Entrez ID | Symbol | Category | Interaction Types | Drug Claim Name | Drug Name | PMIDs |
| Page: 1 |

Copyright 2023-Present -The University of Texas Health Science Center at Houston |