
|
|||||
|
 | |
| |
| |
| |
| |
| |
|
Gene: ERO1B |
Gene summary for ERO1B |
| Gene information | Species | Human | Gene symbol | ERO1B | Gene ID | 56605 |
| Gene name | endoplasmic reticulum oxidoreductase 1 beta | |
| Gene Alias | ERO1LB | |
| Cytomap | 1q42.3 | |
| Gene Type | protein-coding | GO ID | GO:0006457 | UniProtAcc | Q86YB8 |
Top |
Malignant transformation analysis |
| Identification of the aberrant gene expression in precancerous and cancerous lesions by comparing the gene expression of stem-like cells in diseased tissues with normal stem cells |
| Entrez ID | Symbol | Replicates | Species | Organ | Tissue | Adj P-value | Log2FC | Malignancy |
| 56605 | ERO1B | LZE4T | Human | Esophagus | ESCC | 5.46e-04 | 1.40e-01 | 0.0811 |
| 56605 | ERO1B | LZE7T | Human | Esophagus | ESCC | 5.17e-06 | 2.35e-01 | 0.0667 |
| 56605 | ERO1B | LZE8T | Human | Esophagus | ESCC | 2.01e-06 | 1.83e-01 | 0.067 |
| 56605 | ERO1B | LZE24T | Human | Esophagus | ESCC | 4.59e-19 | 5.00e-01 | 0.0596 |
| 56605 | ERO1B | LZE6T | Human | Esophagus | ESCC | 4.46e-02 | 1.37e-01 | 0.0845 |
| 56605 | ERO1B | P1T-E | Human | Esophagus | ESCC | 8.89e-13 | 7.43e-01 | 0.0875 |
| 56605 | ERO1B | P2T-E | Human | Esophagus | ESCC | 8.11e-27 | 5.06e-01 | 0.1177 |
| 56605 | ERO1B | P4T-E | Human | Esophagus | ESCC | 2.42e-05 | 1.33e-01 | 0.1323 |
| 56605 | ERO1B | P8T-E | Human | Esophagus | ESCC | 2.37e-13 | 2.83e-01 | 0.0889 |
| 56605 | ERO1B | P10T-E | Human | Esophagus | ESCC | 7.20e-18 | 4.35e-01 | 0.116 |
| 56605 | ERO1B | P11T-E | Human | Esophagus | ESCC | 2.48e-09 | 5.59e-01 | 0.1426 |
| 56605 | ERO1B | P12T-E | Human | Esophagus | ESCC | 2.27e-06 | 6.93e-02 | 0.1122 |
| 56605 | ERO1B | P15T-E | Human | Esophagus | ESCC | 4.65e-13 | 2.28e-01 | 0.1149 |
| 56605 | ERO1B | P16T-E | Human | Esophagus | ESCC | 1.14e-16 | 2.38e-01 | 0.1153 |
| 56605 | ERO1B | P20T-E | Human | Esophagus | ESCC | 6.08e-06 | 6.39e-02 | 0.1124 |
| 56605 | ERO1B | P22T-E | Human | Esophagus | ESCC | 7.49e-12 | 2.01e-01 | 0.1236 |
| 56605 | ERO1B | P23T-E | Human | Esophagus | ESCC | 7.60e-15 | 3.12e-01 | 0.108 |
| 56605 | ERO1B | P24T-E | Human | Esophagus | ESCC | 3.99e-02 | 3.36e-02 | 0.1287 |
| 56605 | ERO1B | P26T-E | Human | Esophagus | ESCC | 5.67e-13 | 2.33e-01 | 0.1276 |
| 56605 | ERO1B | P27T-E | Human | Esophagus | ESCC | 1.24e-14 | 2.49e-01 | 0.1055 |
| Page: 1 2 3 4 5 |
| Tissue | Expression Dynamics | Abbreviation |
| Esophagus |  | ESCC: Esophageal squamous cell carcinoma |
| HGIN: High-grade intraepithelial neoplasias | ||
| LGIN: Low-grade intraepithelial neoplasias | ||
| Liver | 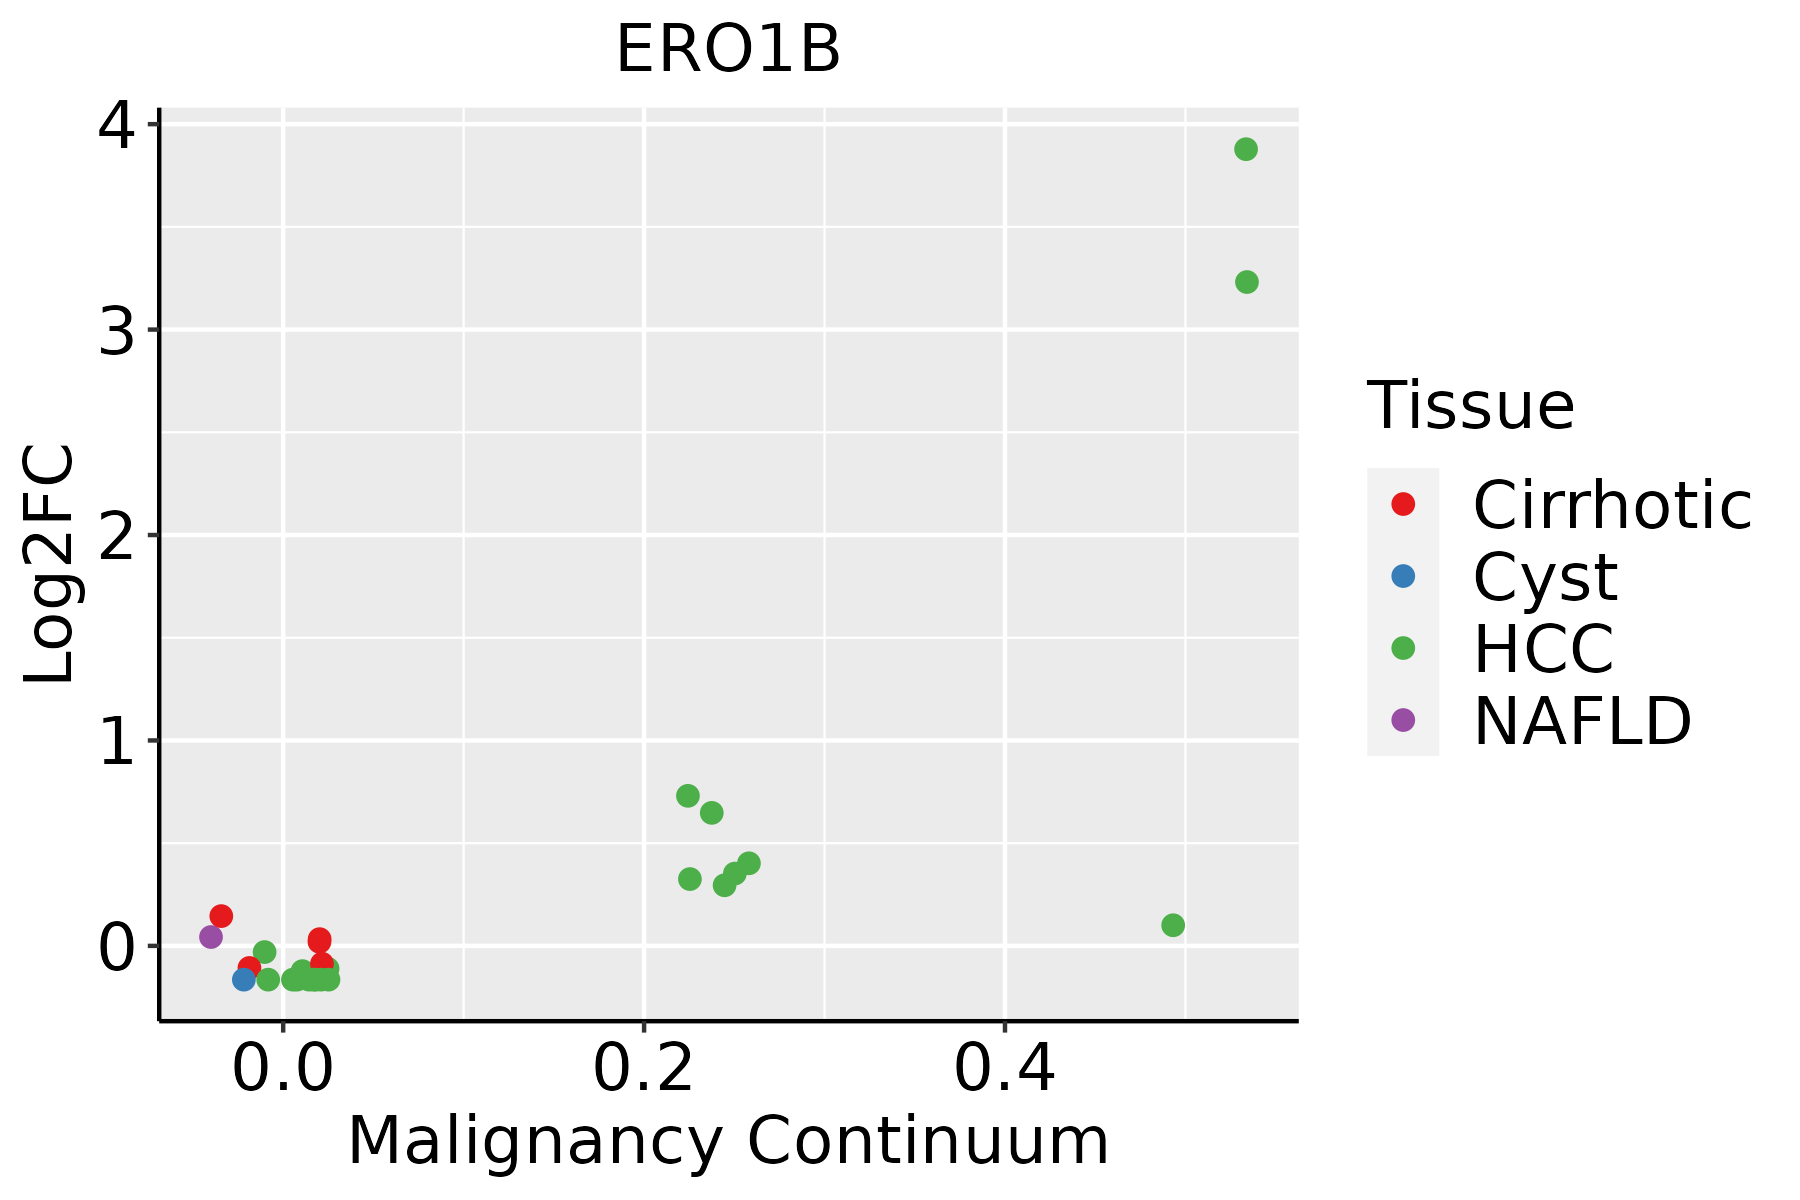 | HCC: Hepatocellular carcinoma |
| NAFLD: Non-alcoholic fatty liver disease | ||
| Prostate | 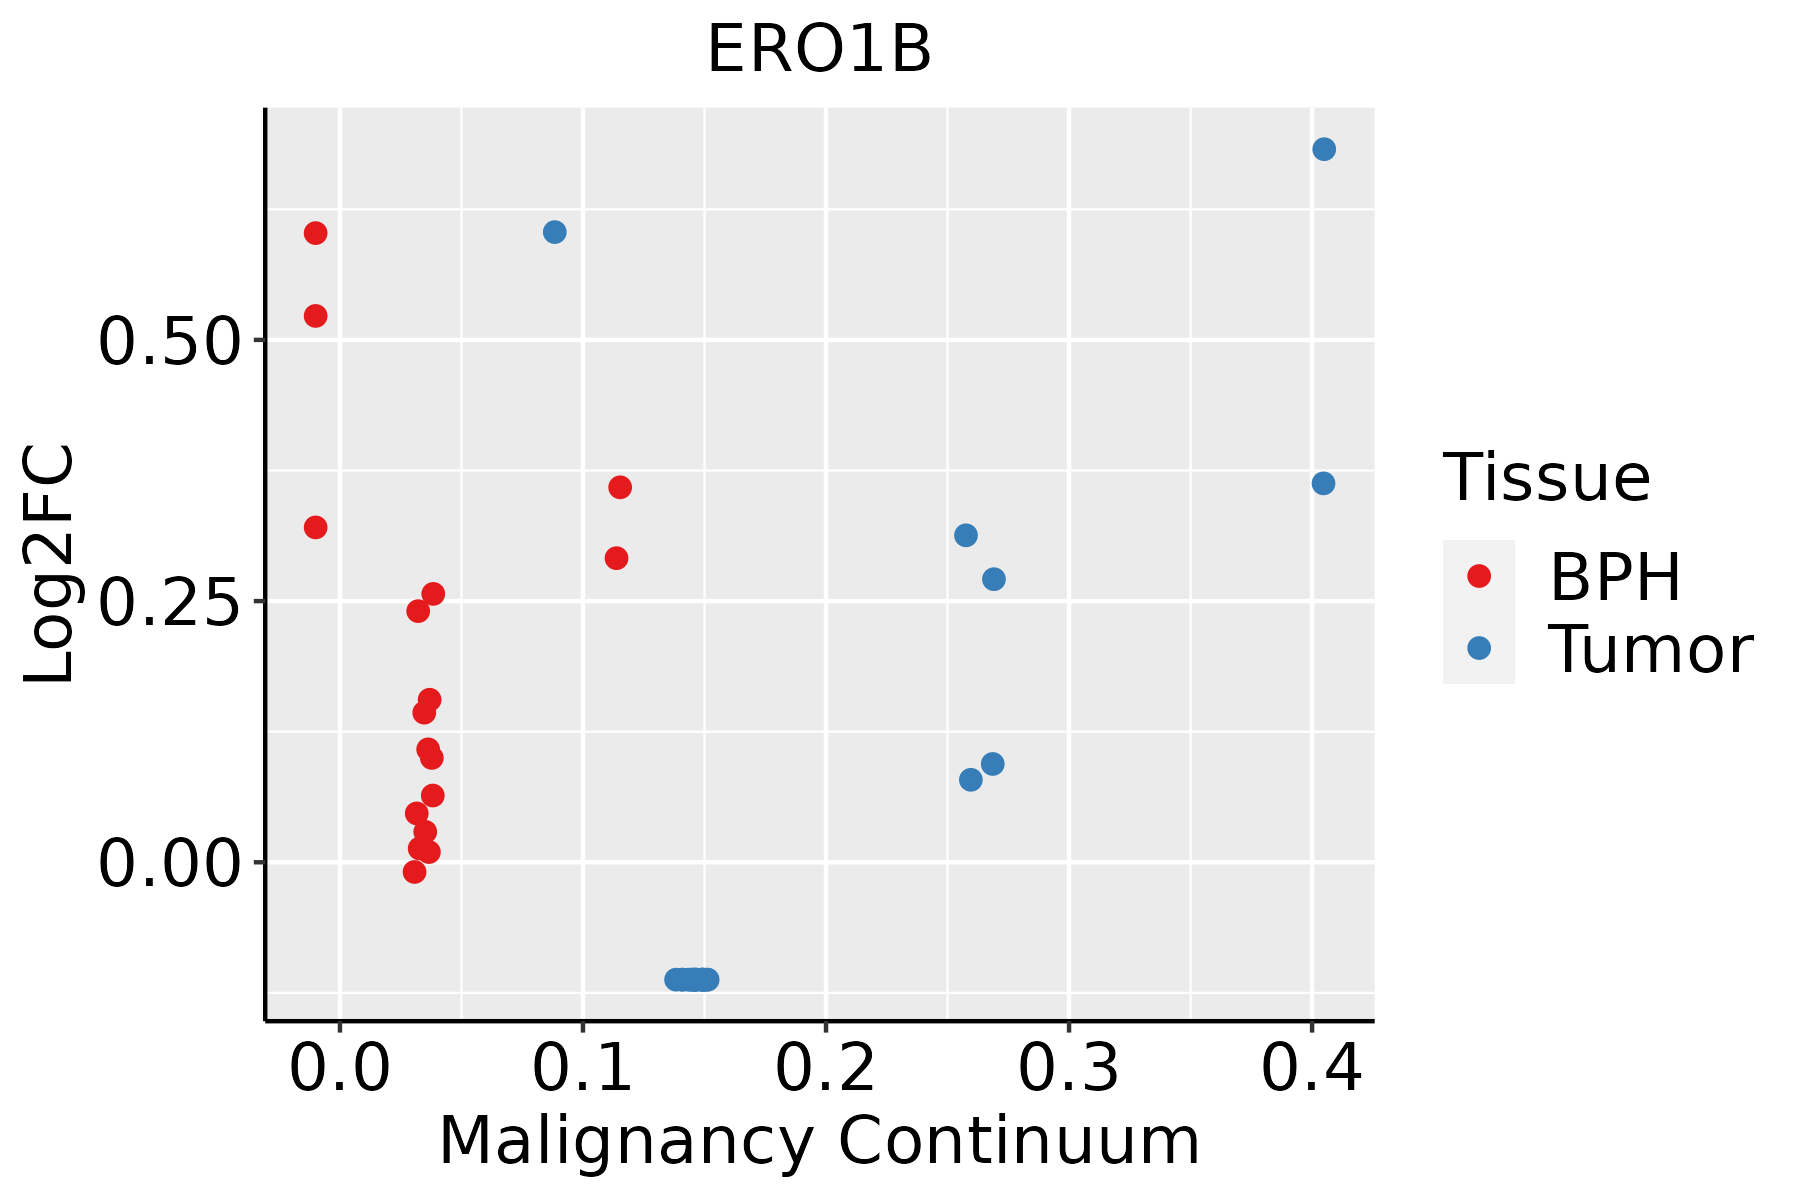 | BPH: Benign Prostatic Hyperplasia |
| Thyroid |  | ATC: Anaplastic thyroid cancer |
| HT: Hashimoto's thyroiditis | ||
| PTC: Papillary thyroid cancer |
| ∗log2FC in expression of this searched gene in stem-like cells from each diseased tissue sample relative to stem-like cells in normal samples in each tissue plotted against the malignancy continuum. Samples are colored based on if they are from different disease stage. |
Top |
Malignant transformation related pathway analysis |
| Find out the enriched GO biological processes and KEGG pathways involved in transition from healthy to precancer to cancer |
| Tissue | Disease Stage | Enriched GO biological Processes |
| Colorectum | AD |  |
| Colorectum | SER |  |
| Colorectum | MSS |  |
| Colorectum | MSI-H |  |
| Colorectum | FAP |  |
| ∗Top 15 enriched GO BP terms are showed in the bar plot of each disease state in each tissue. Each row represents a significant GO biological process which is colored according to the -log10(p.adjust). |
| Page: 1 2 3 4 5 6 7 8 9 |
| GO ID | Tissue | Disease Stage | Description | Gene Ratio | Bg Ratio | pvalue | p.adjust | Count |
| GO:0006457110 | Esophagus | ESCC | protein folding | 163/8552 | 212/18723 | 1.13e-20 | 1.74e-18 | 163 |
| GO:003497520 | Esophagus | ESCC | protein folding in endoplasmic reticulum | 10/8552 | 11/18723 | 2.54e-03 | 1.08e-02 | 10 |
| GO:000645712 | Liver | HCC | protein folding | 160/7958 | 212/18723 | 1.07e-22 | 1.88e-20 | 160 |
| GO:003497512 | Liver | HCC | protein folding in endoplasmic reticulum | 10/7958 | 11/18723 | 1.30e-03 | 7.01e-03 | 10 |
| GO:000645716 | Prostate | BPH | protein folding | 85/3107 | 212/18723 | 2.37e-16 | 4.74e-14 | 85 |
| GO:003497516 | Prostate | BPH | protein folding in endoplasmic reticulum | 9/3107 | 11/18723 | 3.77e-06 | 5.81e-05 | 9 |
| GO:000645717 | Prostate | Tumor | protein folding | 85/3246 | 212/18723 | 3.37e-15 | 5.37e-13 | 85 |
| GO:003497517 | Prostate | Tumor | protein folding in endoplasmic reticulum | 9/3246 | 11/18723 | 5.50e-06 | 8.48e-05 | 9 |
| GO:000645727 | Thyroid | HT | protein folding | 45/1272 | 212/18723 | 5.29e-12 | 1.01e-09 | 45 |
| GO:003497526 | Thyroid | HT | protein folding in endoplasmic reticulum | 7/1272 | 11/18723 | 1.70e-06 | 6.40e-05 | 7 |
| GO:0006457112 | Thyroid | PTC | protein folding | 137/5968 | 212/18723 | 8.29e-23 | 2.01e-20 | 137 |
| GO:0034975110 | Thyroid | PTC | protein folding in endoplasmic reticulum | 10/5968 | 11/18723 | 8.42e-05 | 7.03e-04 | 10 |
| GO:000645733 | Thyroid | ATC | protein folding | 140/6293 | 212/18723 | 3.46e-22 | 8.09e-20 | 140 |
| GO:003497532 | Thyroid | ATC | protein folding in endoplasmic reticulum | 10/6293 | 11/18723 | 1.40e-04 | 9.75e-04 | 10 |
| Page: 1 |
| Pathway ID | Tissue | Disease Stage | Description | Gene Ratio | Bg Ratio | pvalue | p.adjust | qvalue | Count |
| hsa04141211 | Esophagus | ESCC | Protein processing in endoplasmic reticulum | 147/4205 | 174/8465 | 3.29e-22 | 1.10e-19 | 5.64e-20 | 147 |
| hsa04141310 | Esophagus | ESCC | Protein processing in endoplasmic reticulum | 147/4205 | 174/8465 | 3.29e-22 | 1.10e-19 | 5.64e-20 | 147 |
| hsa0414122 | Liver | HCC | Protein processing in endoplasmic reticulum | 146/4020 | 174/8465 | 7.34e-24 | 2.46e-21 | 1.37e-21 | 146 |
| hsa0414132 | Liver | HCC | Protein processing in endoplasmic reticulum | 146/4020 | 174/8465 | 7.34e-24 | 2.46e-21 | 1.37e-21 | 146 |
| hsa0414128 | Prostate | BPH | Protein processing in endoplasmic reticulum | 97/1718 | 174/8465 | 2.37e-25 | 1.30e-23 | 8.07e-24 | 97 |
| hsa04141112 | Prostate | BPH | Protein processing in endoplasmic reticulum | 97/1718 | 174/8465 | 2.37e-25 | 1.30e-23 | 8.07e-24 | 97 |
| hsa0414129 | Prostate | Tumor | Protein processing in endoplasmic reticulum | 99/1791 | 174/8465 | 2.58e-25 | 1.71e-23 | 1.06e-23 | 99 |
| hsa0414137 | Prostate | Tumor | Protein processing in endoplasmic reticulum | 99/1791 | 174/8465 | 2.58e-25 | 1.71e-23 | 1.06e-23 | 99 |
| Page: 1 |
Top |
Cell-cell communication analysis |
| Identification of potential cell-cell interactions between two cell types and their ligand-receptor pairs for different disease states |
| Ligand | Receptor | LRpair | Pathway | Tissue | Disease Stage |
| Page: 1 |
Top |
Single-cell gene regulatory network inference analysis |
| Find out the significant the regulons (TFs) and the target genes of each regulon across cell types for different disease states |
| TF | Cell Type | Tissue | Disease Stage | Target Gene | RSS | Regulon Activity |
| ∗The dot plots of a searched regulon are shown for all cell subpopulations in each disease state of each tissue based on the regulon specific score inferred using pySCENIC and by calculating the average expression. |
| Page: 1 |
Top |
Somatic mutation of malignant transformation related genes |
| Annotation of somatic variants for genes involved in malignant transformation |
| Hugo Symbol | Variant Class | Variant Classification | dbSNP RS | HGVSc | HGVSp | HGVSp Short | SWISSPROT | BIOTYPE | SIFT | PolyPhen | Tumor Sample Barcode | Tissue | Histology | Sex | Age | Stage | Therapy Types | Drugs | Outcome |
| ERO1B | SNV | Missense_Mutation | novel | c.737T>G | p.Phe246Cys | p.F246C | Q86YB8 | protein_coding | deleterious(0) | probably_damaging(1) | TCGA-AN-A0FX-01 | Breast | breast invasive carcinoma | Female | <65 | I/II | Unknown | Unknown | SD |
| ERO1B | SNV | Missense_Mutation | c.1055N>T | p.Ser352Phe | p.S352F | Q86YB8 | protein_coding | deleterious(0) | possibly_damaging(0.702) | TCGA-AR-A24U-01 | Breast | breast invasive carcinoma | Female | <65 | I/II | Chemotherapy | doxorubicin | SD | |
| ERO1B | insertion | Frame_Shift_Ins | novel | c.591_592insAAAATATTCCAGGTTGGAAACAGTAATGTTCAGAGAGGATT | p.Val198LysfsTer34 | p.V198Kfs*34 | Q86YB8 | protein_coding | TCGA-A8-A08H-01 | Breast | breast invasive carcinoma | Female | >=65 | I/II | Unknown | Unknown | SD | ||
| ERO1B | insertion | Frame_Shift_Ins | novel | c.735_736insAAGCTCCTGGCCTCAAGTGA | p.Phe246LysfsTer70 | p.F246Kfs*70 | Q86YB8 | protein_coding | TCGA-AN-A0FX-01 | Breast | breast invasive carcinoma | Female | <65 | I/II | Unknown | Unknown | SD | ||
| ERO1B | SNV | Missense_Mutation | rs772121664 | c.857G>A | p.Arg286His | p.R286H | Q86YB8 | protein_coding | deleterious(0) | probably_damaging(0.999) | TCGA-A6-5661-01 | Colorectum | colon adenocarcinoma | Female | >=65 | I/II | Unknown | Unknown | SD |
| ERO1B | SNV | Missense_Mutation | novel | c.192N>T | p.Leu64Phe | p.L64F | Q86YB8 | protein_coding | deleterious(0) | probably_damaging(0.998) | TCGA-AA-3492-01 | Colorectum | colon adenocarcinoma | Female | >=65 | I/II | Unknown | Unknown | SD |
| ERO1B | SNV | Missense_Mutation | novel | c.188N>C | p.Lys63Thr | p.K63T | Q86YB8 | protein_coding | tolerated(0.15) | benign(0.042) | TCGA-AA-3984-01 | Colorectum | colon adenocarcinoma | Female | <65 | I/II | Unknown | Unknown | SD |
| ERO1B | SNV | Missense_Mutation | rs142995196 | c.211N>T | p.Arg71Cys | p.R71C | Q86YB8 | protein_coding | deleterious(0) | probably_damaging(1) | TCGA-AA-A010-01 | Colorectum | colon adenocarcinoma | Female | <65 | I/II | Chemotherapy | folinic | CR |
| ERO1B | SNV | Missense_Mutation | c.155N>C | p.Phe52Ser | p.F52S | Q86YB8 | protein_coding | deleterious(0) | probably_damaging(0.969) | TCGA-AD-6889-01 | Colorectum | colon adenocarcinoma | Male | >=65 | I/II | Chemotherapy | xeloda | PD | |
| ERO1B | SNV | Missense_Mutation | c.1165G>A | p.Asp389Asn | p.D389N | Q86YB8 | protein_coding | deleterious(0) | probably_damaging(0.99) | TCGA-AG-A002-01 | Colorectum | rectum adenocarcinoma | Male | <65 | I/II | Unknown | Unknown | SD |
| Page: 1 2 3 4 5 6 |
Top |
Related drugs of malignant transformation related genes |
| Identification of chemicals and drugs interact with genes involved in malignant transfromation |
| (DGIdb 4.0) |
| Entrez ID | Symbol | Category | Interaction Types | Drug Claim Name | Drug Name | PMIDs |
| Page: 1 |

Copyright 2023-Present -The University of Texas Health Science Center at Houston |