| Tissue | Expression Dynamics | Abbreviation |
| Colorectum (GSE201348) |  | FAP: Familial adenomatous polyposis |
| CRC: Colorectal cancer |
| Colorectum (HTA11) | 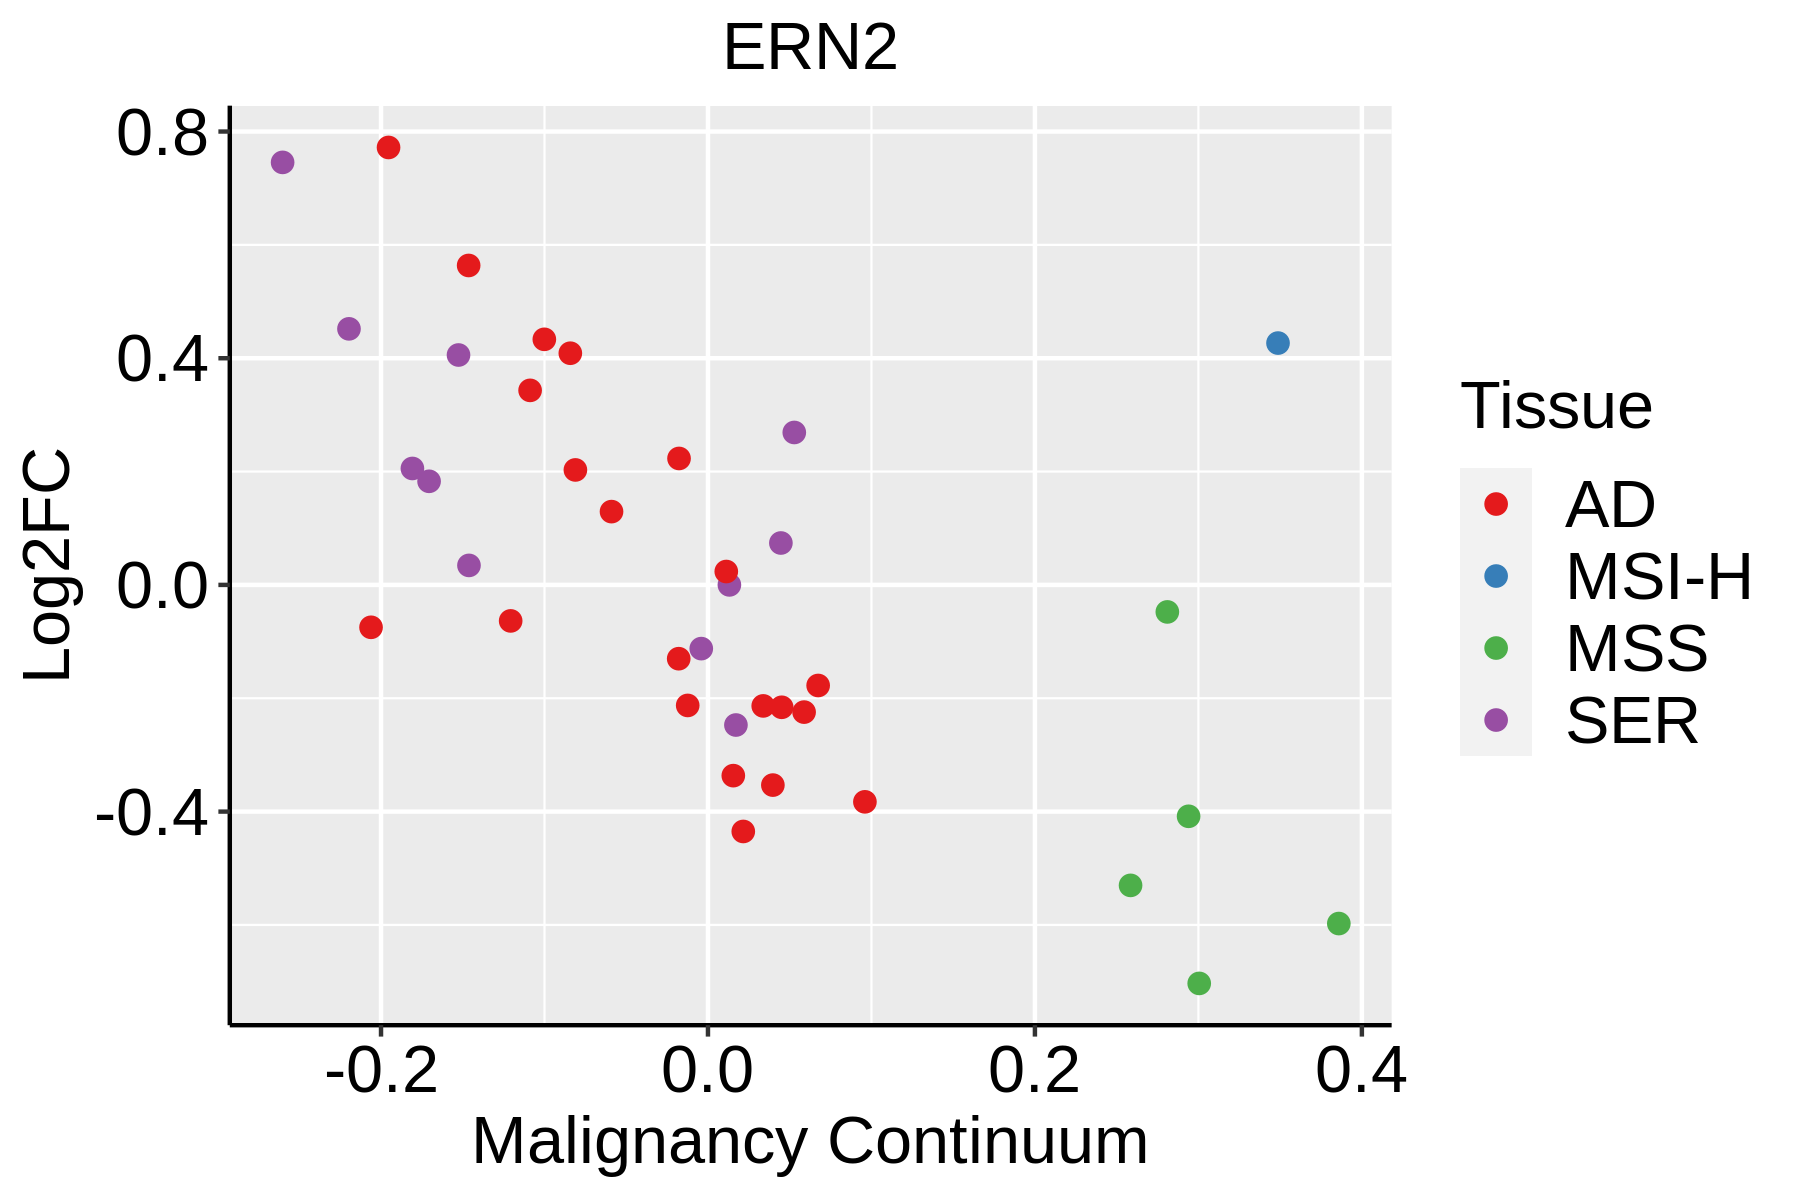 | AD: Adenomas |
| SER: Sessile serrated lesions |
| MSI-H: Microsatellite-high colorectal cancer |
| MSS: Microsatellite stable colorectal cancer |
| Esophagus | 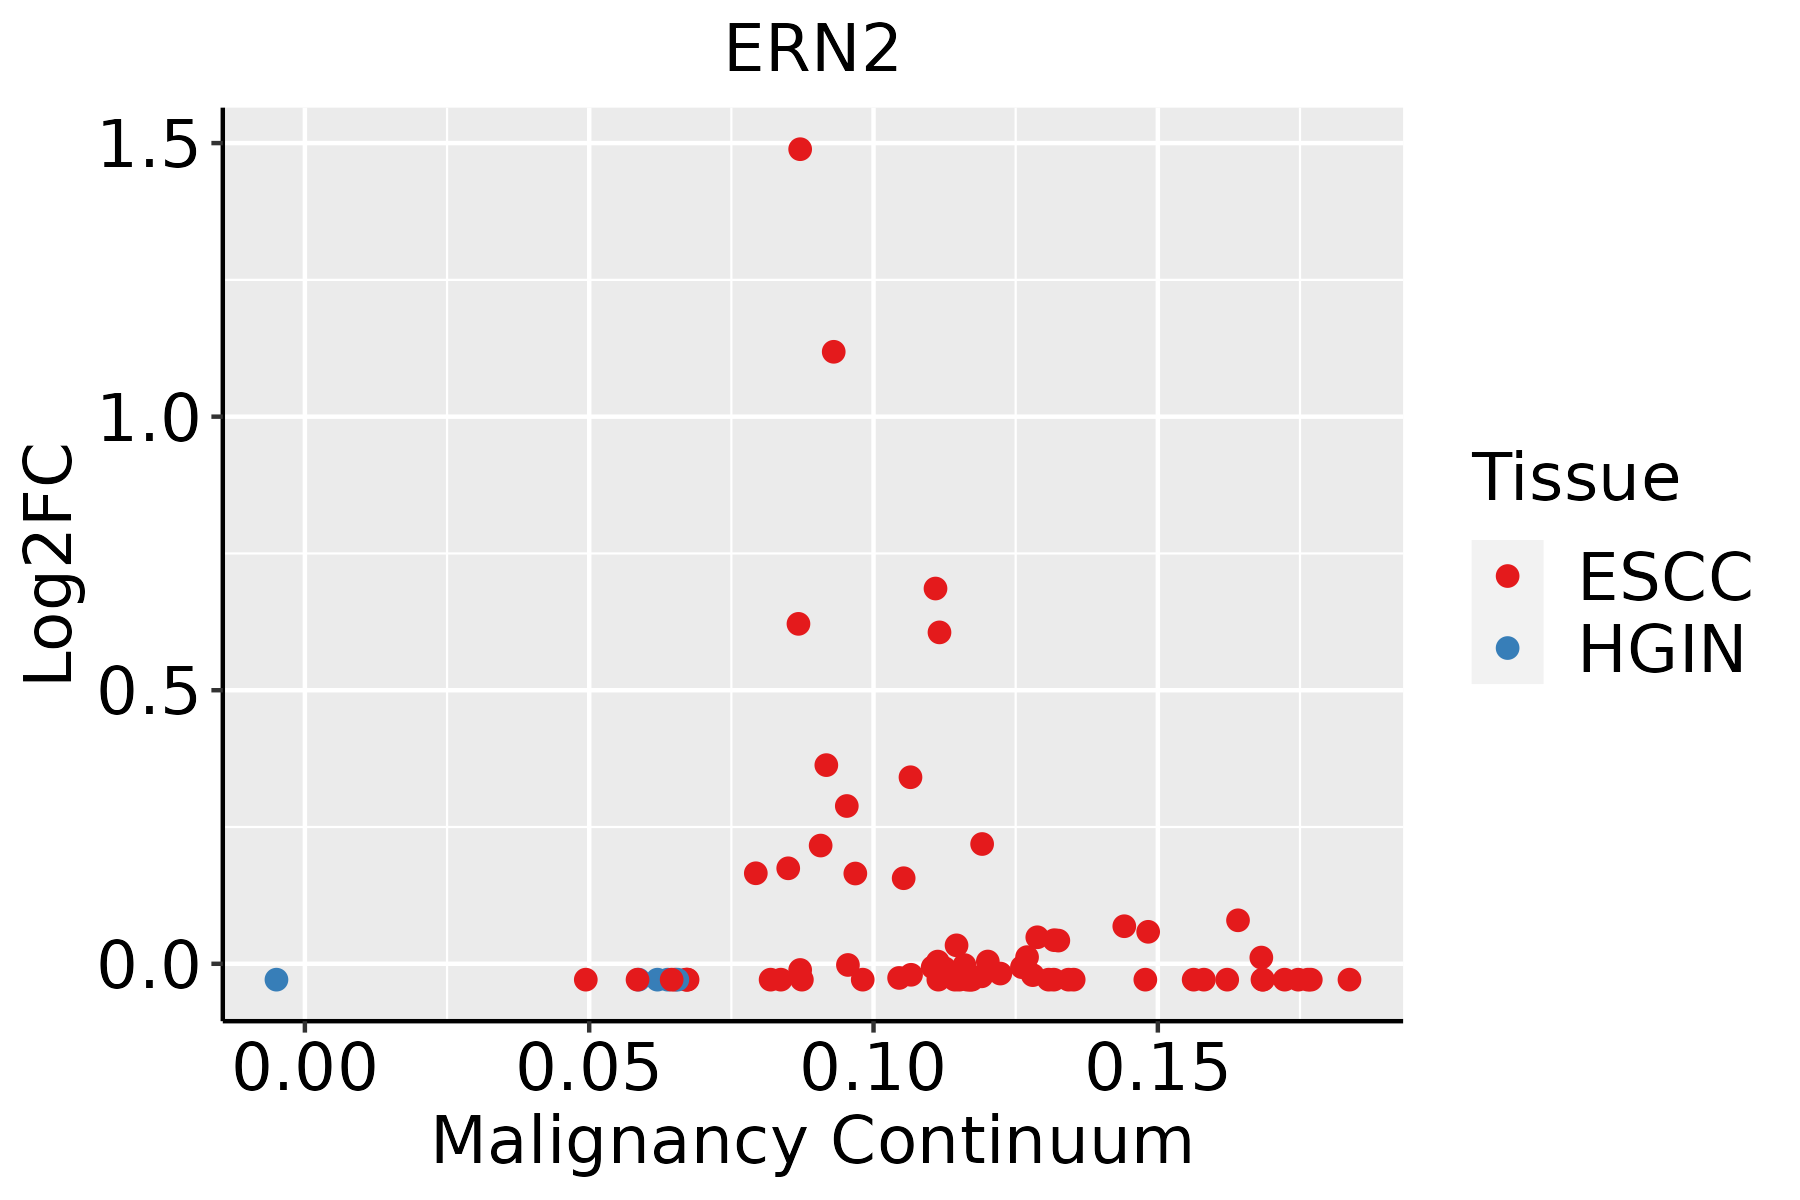 | ESCC: Esophageal squamous cell carcinoma |
| HGIN: High-grade intraepithelial neoplasias |
| LGIN: Low-grade intraepithelial neoplasias |
| Lung | 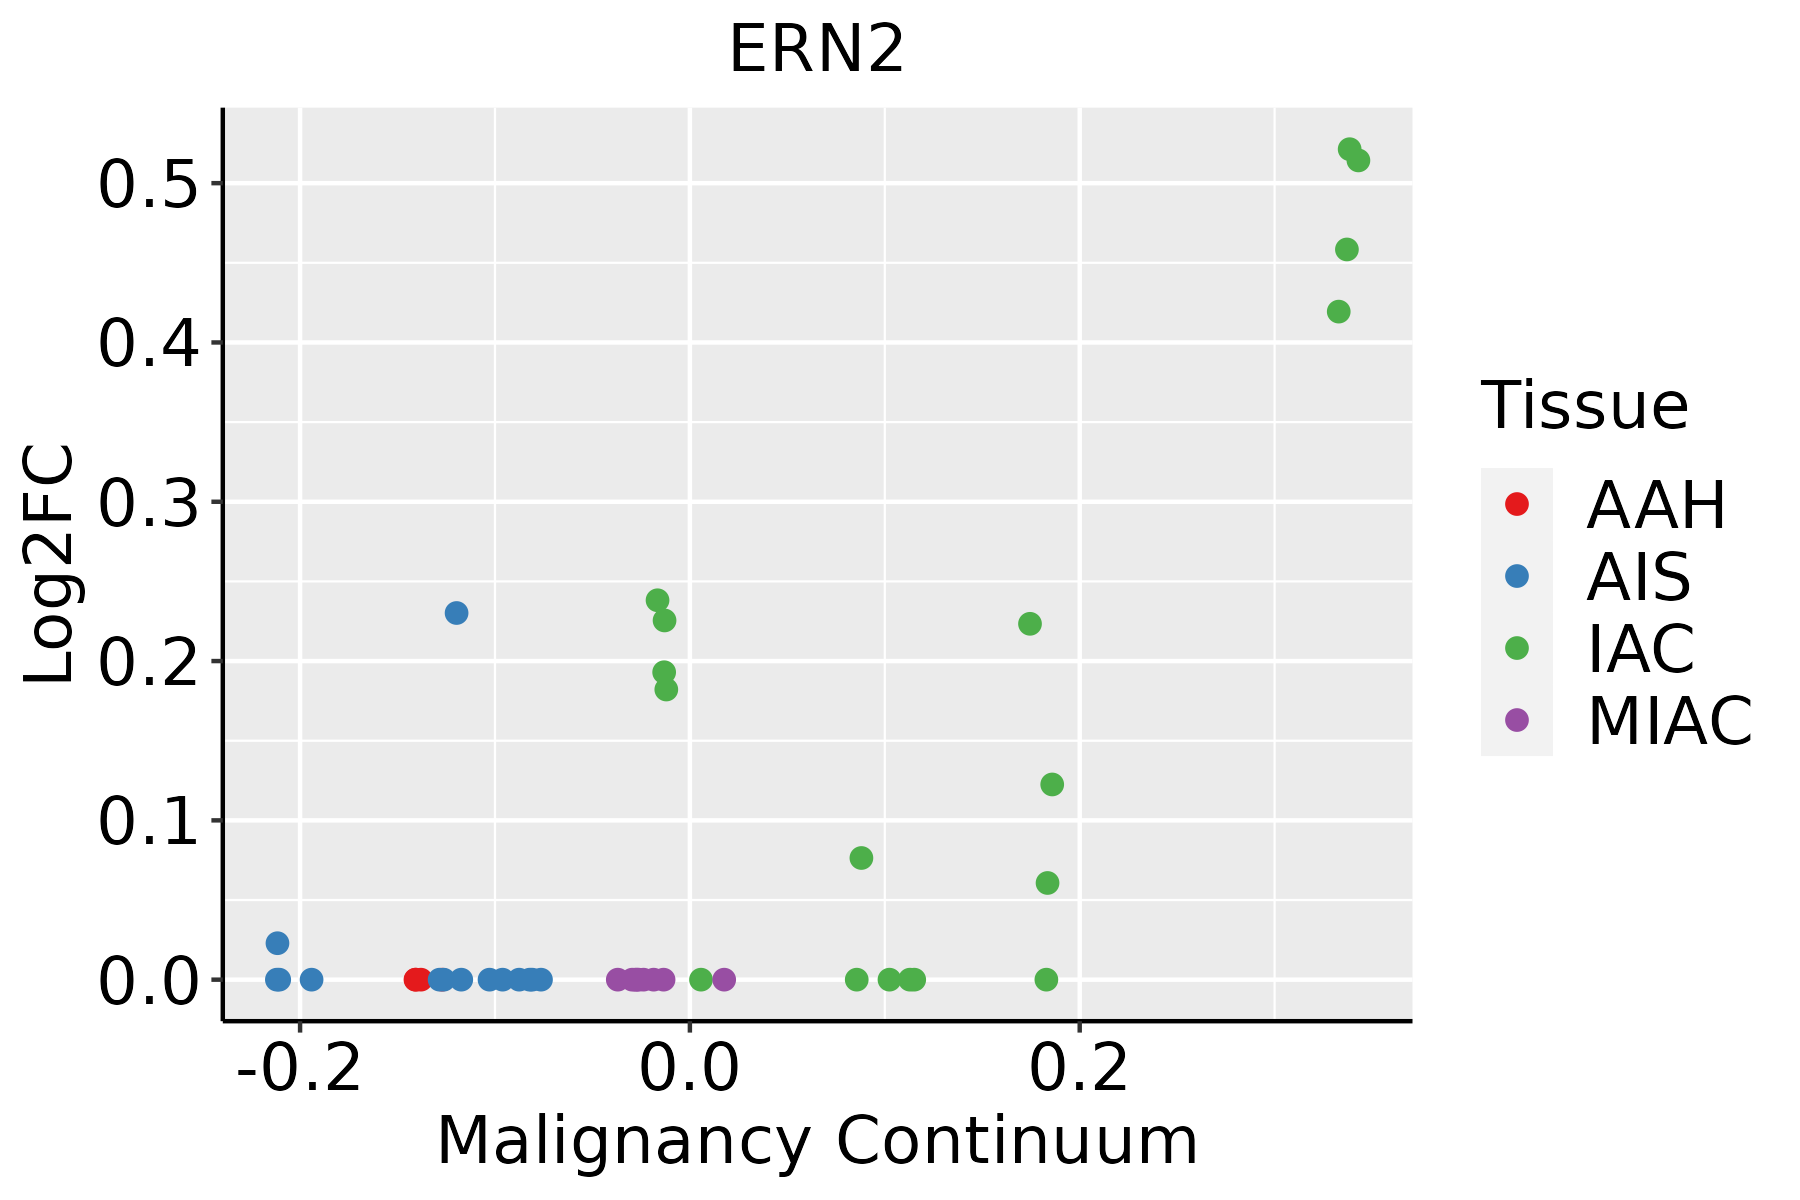 | AAH: Atypical adenomatous hyperplasia |
| AIS: Adenocarcinoma in situ |
| IAC: Invasive lung adenocarcinoma |
| MIA: Minimally invasive adenocarcinoma |
| GO ID | Tissue | Disease Stage | Description | Gene Ratio | Bg Ratio | pvalue | p.adjust | Count |
| GO:0097193 | Colorectum | AD | intrinsic apoptotic signaling pathway | 108/3918 | 288/18723 | 6.25e-11 | 6.41e-09 | 108 |
| GO:0022411 | Colorectum | AD | cellular component disassembly | 147/3918 | 443/18723 | 8.53e-10 | 6.76e-08 | 147 |
| GO:0006401 | Colorectum | AD | RNA catabolic process | 102/3918 | 278/18723 | 8.64e-10 | 6.76e-08 | 102 |
| GO:0044270 | Colorectum | AD | cellular nitrogen compound catabolic process | 147/3918 | 451/18723 | 3.35e-09 | 2.23e-07 | 147 |
| GO:0046700 | Colorectum | AD | heterocycle catabolic process | 145/3918 | 445/18723 | 4.37e-09 | 2.84e-07 | 145 |
| GO:0034655 | Colorectum | AD | nucleobase-containing compound catabolic process | 133/3918 | 407/18723 | 1.56e-08 | 9.12e-07 | 133 |
| GO:0019439 | Colorectum | AD | aromatic compound catabolic process | 146/3918 | 467/18723 | 7.48e-08 | 3.84e-06 | 146 |
| GO:1901361 | Colorectum | AD | organic cyclic compound catabolic process | 153/3918 | 495/18723 | 8.23e-08 | 4.18e-06 | 153 |
| GO:0034976 | Colorectum | AD | response to endoplasmic reticulum stress | 90/3918 | 256/18723 | 8.48e-08 | 4.28e-06 | 90 |
| GO:0070059 | Colorectum | AD | intrinsic apoptotic signaling pathway in response to endoplasmic reticulum stress | 29/3918 | 63/18723 | 7.03e-06 | 1.73e-04 | 29 |
| GO:0035966 | Colorectum | AD | response to topologically incorrect protein | 54/3918 | 159/18723 | 8.85e-05 | 1.36e-03 | 54 |
| GO:0035967 | Colorectum | AD | cellular response to topologically incorrect protein | 42/3918 | 116/18723 | 1.04e-04 | 1.56e-03 | 42 |
| GO:0033674 | Colorectum | AD | positive regulation of kinase activity | 131/3918 | 467/18723 | 1.28e-04 | 1.85e-03 | 131 |
| GO:0006986 | Colorectum | AD | response to unfolded protein | 45/3918 | 137/18723 | 7.43e-04 | 7.48e-03 | 45 |
| GO:0045860 | Colorectum | AD | positive regulation of protein kinase activity | 107/3918 | 386/18723 | 8.01e-04 | 7.92e-03 | 107 |
| GO:0034620 | Colorectum | AD | cellular response to unfolded protein | 33/3918 | 96/18723 | 1.53e-03 | 1.29e-02 | 33 |
| GO:0071900 | Colorectum | AD | regulation of protein serine/threonine kinase activity | 98/3918 | 359/18723 | 2.18e-03 | 1.73e-02 | 98 |
| GO:0071902 | Colorectum | AD | positive regulation of protein serine/threonine kinase activity | 58/3918 | 200/18723 | 4.09e-03 | 2.84e-02 | 58 |
| GO:00971931 | Colorectum | SER | intrinsic apoptotic signaling pathway | 87/2897 | 288/18723 | 1.67e-10 | 2.32e-08 | 87 |
| GO:00224111 | Colorectum | SER | cellular component disassembly | 114/2897 | 443/18723 | 1.17e-08 | 9.59e-07 | 114 |
| Hugo Symbol | Variant Class | Variant Classification | dbSNP RS | HGVSc | HGVSp | HGVSp Short | SWISSPROT | BIOTYPE | SIFT | PolyPhen | Tumor Sample Barcode | Tissue | Histology | Sex | Age | Stage | Therapy Types | Drugs | Outcome |
| ERN2 | SNV | Missense_Mutation | | c.920G>A | p.Gly307Glu | p.G307E | Q76MJ5 | protein_coding | deleterious(0) | benign(0.305) | TCGA-A8-A08J-01 | Breast | breast invasive carcinoma | Female | <65 | III/IV | Unknown | Unknown | PD |
| ERN2 | SNV | Missense_Mutation | novel | c.541A>C | p.Thr181Pro | p.T181P | Q76MJ5 | protein_coding | deleterious(0.01) | possibly_damaging(0.85) | TCGA-AC-A3W5-01 | Breast | breast invasive carcinoma | Female | >=65 | I/II | Chemotherapy | docetaxel | CR |
| ERN2 | SNV | Missense_Mutation | novel | c.424N>A | p.Glu142Lys | p.E142K | Q76MJ5 | protein_coding | tolerated(0.13) | benign(0.018) | TCGA-AC-A3W6-01 | Breast | breast invasive carcinoma | Female | >=65 | III/IV | Unknown | Unknown | SD |
| ERN2 | SNV | Missense_Mutation | novel | c.1089C>G | p.His363Gln | p.H363Q | Q76MJ5 | protein_coding | deleterious(0) | probably_damaging(0.996) | TCGA-AC-A8OQ-01 | Breast | breast invasive carcinoma | Female | >=65 | I/II | Unknown | Unknown | SD |
| ERN2 | SNV | Missense_Mutation | | c.1450N>A | p.Ser484Thr | p.S484T | Q76MJ5 | protein_coding | tolerated(0.18) | benign(0.001) | TCGA-AR-A0TS-01 | Breast | breast invasive carcinoma | Female | <65 | I/II | Chemotherapy | doxorubicin | SD |
| ERN2 | SNV | Missense_Mutation | novel | c.2068G>A | p.Glu690Lys | p.E690K | Q76MJ5 | protein_coding | deleterious(0) | probably_damaging(0.999) | TCGA-AR-A5QM-01 | Breast | breast invasive carcinoma | Female | <65 | I/II | Hormone Therapy | anastrozole | PD |
| ERN2 | SNV | Missense_Mutation | | c.1905N>A | p.His635Gln | p.H635Q | Q76MJ5 | protein_coding | deleterious(0.02) | probably_damaging(0.998) | TCGA-B6-A0I8-01 | Breast | breast invasive carcinoma | Female | <65 | I/II | Unknown | Unknown | PD |
| ERN2 | SNV | Missense_Mutation | novel | c.1037A>C | p.Tyr346Ser | p.Y346S | Q76MJ5 | protein_coding | tolerated(0.06) | benign(0.131) | TCGA-BH-A0BR-01 | Breast | breast invasive carcinoma | Female | <65 | I/II | Unknown | Unknown | SD |
| ERN2 | SNV | Missense_Mutation | | c.2434N>A | p.Glu812Lys | p.E812K | Q76MJ5 | protein_coding | deleterious(0) | probably_damaging(0.998) | TCGA-BH-A0HP-01 | Breast | breast invasive carcinoma | Female | >=65 | III/IV | Chemotherapy | doxorubicin | SD |
| ERN2 | SNV | Missense_Mutation | rs751236768 | c.2707N>C | p.Glu903Gln | p.E903Q | Q76MJ5 | protein_coding | deleterious(0.01) | possibly_damaging(0.748) | TCGA-C8-A275-01 | Breast | breast invasive carcinoma | Female | <65 | I/II | Unknown | Unknown | SD |


