| Tissue | Expression Dynamics | Abbreviation |
| Endometrium | 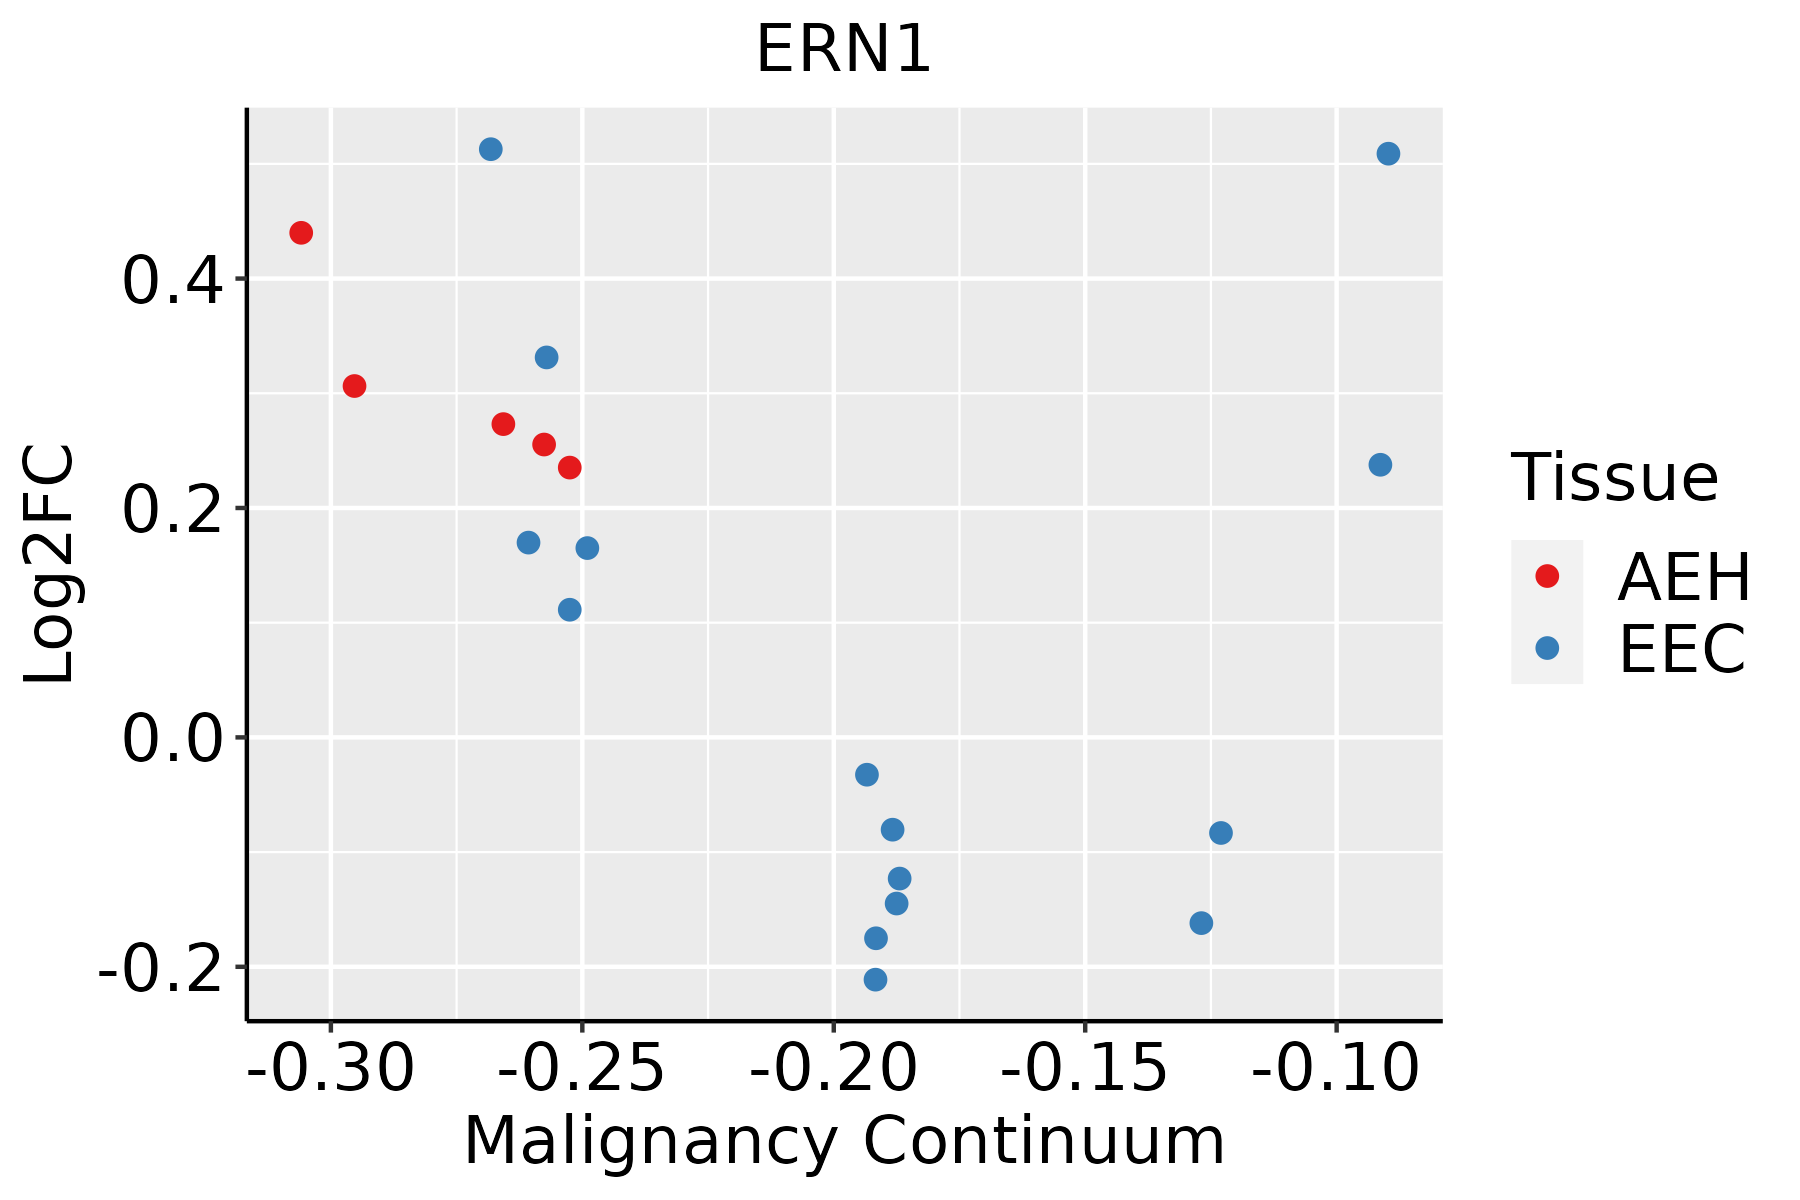 | AEH: Atypical endometrial hyperplasia |
| EEC: Endometrioid Cancer |
| Esophagus | 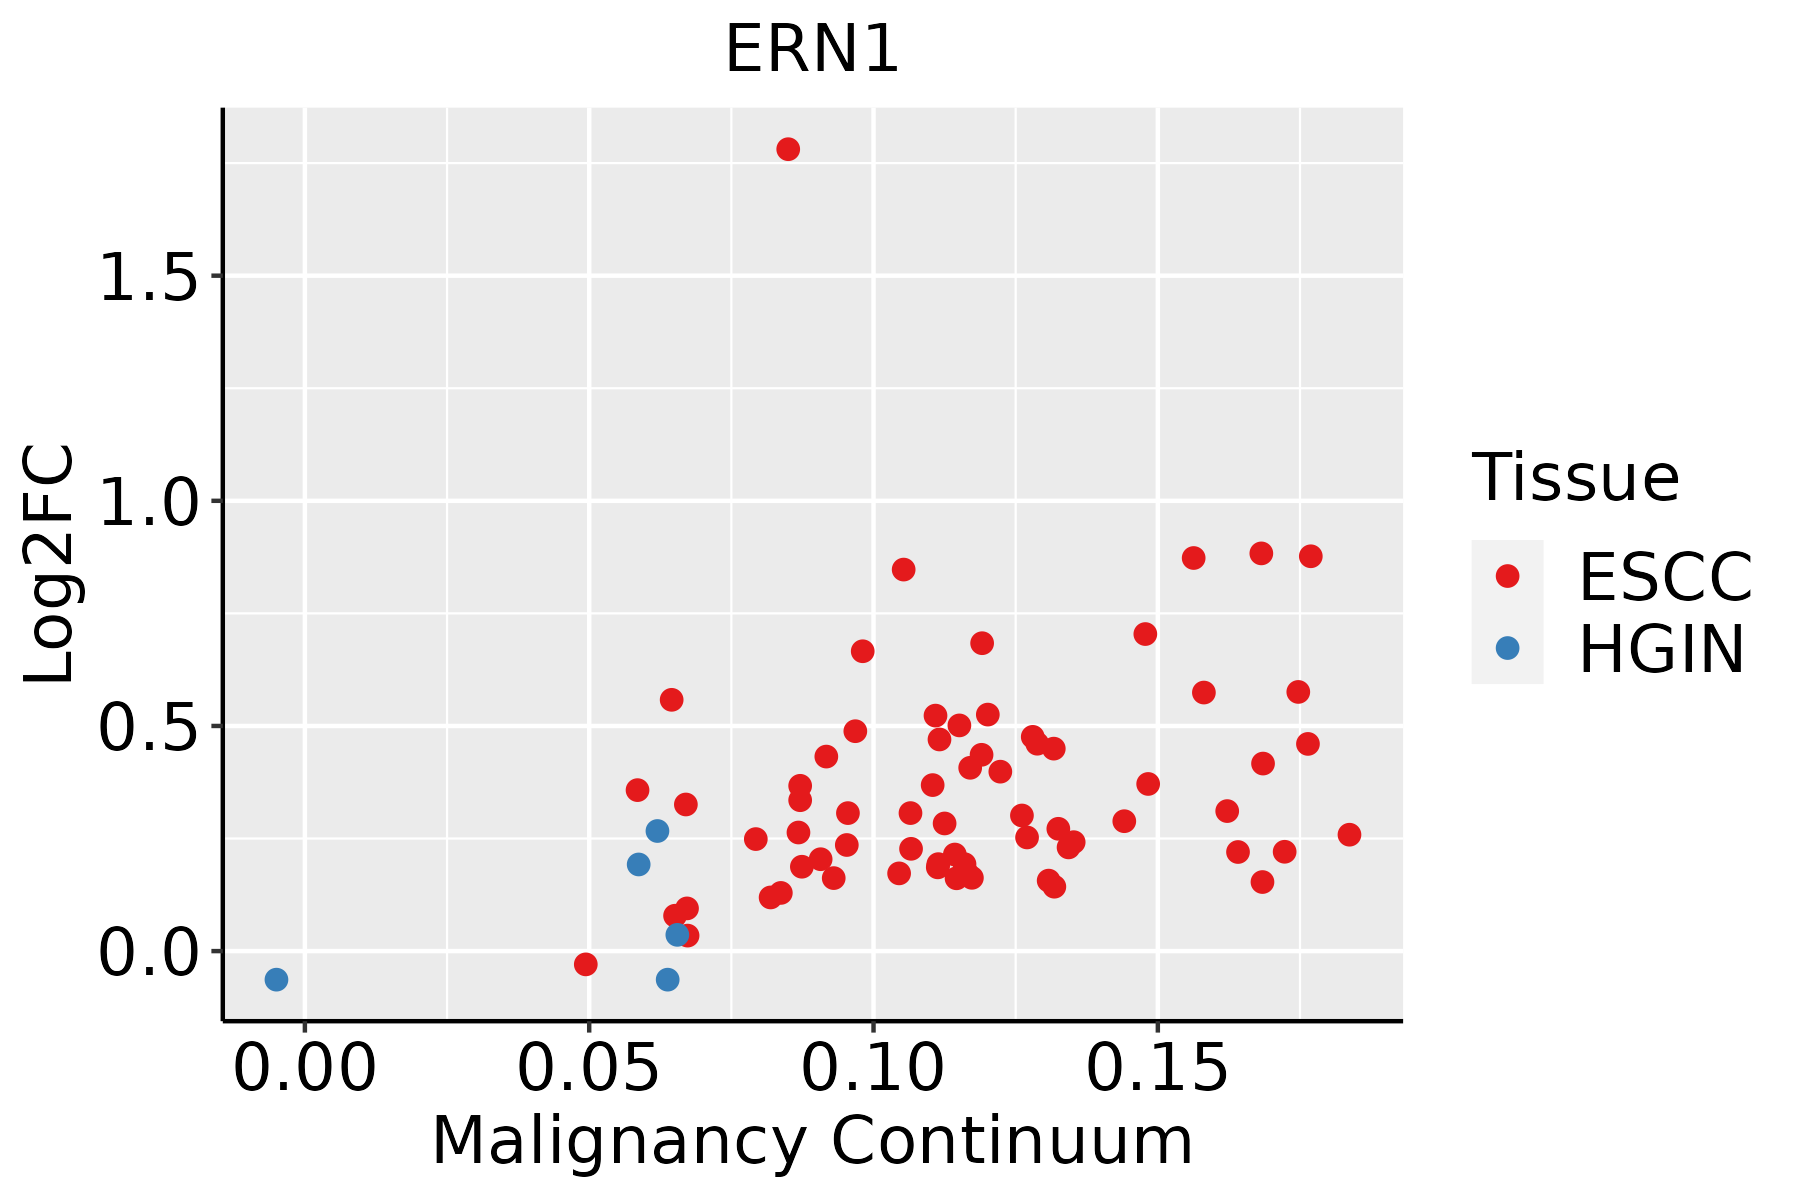 | ESCC: Esophageal squamous cell carcinoma |
| HGIN: High-grade intraepithelial neoplasias |
| LGIN: Low-grade intraepithelial neoplasias |
| Lung | 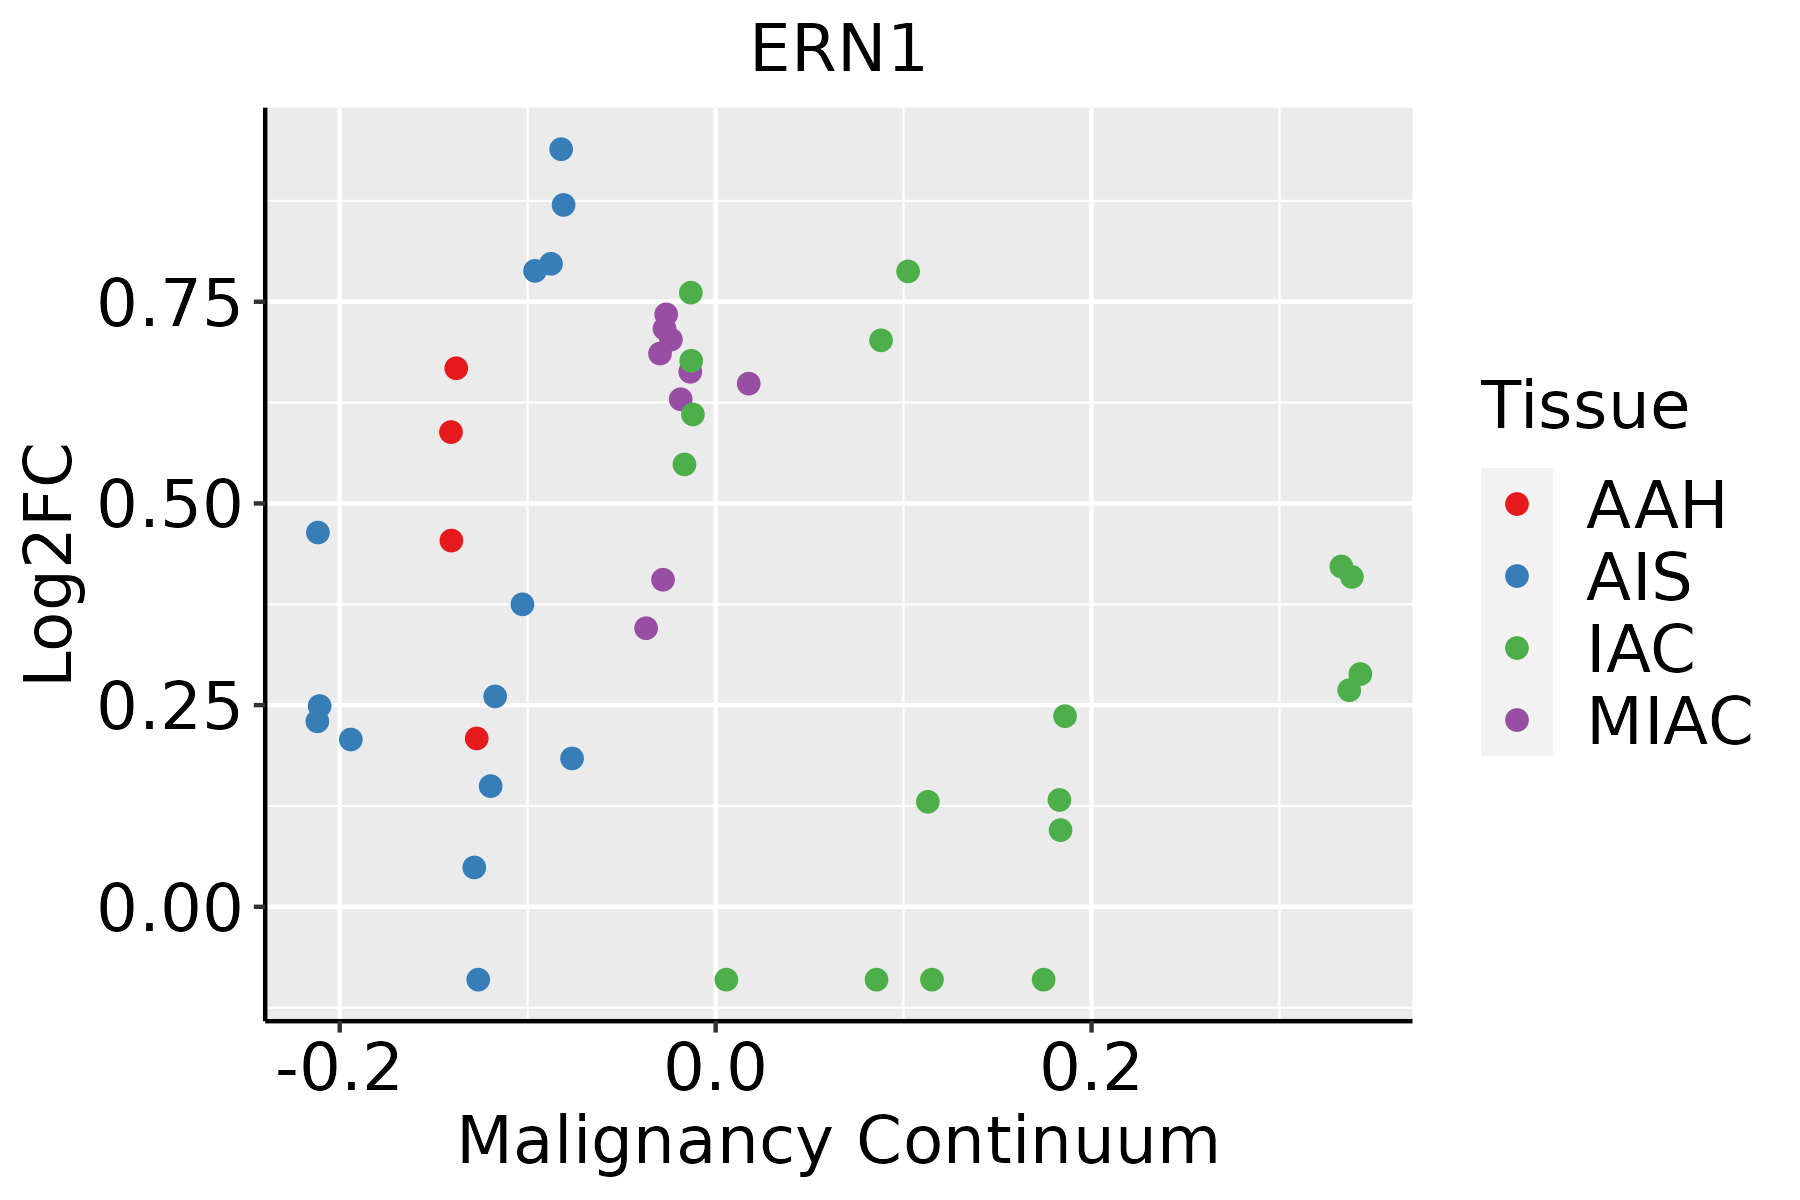 | AAH: Atypical adenomatous hyperplasia |
| AIS: Adenocarcinoma in situ |
| IAC: Invasive lung adenocarcinoma |
| MIA: Minimally invasive adenocarcinoma |
| Oral Cavity | 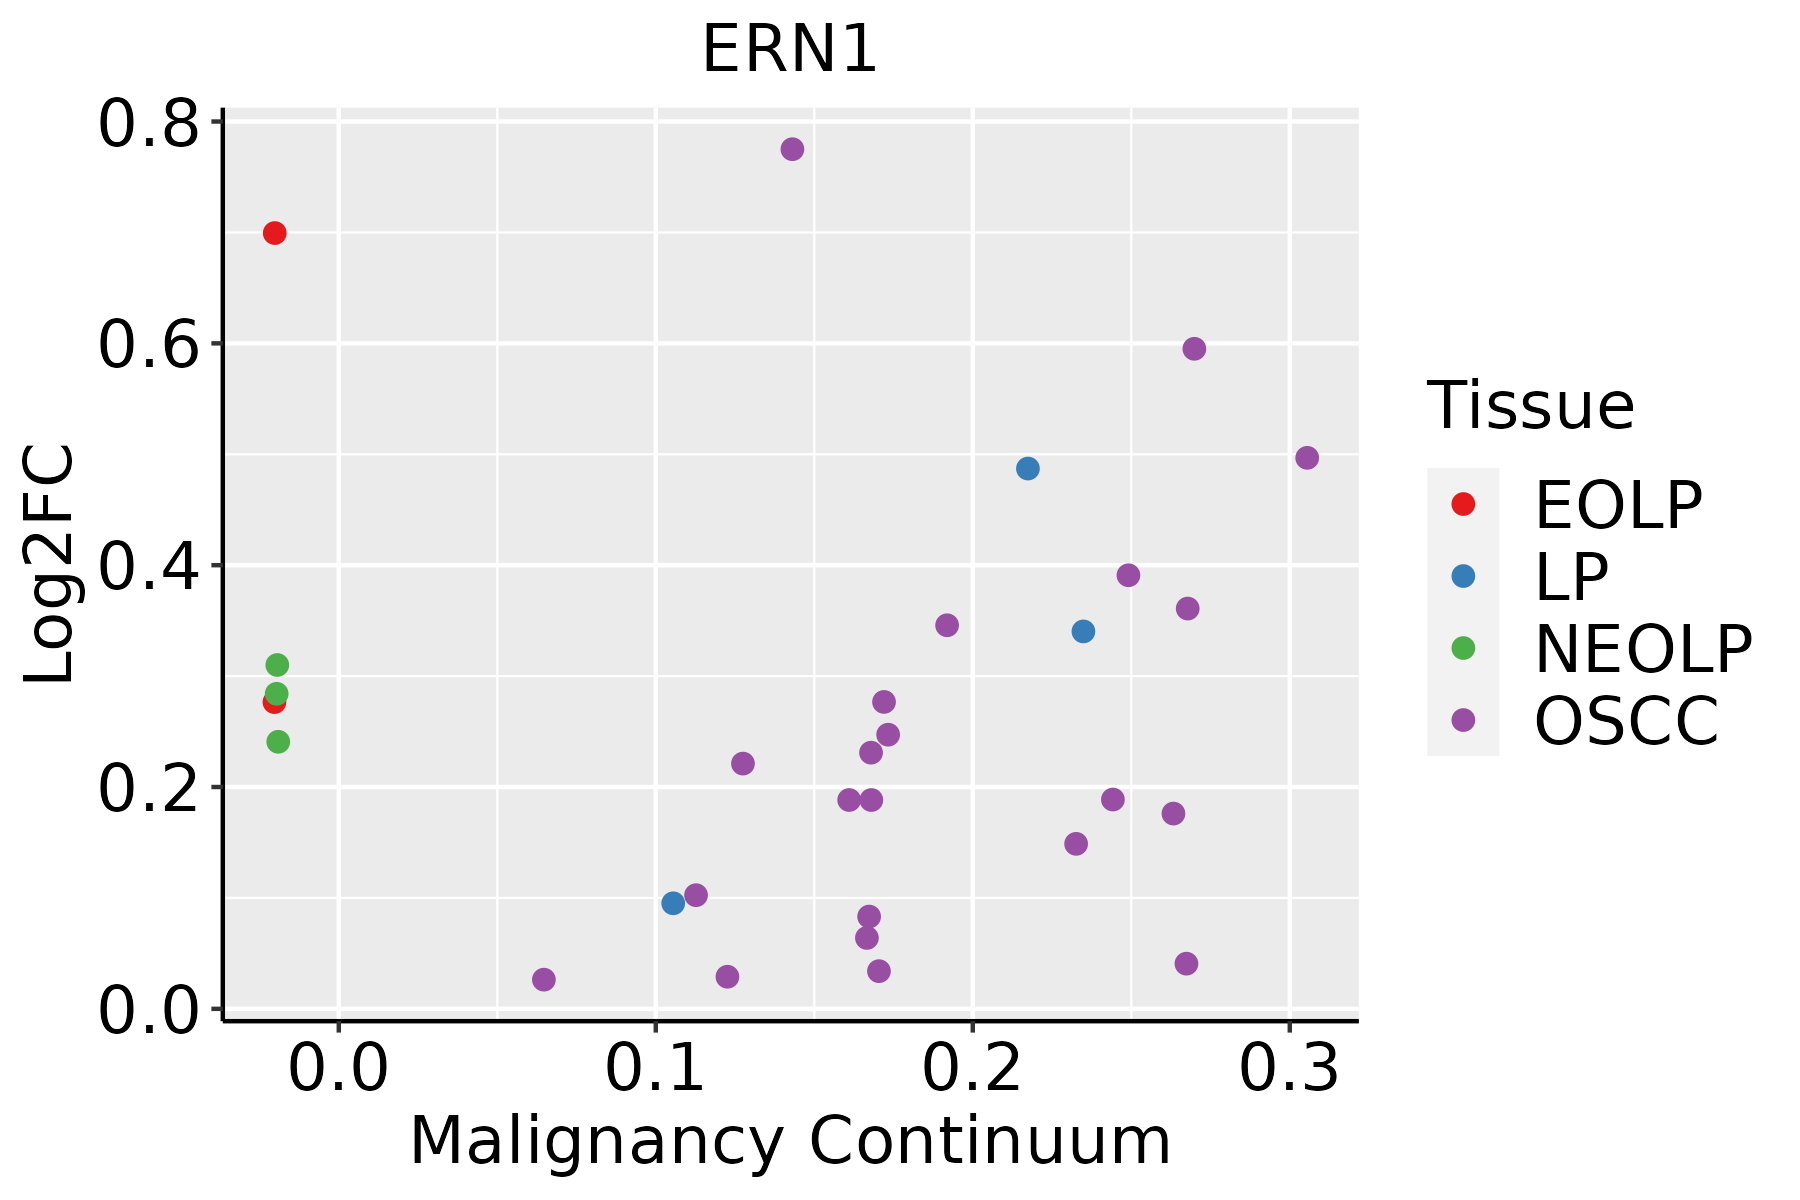 | EOLP: Erosive Oral lichen planus |
| LP: leukoplakia |
| NEOLP: Non-erosive oral lichen planus |
| OSCC: Oral squamous cell carcinoma |
| GO ID | Tissue | Disease Stage | Description | Gene Ratio | Bg Ratio | pvalue | p.adjust | Count |
| GO:000838016 | Endometrium | AEH | RNA splicing | 111/2100 | 434/18723 | 2.42e-17 | 1.12e-14 | 111 |
| GO:004348416 | Endometrium | AEH | regulation of RNA splicing | 55/2100 | 148/18723 | 1.28e-16 | 5.49e-14 | 55 |
| GO:009719316 | Endometrium | AEH | intrinsic apoptotic signaling pathway | 75/2100 | 288/18723 | 1.46e-12 | 2.83e-10 | 75 |
| GO:000640210 | Endometrium | AEH | mRNA catabolic process | 59/2100 | 232/18723 | 9.51e-10 | 8.52e-08 | 59 |
| GO:000974316 | Endometrium | AEH | response to carbohydrate | 62/2100 | 253/18723 | 1.76e-09 | 1.51e-07 | 62 |
| GO:000697916 | Endometrium | AEH | response to oxidative stress | 93/2100 | 446/18723 | 1.94e-09 | 1.64e-07 | 93 |
| GO:003428416 | Endometrium | AEH | response to monosaccharide | 57/2100 | 225/18723 | 2.13e-09 | 1.77e-07 | 57 |
| GO:003497616 | Endometrium | AEH | response to endoplasmic reticulum stress | 62/2100 | 256/18723 | 2.88e-09 | 2.13e-07 | 62 |
| GO:000974615 | Endometrium | AEH | response to hexose | 54/2100 | 219/18723 | 1.54e-08 | 9.72e-07 | 54 |
| GO:000030216 | Endometrium | AEH | response to reactive oxygen species | 54/2100 | 222/18723 | 2.54e-08 | 1.49e-06 | 54 |
| GO:000640110 | Endometrium | AEH | RNA catabolic process | 63/2100 | 278/18723 | 3.28e-08 | 1.87e-06 | 63 |
| GO:000974910 | Endometrium | AEH | response to glucose | 52/2100 | 212/18723 | 3.40e-08 | 1.91e-06 | 52 |
| GO:006219716 | Endometrium | AEH | cellular response to chemical stress | 71/2100 | 337/18723 | 1.03e-07 | 5.05e-06 | 71 |
| GO:00016789 | Endometrium | AEH | cellular glucose homeostasis | 44/2100 | 172/18723 | 1.04e-07 | 5.07e-06 | 44 |
| GO:00331209 | Endometrium | AEH | positive regulation of RNA splicing | 17/2100 | 37/18723 | 1.15e-07 | 5.49e-06 | 17 |
| GO:007132210 | Endometrium | AEH | cellular response to carbohydrate stimulus | 41/2100 | 163/18723 | 4.55e-07 | 1.87e-05 | 41 |
| GO:004254215 | Endometrium | AEH | response to hydrogen peroxide | 38/2100 | 146/18723 | 4.70e-07 | 1.92e-05 | 38 |
| GO:00506738 | Endometrium | AEH | epithelial cell proliferation | 84/2100 | 437/18723 | 4.88e-07 | 1.94e-05 | 84 |
| GO:00486604 | Endometrium | AEH | regulation of smooth muscle cell proliferation | 43/2100 | 180/18723 | 1.09e-06 | 3.68e-05 | 43 |
| GO:00713339 | Endometrium | AEH | cellular response to glucose stimulus | 38/2100 | 151/18723 | 1.17e-06 | 3.82e-05 | 38 |
| Pathway ID | Tissue | Disease Stage | Description | Gene Ratio | Bg Ratio | pvalue | p.adjust | qvalue | Count |
| hsa0501226 | Endometrium | AEH | Parkinson disease | 115/1197 | 266/8465 | 6.24e-32 | 1.01e-29 | 7.42e-30 | 115 |
| hsa0501620 | Endometrium | AEH | Huntington disease | 118/1197 | 306/8465 | 3.00e-27 | 2.44e-25 | 1.78e-25 | 118 |
| hsa0501420 | Endometrium | AEH | Amyotrophic lateral sclerosis | 123/1197 | 364/8465 | 2.17e-22 | 7.82e-21 | 5.72e-21 | 123 |
| hsa0501020 | Endometrium | AEH | Alzheimer disease | 124/1197 | 384/8465 | 1.20e-20 | 3.91e-19 | 2.86e-19 | 124 |
| hsa0493220 | Endometrium | AEH | Non-alcoholic fatty liver disease | 67/1197 | 155/8465 | 5.91e-19 | 1.75e-17 | 1.28e-17 | 67 |
| hsa0502220 | Endometrium | AEH | Pathways of neurodegeneration - multiple diseases | 137/1197 | 476/8465 | 9.27e-18 | 2.32e-16 | 1.70e-16 | 137 |
| hsa0414126 | Endometrium | AEH | Protein processing in endoplasmic reticulum | 62/1197 | 174/8465 | 5.97e-13 | 1.39e-11 | 1.01e-11 | 62 |
| hsa0501718 | Endometrium | AEH | Spinocerebellar ataxia | 43/1197 | 143/8465 | 5.92e-07 | 7.69e-06 | 5.63e-06 | 43 |
| hsa0541726 | Endometrium | AEH | Lipid and atherosclerosis | 47/1197 | 215/8465 | 1.24e-03 | 7.62e-03 | 5.58e-03 | 47 |
| hsa0421010 | Endometrium | AEH | Apoptosis | 30/1197 | 136/8465 | 7.72e-03 | 4.05e-02 | 2.96e-02 | 30 |
| hsa05012111 | Endometrium | AEH | Parkinson disease | 115/1197 | 266/8465 | 6.24e-32 | 1.01e-29 | 7.42e-30 | 115 |
| hsa05016110 | Endometrium | AEH | Huntington disease | 118/1197 | 306/8465 | 3.00e-27 | 2.44e-25 | 1.78e-25 | 118 |
| hsa05014110 | Endometrium | AEH | Amyotrophic lateral sclerosis | 123/1197 | 364/8465 | 2.17e-22 | 7.82e-21 | 5.72e-21 | 123 |
| hsa05010110 | Endometrium | AEH | Alzheimer disease | 124/1197 | 384/8465 | 1.20e-20 | 3.91e-19 | 2.86e-19 | 124 |
| hsa04932110 | Endometrium | AEH | Non-alcoholic fatty liver disease | 67/1197 | 155/8465 | 5.91e-19 | 1.75e-17 | 1.28e-17 | 67 |
| hsa05022110 | Endometrium | AEH | Pathways of neurodegeneration - multiple diseases | 137/1197 | 476/8465 | 9.27e-18 | 2.32e-16 | 1.70e-16 | 137 |
| hsa04141111 | Endometrium | AEH | Protein processing in endoplasmic reticulum | 62/1197 | 174/8465 | 5.97e-13 | 1.39e-11 | 1.01e-11 | 62 |
| hsa0501719 | Endometrium | AEH | Spinocerebellar ataxia | 43/1197 | 143/8465 | 5.92e-07 | 7.69e-06 | 5.63e-06 | 43 |
| hsa05417111 | Endometrium | AEH | Lipid and atherosclerosis | 47/1197 | 215/8465 | 1.24e-03 | 7.62e-03 | 5.58e-03 | 47 |
| hsa0421015 | Endometrium | AEH | Apoptosis | 30/1197 | 136/8465 | 7.72e-03 | 4.05e-02 | 2.96e-02 | 30 |
| Hugo Symbol | Variant Class | Variant Classification | dbSNP RS | HGVSc | HGVSp | HGVSp Short | SWISSPROT | BIOTYPE | SIFT | PolyPhen | Tumor Sample Barcode | Tissue | Histology | Sex | Age | Stage | Therapy Types | Drugs | Outcome |
| ERN1 | SNV | Missense_Mutation | | c.2251N>A | p.Pro751Thr | p.P751T | O75460 | protein_coding | tolerated(0.25) | benign(0.055) | TCGA-A2-A04Q-01 | Breast | breast invasive carcinoma | Female | <65 | I/II | Chemotherapy | adriamycin | SD |
| ERN1 | SNV | Missense_Mutation | rs372670758 | c.2021C>T | p.Ser674Leu | p.S674L | O75460 | protein_coding | deleterious(0.02) | benign(0.286) | TCGA-A2-A0YT-01 | Breast | breast invasive carcinoma | Female | <65 | III/IV | Hormone Therapy | arimidex | SD |
| ERN1 | SNV | Missense_Mutation | rs780870849 | c.2468N>T | p.Ala823Val | p.A823V | O75460 | protein_coding | deleterious(0) | possibly_damaging(0.576) | TCGA-AN-A0AK-01 | Breast | breast invasive carcinoma | Female | >=65 | I/II | Unknown | Unknown | SD |
| ERN1 | SNV | Missense_Mutation | novel | c.1786G>A | p.Val596Met | p.V596M | O75460 | protein_coding | deleterious(0) | probably_damaging(0.995) | TCGA-BH-A0B4-01 | Breast | breast invasive carcinoma | Male | >=65 | III/IV | Hormone Therapy | tamoxiphen | SD |
| ERN1 | SNV | Missense_Mutation | | c.2108N>A | p.Gly703Asp | p.G703D | O75460 | protein_coding | deleterious(0) | benign(0.272) | TCGA-BH-A0C7-01 | Breast | breast invasive carcinoma | Female | <65 | I/II | Chemotherapy | adriamycin | CR |
| ERN1 | SNV | Missense_Mutation | | c.731N>G | p.Asn244Ser | p.N244S | O75460 | protein_coding | tolerated(0.61) | probably_damaging(0.956) | TCGA-BH-A18U-01 | Breast | breast invasive carcinoma | Female | >=65 | III/IV | Unknown | Unknown | SD |
| ERN1 | insertion | Nonsense_Mutation | novel | c.700_701insTTCAGAGTTCTTAAATATTACATAAAAATCATGGAT | p.Arg234delinsLeuGlnSerSerTerIleLeuHisLysAsnHisGlyTrp | p.R234delinsLQSS*ILHKNHGW | O75460 | protein_coding | | | TCGA-A8-A08H-01 | Breast | breast invasive carcinoma | Female | >=65 | I/II | Unknown | Unknown | SD |
| ERN1 | insertion | Nonsense_Mutation | novel | c.2432_2433insAACGCCCAGAAAAGCACAGAAAGAATGAAGCAAC | p.Met812ThrfsTer9 | p.M812Tfs*9 | O75460 | protein_coding | | | TCGA-A8-A08S-01 | Breast | breast invasive carcinoma | Female | >=65 | I/II | Hormone Therapy | anastrozole | SD |
| ERN1 | insertion | Frame_Shift_Ins | novel | c.1854_1855insATTAAAATAAAGTT | p.Ser619IlefsTer12 | p.S619Ifs*12 | O75460 | protein_coding | | | TCGA-A8-A0A7-01 | Breast | breast invasive carcinoma | Female | <65 | I/II | Unknown | Unknown | SD |
| ERN1 | insertion | Nonsense_Mutation | novel | c.1784_1785insTTATAGAAAACACAGATTAGCATAAAGGCCCATATATTCCCATTATA | p.Val596TyrfsTer8 | p.V596Yfs*8 | O75460 | protein_coding | | | TCGA-BH-A0B4-01 | Breast | breast invasive carcinoma | Male | >=65 | III/IV | Hormone Therapy | tamoxiphen | SD |
| Entrez ID | Symbol | Category | Interaction Types | Drug Claim Name | Drug Name | PMIDs |
| 2081 | ERN1 | DRUGGABLE GENOME, ENZYME, SERINE THREONINE KINASE, TRANSCRIPTION FACTOR, KINASE | inhibitor | 249565809 | | |
| 2081 | ERN1 | DRUGGABLE GENOME, ENZYME, SERINE THREONINE KINASE, TRANSCRIPTION FACTOR, KINASE | | BB 0223767 | | |
| 2081 | ERN1 | DRUGGABLE GENOME, ENZYME, SERINE THREONINE KINASE, TRANSCRIPTION FACTOR, KINASE | | 879325-11-8 | | |
| 2081 | ERN1 | DRUGGABLE GENOME, ENZYME, SERINE THREONINE KINASE, TRANSCRIPTION FACTOR, KINASE | | AC1LE05K | | |
| 2081 | ERN1 | DRUGGABLE GENOME, ENZYME, SERINE THREONINE KINASE, TRANSCRIPTION FACTOR, KINASE | | US8614253, 32-5 | | |
| 2081 | ERN1 | DRUGGABLE GENOME, ENZYME, SERINE THREONINE KINASE, TRANSCRIPTION FACTOR, KINASE | | T8361 | | |
| 2081 | ERN1 | DRUGGABLE GENOME, ENZYME, SERINE THREONINE KINASE, TRANSCRIPTION FACTOR, KINASE | | US9241942, 32-12 | | |
| 2081 | ERN1 | DRUGGABLE GENOME, ENZYME, SERINE THREONINE KINASE, TRANSCRIPTION FACTOR, KINASE | | US9040714, 155 | | |
| 2081 | ERN1 | DRUGGABLE GENOME, ENZYME, SERINE THREONINE KINASE, TRANSCRIPTION FACTOR, KINASE | | US8614253, 29-19 | | |
| 2081 | ERN1 | DRUGGABLE GENOME, ENZYME, SERINE THREONINE KINASE, TRANSCRIPTION FACTOR, KINASE | | US8614253, 29-1 | | |


