
|
|||||
|
 | |
| |
| |
| |
| |
| |
|
Gene: ERMP1 |
Gene summary for ERMP1 |
| Gene information | Species | Human | Gene symbol | ERMP1 | Gene ID | 79956 |
| Gene name | endoplasmic reticulum metallopeptidase 1 | |
| Gene Alias | FXNA | |
| Cytomap | 9p24.1 | |
| Gene Type | protein-coding | GO ID | GO:0006508 | UniProtAcc | Q6ZMD3 |
Top |
Malignant transformation analysis |
| Identification of the aberrant gene expression in precancerous and cancerous lesions by comparing the gene expression of stem-like cells in diseased tissues with normal stem cells |
| Entrez ID | Symbol | Replicates | Species | Organ | Tissue | Adj P-value | Log2FC | Malignancy |
| 79956 | ERMP1 | LZE2T | Human | Esophagus | ESCC | 9.31e-08 | 5.64e-01 | 0.082 |
| 79956 | ERMP1 | LZE20T | Human | Esophagus | ESCC | 1.45e-02 | 1.32e-01 | 0.0662 |
| 79956 | ERMP1 | P2T-E | Human | Esophagus | ESCC | 2.85e-03 | 3.04e-02 | 0.1177 |
| 79956 | ERMP1 | P4T-E | Human | Esophagus | ESCC | 2.43e-03 | 4.38e-02 | 0.1323 |
| 79956 | ERMP1 | P5T-E | Human | Esophagus | ESCC | 2.68e-04 | 6.99e-02 | 0.1327 |
| 79956 | ERMP1 | P8T-E | Human | Esophagus | ESCC | 1.39e-09 | 2.32e-01 | 0.0889 |
| 79956 | ERMP1 | P9T-E | Human | Esophagus | ESCC | 2.32e-14 | 2.28e-01 | 0.1131 |
| 79956 | ERMP1 | P10T-E | Human | Esophagus | ESCC | 4.82e-03 | 2.14e-02 | 0.116 |
| 79956 | ERMP1 | P15T-E | Human | Esophagus | ESCC | 2.46e-05 | 1.14e-01 | 0.1149 |
| 79956 | ERMP1 | P16T-E | Human | Esophagus | ESCC | 6.49e-04 | 8.37e-02 | 0.1153 |
| 79956 | ERMP1 | P21T-E | Human | Esophagus | ESCC | 1.13e-04 | 8.25e-02 | 0.1617 |
| 79956 | ERMP1 | P23T-E | Human | Esophagus | ESCC | 4.13e-07 | 1.20e-01 | 0.108 |
| 79956 | ERMP1 | P28T-E | Human | Esophagus | ESCC | 2.03e-04 | 4.02e-02 | 0.1149 |
| 79956 | ERMP1 | P30T-E | Human | Esophagus | ESCC | 2.02e-03 | 1.04e-01 | 0.137 |
| 79956 | ERMP1 | P37T-E | Human | Esophagus | ESCC | 2.14e-05 | 1.16e-01 | 0.1371 |
| 79956 | ERMP1 | P42T-E | Human | Esophagus | ESCC | 2.96e-04 | 7.40e-02 | 0.1175 |
| 79956 | ERMP1 | P48T-E | Human | Esophagus | ESCC | 2.94e-04 | 6.92e-02 | 0.0959 |
| 79956 | ERMP1 | P54T-E | Human | Esophagus | ESCC | 5.37e-06 | 1.54e-01 | 0.0975 |
| 79956 | ERMP1 | P56T-E | Human | Esophagus | ESCC | 4.77e-04 | 4.87e-01 | 0.1613 |
| 79956 | ERMP1 | P61T-E | Human | Esophagus | ESCC | 2.70e-05 | 5.42e-02 | 0.099 |
| Page: 1 2 |
| Tissue | Expression Dynamics | Abbreviation |
| Esophagus | 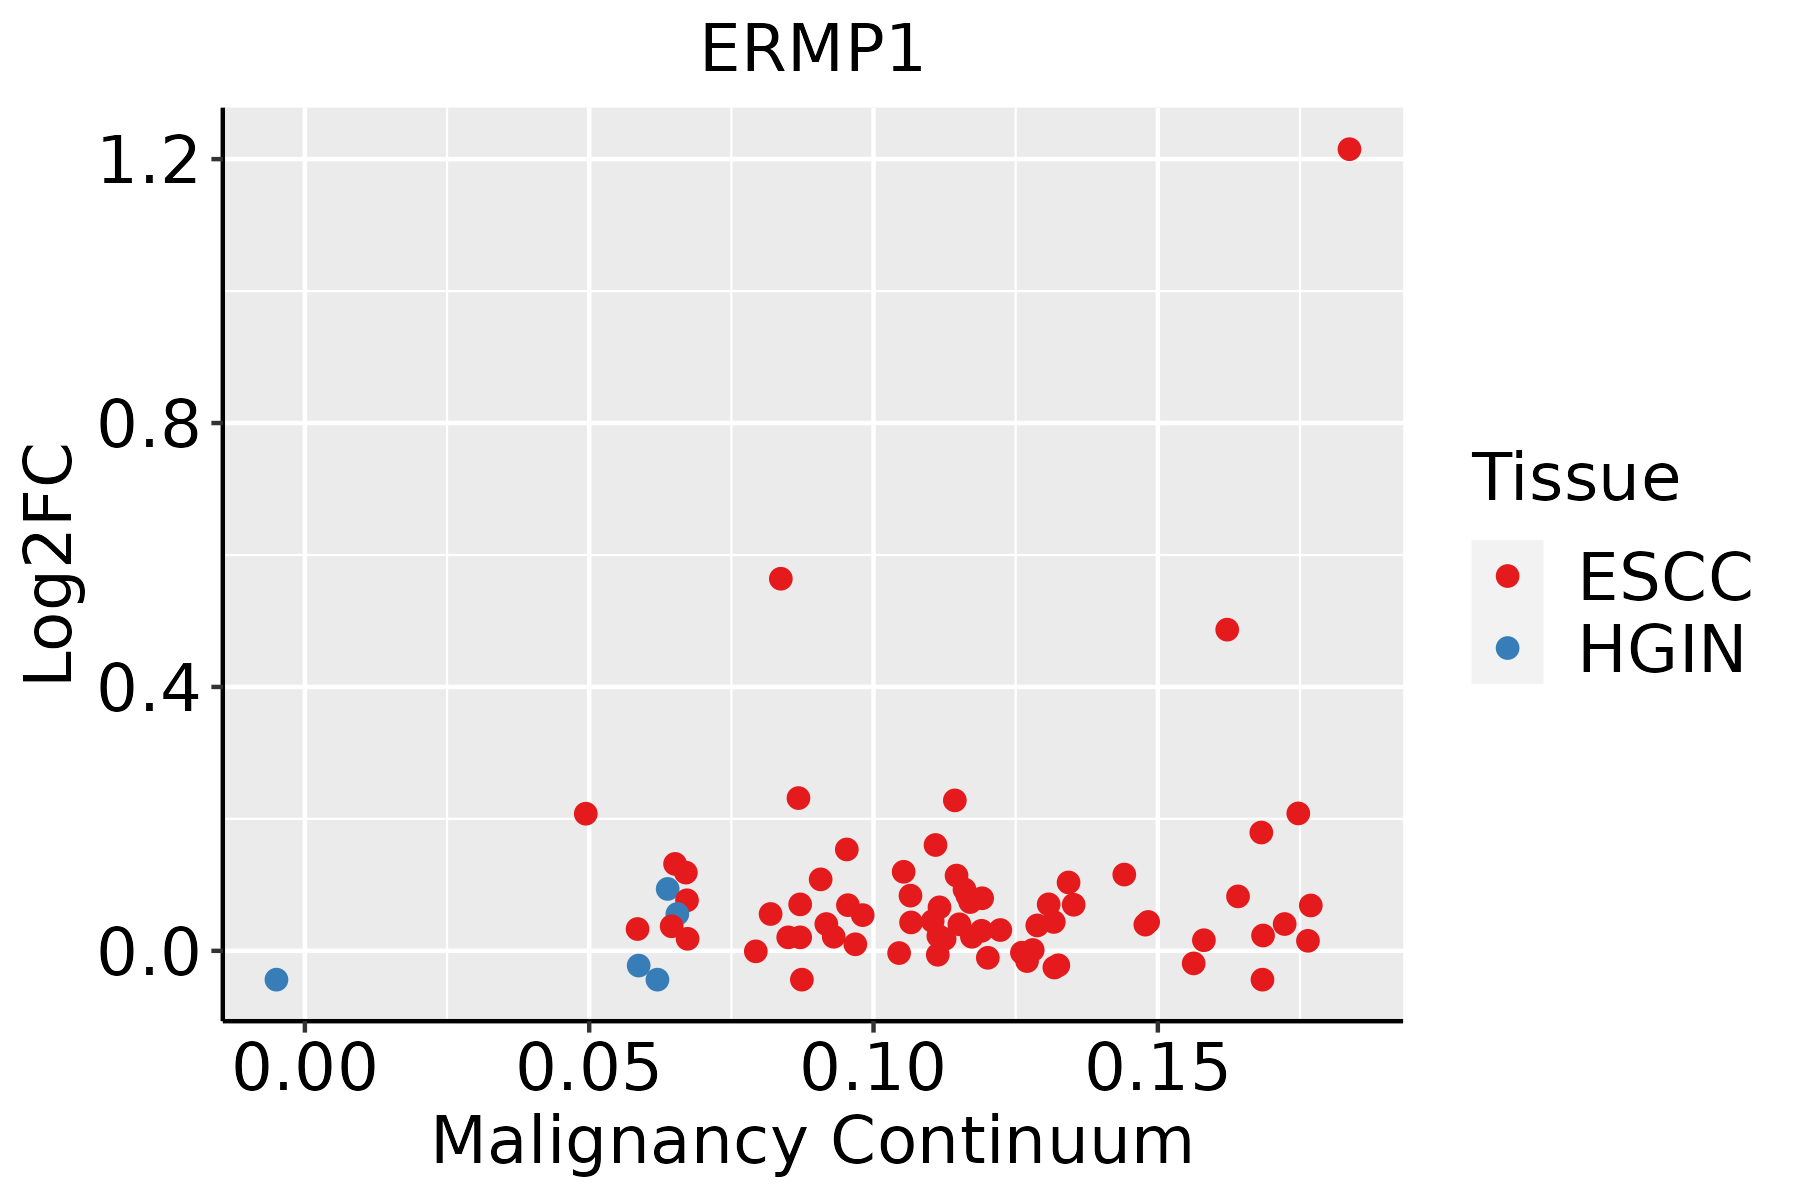 | ESCC: Esophageal squamous cell carcinoma |
| HGIN: High-grade intraepithelial neoplasias | ||
| LGIN: Low-grade intraepithelial neoplasias | ||
| Oral Cavity | 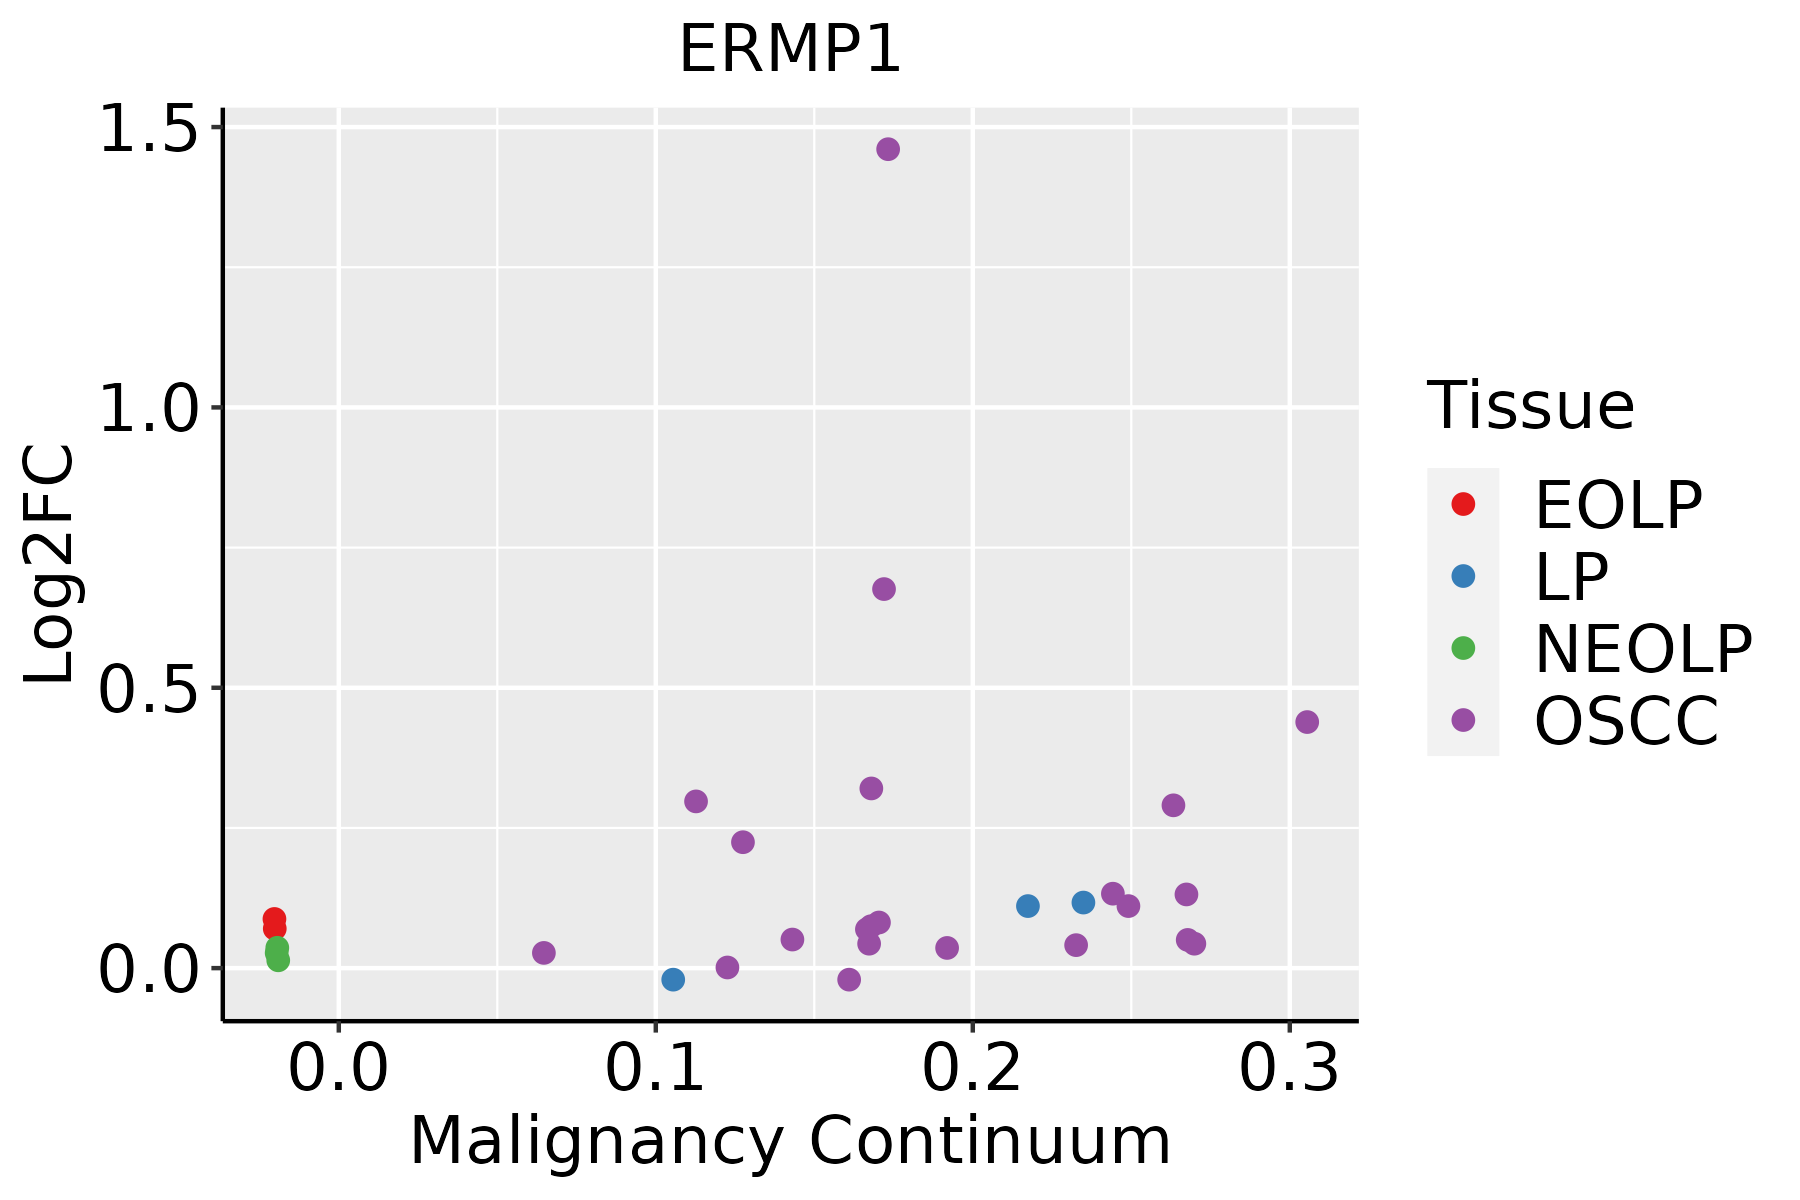 | EOLP: Erosive Oral lichen planus |
| LP: leukoplakia | ||
| NEOLP: Non-erosive oral lichen planus | ||
| OSCC: Oral squamous cell carcinoma | ||
| Prostate | 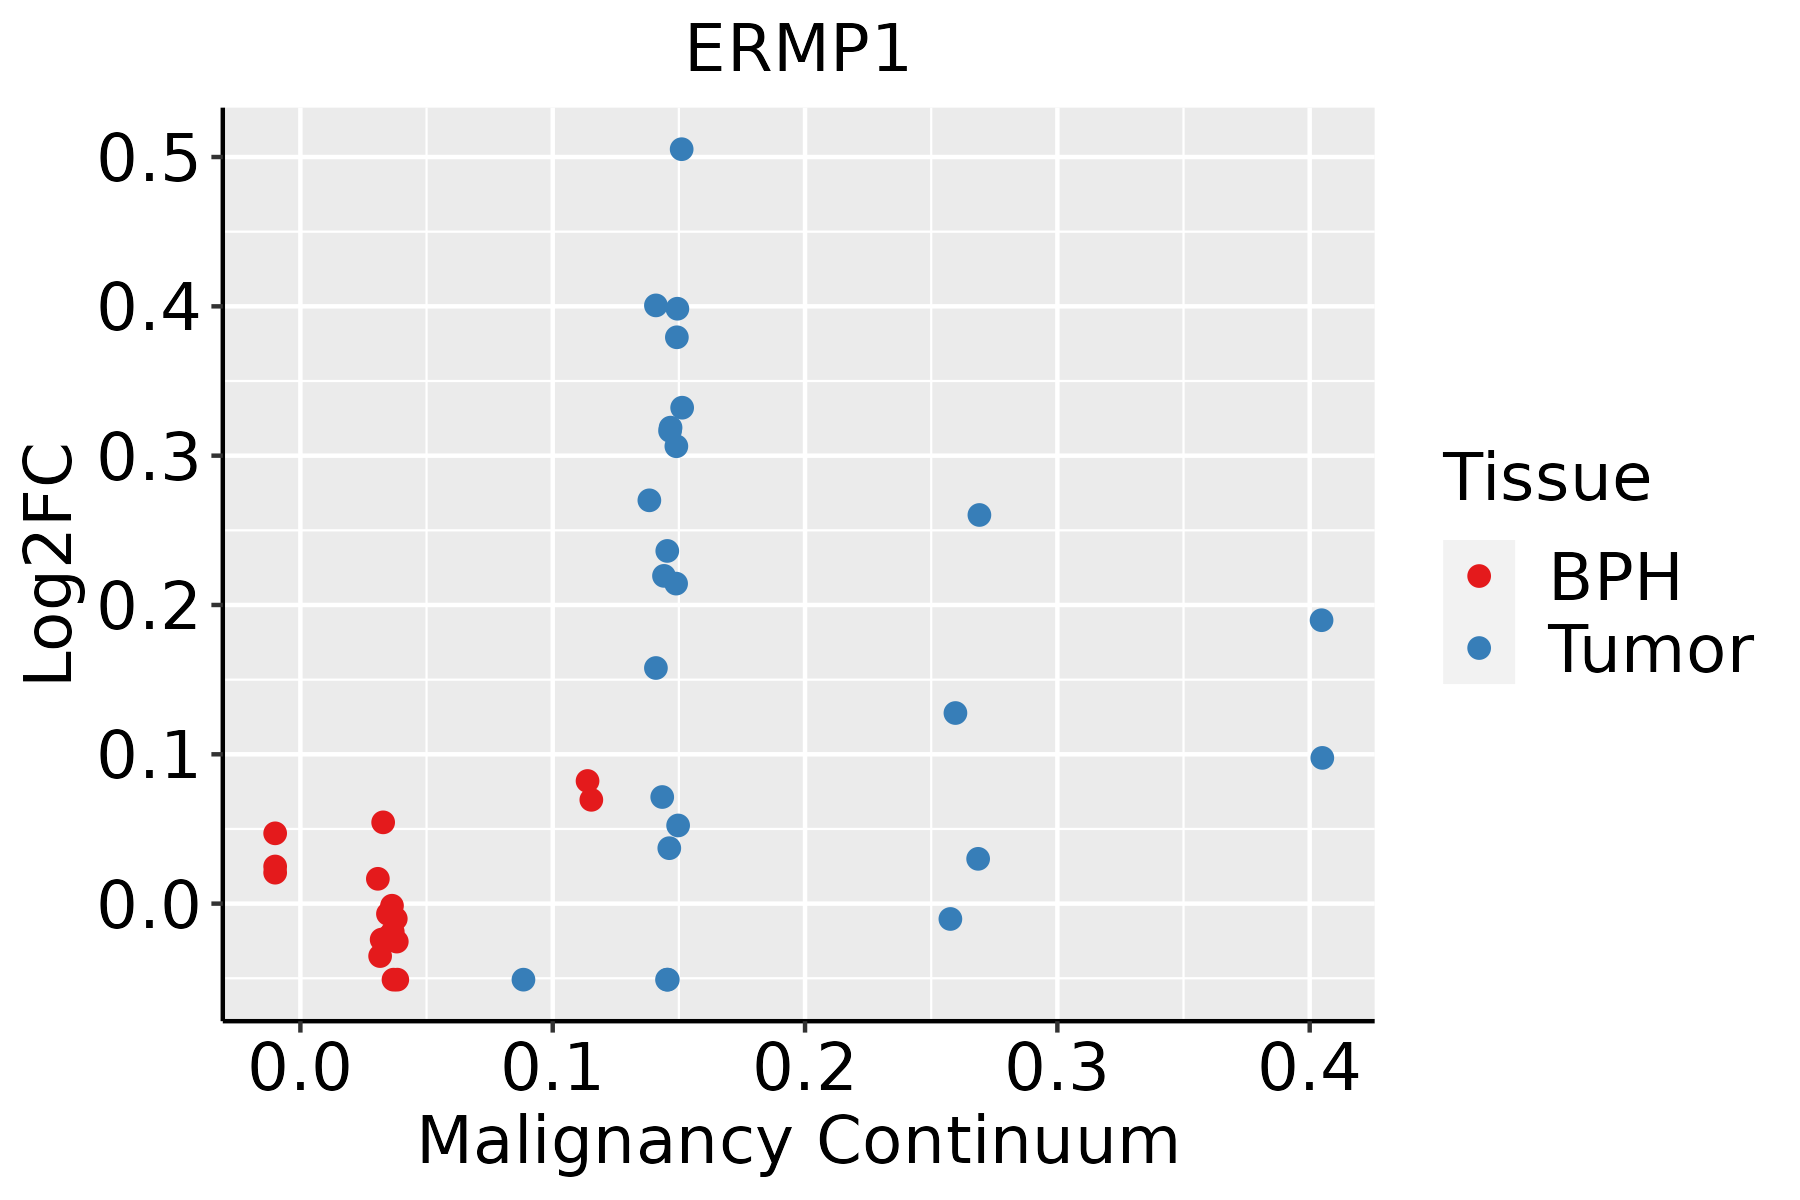 | BPH: Benign Prostatic Hyperplasia |
| ∗log2FC in expression of this searched gene in stem-like cells from each diseased tissue sample relative to stem-like cells in normal samples in each tissue plotted against the malignancy continuum. Samples are colored based on if they are from different disease stage. |
Top |
Malignant transformation related pathway analysis |
| Find out the enriched GO biological processes and KEGG pathways involved in transition from healthy to precancer to cancer |
| Tissue | Disease Stage | Enriched GO biological Processes |
| Colorectum | AD |  |
| Colorectum | SER |  |
| Colorectum | MSS |  |
| Colorectum | MSI-H |  |
| Colorectum | FAP |  |
| ∗Top 15 enriched GO BP terms are showed in the bar plot of each disease state in each tissue. Each row represents a significant GO biological process which is colored according to the -log10(p.adjust). |
| Page: 1 2 3 4 5 6 7 8 9 |
| GO ID | Tissue | Disease Stage | Description | Gene Ratio | Bg Ratio | pvalue | p.adjust | Count |
| GO:0034976111 | Esophagus | ESCC | response to endoplasmic reticulum stress | 192/8552 | 256/18723 | 7.15e-22 | 1.30e-19 | 192 |
| GO:0006979111 | Esophagus | ESCC | response to oxidative stress | 303/8552 | 446/18723 | 7.15e-22 | 1.30e-19 | 303 |
| GO:0062197111 | Esophagus | ESCC | cellular response to chemical stress | 234/8552 | 337/18723 | 5.37e-19 | 5.97e-17 | 234 |
| GO:0035966111 | Esophagus | ESCC | response to topologically incorrect protein | 125/8552 | 159/18723 | 1.44e-17 | 1.27e-15 | 125 |
| GO:0034599111 | Esophagus | ESCC | cellular response to oxidative stress | 197/8552 | 288/18723 | 3.76e-15 | 2.15e-13 | 197 |
| GO:0006986111 | Esophagus | ESCC | response to unfolded protein | 107/8552 | 137/18723 | 7.01e-15 | 3.87e-13 | 107 |
| GO:0035967111 | Esophagus | ESCC | cellular response to topologically incorrect protein | 90/8552 | 116/18723 | 1.94e-12 | 8.11e-11 | 90 |
| GO:0034620111 | Esophagus | ESCC | cellular response to unfolded protein | 74/8552 | 96/18723 | 3.10e-10 | 8.66e-09 | 74 |
| GO:003096818 | Esophagus | ESCC | endoplasmic reticulum unfolded protein response | 59/8552 | 74/18723 | 1.90e-09 | 4.36e-08 | 59 |
| GO:003497620 | Oral cavity | OSCC | response to endoplasmic reticulum stress | 178/7305 | 256/18723 | 2.59e-23 | 6.06e-21 | 178 |
| GO:000697920 | Oral cavity | OSCC | response to oxidative stress | 273/7305 | 446/18723 | 8.35e-22 | 1.65e-19 | 273 |
| GO:003596620 | Oral cavity | OSCC | response to topologically incorrect protein | 117/7305 | 159/18723 | 6.93e-19 | 8.60e-17 | 117 |
| GO:000698620 | Oral cavity | OSCC | response to unfolded protein | 103/7305 | 137/18723 | 6.47e-18 | 6.50e-16 | 103 |
| GO:006219720 | Oral cavity | OSCC | cellular response to chemical stress | 204/7305 | 337/18723 | 6.89e-16 | 5.19e-14 | 204 |
| GO:003459920 | Oral cavity | OSCC | cellular response to oxidative stress | 173/7305 | 288/18723 | 2.90e-13 | 1.43e-11 | 173 |
| GO:003596720 | Oral cavity | OSCC | cellular response to topologically incorrect protein | 83/7305 | 116/18723 | 1.09e-12 | 4.84e-11 | 83 |
| GO:003462019 | Oral cavity | OSCC | cellular response to unfolded protein | 71/7305 | 96/18723 | 3.45e-12 | 1.35e-10 | 71 |
| GO:003096815 | Oral cavity | OSCC | endoplasmic reticulum unfolded protein response | 55/7305 | 74/18723 | 6.91e-10 | 1.75e-08 | 55 |
| GO:000698619 | Prostate | Tumor | response to unfolded protein | 65/3246 | 137/18723 | 3.56e-16 | 7.50e-14 | 65 |
| GO:003497619 | Prostate | Tumor | response to endoplasmic reticulum stress | 97/3246 | 256/18723 | 2.92e-15 | 4.78e-13 | 97 |
| Page: 1 2 |
| Pathway ID | Tissue | Disease Stage | Description | Gene Ratio | Bg Ratio | pvalue | p.adjust | qvalue | Count |
| Page: 1 |
Top |
Cell-cell communication analysis |
| Identification of potential cell-cell interactions between two cell types and their ligand-receptor pairs for different disease states |
| Ligand | Receptor | LRpair | Pathway | Tissue | Disease Stage |
| Page: 1 |
Top |
Single-cell gene regulatory network inference analysis |
| Find out the significant the regulons (TFs) and the target genes of each regulon across cell types for different disease states |
| TF | Cell Type | Tissue | Disease Stage | Target Gene | RSS | Regulon Activity |
| ∗The dot plots of a searched regulon are shown for all cell subpopulations in each disease state of each tissue based on the regulon specific score inferred using pySCENIC and by calculating the average expression. |
| Page: 1 |
Top |
Somatic mutation of malignant transformation related genes |
| Annotation of somatic variants for genes involved in malignant transformation |
| Hugo Symbol | Variant Class | Variant Classification | dbSNP RS | HGVSc | HGVSp | HGVSp Short | SWISSPROT | BIOTYPE | SIFT | PolyPhen | Tumor Sample Barcode | Tissue | Histology | Sex | Age | Stage | Therapy Types | Drugs | Outcome |
| ERMP1 | SNV | Missense_Mutation | c.2179N>A | p.Pro727Thr | p.P727T | Q7Z2K6 | protein_coding | deleterious(0) | probably_damaging(0.961) | TCGA-A2-A25A-01 | Breast | breast invasive carcinoma | Female | <65 | I/II | Unspecific | Cytoxan | SD | |
| ERMP1 | SNV | Missense_Mutation | c.1618N>T | p.Val540Phe | p.V540F | Q7Z2K6 | protein_coding | tolerated(0.3) | benign(0.005) | TCGA-AQ-A04J-01 | Breast | breast invasive carcinoma | Female | <65 | I/II | Chemotherapy | cytoxan | SD | |
| ERMP1 | SNV | Missense_Mutation | c.445N>C | p.Val149Leu | p.V149L | Q7Z2K6 | protein_coding | tolerated(0.32) | benign(0.005) | TCGA-D8-A1Y3-01 | Breast | breast invasive carcinoma | Female | <65 | III/IV | Chemotherapy | doxorubicine+cyclophosphamide | SD | |
| ERMP1 | SNV | Missense_Mutation | c.2632N>G | p.Gln878Glu | p.Q878E | Q7Z2K6 | protein_coding | tolerated(0.54) | benign(0.001) | TCGA-D8-A27G-01 | Breast | breast invasive carcinoma | Female | >=65 | I/II | Unknown | Unknown | SD | |
| ERMP1 | SNV | Missense_Mutation | c.1886N>T | p.Gly629Val | p.G629V | Q7Z2K6 | protein_coding | tolerated(0.69) | benign(0) | TCGA-E9-A22E-01 | Breast | breast invasive carcinoma | Female | <65 | III/IV | Chemotherapy | cyclophosphane | SD | |
| ERMP1 | insertion | Frame_Shift_Ins | novel | c.1584dupT | p.Asp529Ter | p.D529* | Q7Z2K6 | protein_coding | TCGA-AN-A0AK-01 | Breast | breast invasive carcinoma | Female | >=65 | I/II | Unknown | Unknown | SD | ||
| ERMP1 | insertion | In_Frame_Ins | novel | c.2096_2097insTATTAA | p.Glu699delinsAspIleLys | p.E699delinsDIK | Q7Z2K6 | protein_coding | TCGA-AR-A0U0-01 | Breast | breast invasive carcinoma | Female | >=65 | I/II | Unknown | Unknown | SD | ||
| ERMP1 | deletion | Frame_Shift_Del | novel | c.2111_2147delAACGGGACTCTGGAATATGGATCAATGGGTTTGATTA | p.Lys704IlefsTer7 | p.K704Ifs*7 | Q7Z2K6 | protein_coding | TCGA-E2-A1B6-01 | Breast | breast invasive carcinoma | Female | <65 | I/II | Unspecific | Adriamycin | SD | ||
| ERMP1 | SNV | Missense_Mutation | c.2522N>G | p.Ser841Cys | p.S841C | Q7Z2K6 | protein_coding | tolerated(0.05) | benign(0.031) | TCGA-EK-A3GJ-01 | Cervix | cervical & endocervical cancer | Female | <65 | I/II | Unknown | Unknown | SD | |
| ERMP1 | SNV | Missense_Mutation | novel | c.991N>T | p.Arg331Cys | p.R331C | Q7Z2K6 | protein_coding | deleterious(0.04) | possibly_damaging(0.8) | TCGA-Q1-A5R2-01 | Cervix | cervical & endocervical cancer | Female | <65 | I/II | Chemotherapy | cisplatin | PR |
| Page: 1 2 3 4 5 6 7 8 9 10 |
Top |
Related drugs of malignant transformation related genes |
| Identification of chemicals and drugs interact with genes involved in malignant transfromation |
| (DGIdb 4.0) |
| Entrez ID | Symbol | Category | Interaction Types | Drug Claim Name | Drug Name | PMIDs |
| Page: 1 |

Copyright 2023-Present -The University of Texas Health Science Center at Houston |