
|
|||||
|
 | |
| |
| |
| |
| |
| |
|
Gene: ERLIN2 |
Gene summary for ERLIN2 |
| Gene information | Species | Human | Gene symbol | ERLIN2 | Gene ID | 11160 |
| Gene name | ER lipid raft associated 2 | |
| Gene Alias | C8orf2 | |
| Cytomap | 8p11.23 | |
| Gene Type | protein-coding | GO ID | GO:0006066 | UniProtAcc | O94905 |
Top |
Malignant transformation analysis |
| Identification of the aberrant gene expression in precancerous and cancerous lesions by comparing the gene expression of stem-like cells in diseased tissues with normal stem cells |
| Entrez ID | Symbol | Replicates | Species | Organ | Tissue | Adj P-value | Log2FC | Malignancy |
| 11160 | ERLIN2 | GSM4909317 | Human | Breast | IDC | 1.33e-26 | 6.36e-01 | 0.1355 |
| 11160 | ERLIN2 | GSM4909319 | Human | Breast | IDC | 2.70e-05 | -5.02e-02 | 0.1563 |
| 11160 | ERLIN2 | NCCBC2 | Human | Breast | DCIS | 6.75e-09 | 6.98e-01 | 0.1554 |
| 11160 | ERLIN2 | DCIS2 | Human | Breast | DCIS | 1.60e-31 | 1.53e-01 | 0.0085 |
| 11160 | ERLIN2 | LZE4T | Human | Esophagus | ESCC | 4.02e-06 | 1.50e-01 | 0.0811 |
| 11160 | ERLIN2 | LZE24T | Human | Esophagus | ESCC | 1.38e-09 | 3.35e-01 | 0.0596 |
| 11160 | ERLIN2 | P2T-E | Human | Esophagus | ESCC | 3.87e-33 | 6.09e-01 | 0.1177 |
| 11160 | ERLIN2 | P4T-E | Human | Esophagus | ESCC | 4.92e-14 | 4.47e-01 | 0.1323 |
| 11160 | ERLIN2 | P5T-E | Human | Esophagus | ESCC | 9.64e-07 | 5.44e-02 | 0.1327 |
| 11160 | ERLIN2 | P8T-E | Human | Esophagus | ESCC | 1.10e-19 | 2.87e-01 | 0.0889 |
| 11160 | ERLIN2 | P9T-E | Human | Esophagus | ESCC | 1.43e-09 | 1.36e-01 | 0.1131 |
| 11160 | ERLIN2 | P10T-E | Human | Esophagus | ESCC | 1.67e-21 | 2.71e-01 | 0.116 |
| 11160 | ERLIN2 | P11T-E | Human | Esophagus | ESCC | 9.99e-08 | 3.86e-01 | 0.1426 |
| 11160 | ERLIN2 | P12T-E | Human | Esophagus | ESCC | 5.71e-20 | 2.38e-01 | 0.1122 |
| 11160 | ERLIN2 | P15T-E | Human | Esophagus | ESCC | 7.63e-33 | 7.20e-01 | 0.1149 |
| 11160 | ERLIN2 | P16T-E | Human | Esophagus | ESCC | 1.24e-26 | 4.78e-01 | 0.1153 |
| 11160 | ERLIN2 | P17T-E | Human | Esophagus | ESCC | 5.31e-04 | 2.95e-01 | 0.1278 |
| 11160 | ERLIN2 | P19T-E | Human | Esophagus | ESCC | 1.07e-03 | 3.13e-01 | 0.1662 |
| 11160 | ERLIN2 | P20T-E | Human | Esophagus | ESCC | 5.48e-13 | 3.09e-01 | 0.1124 |
| 11160 | ERLIN2 | P21T-E | Human | Esophagus | ESCC | 9.17e-26 | 4.21e-01 | 0.1617 |
| Page: 1 2 3 4 5 6 |
| Tissue | Expression Dynamics | Abbreviation |
| Breast | 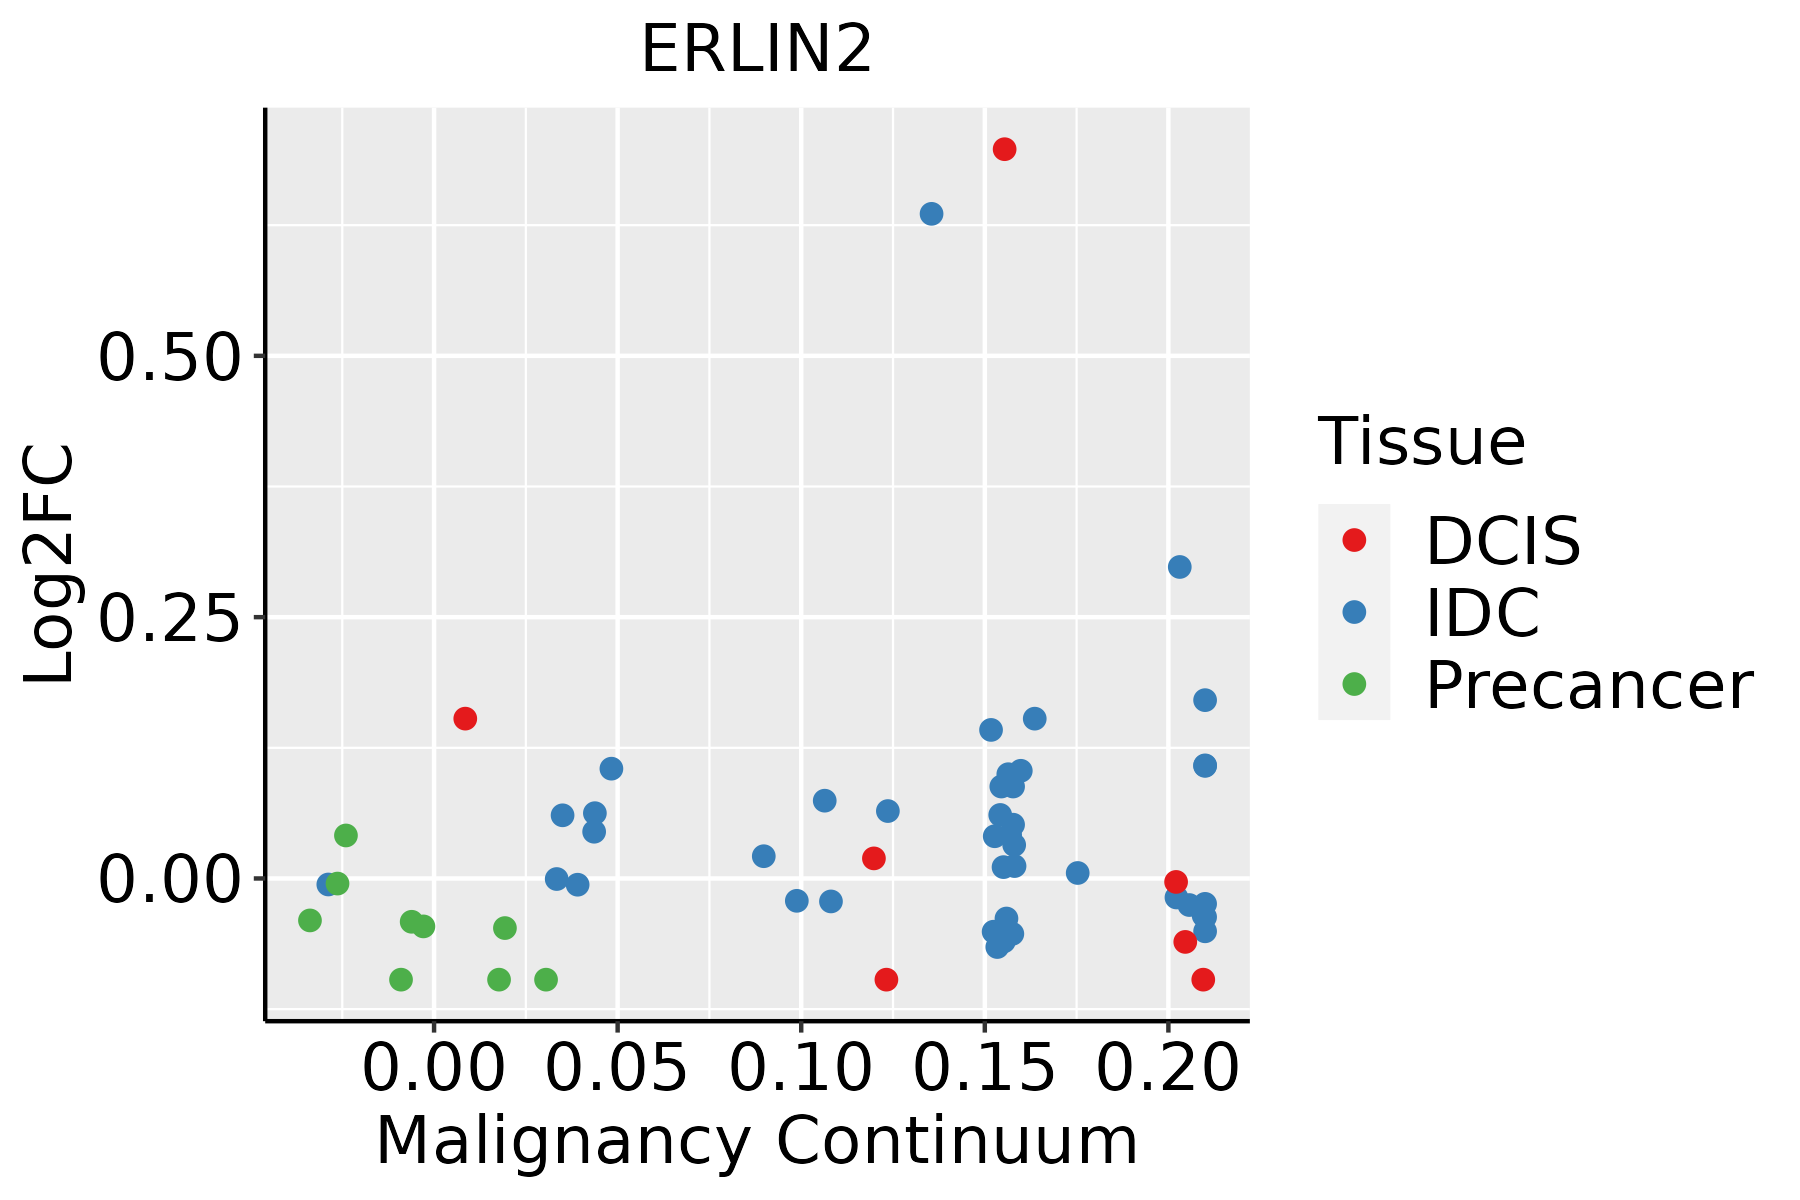 | IDC: Invasive ductal carcinoma |
| DCIS: Ductal carcinoma in situ | ||
| Precancer(BRCA1-mut): Precancerous lesion from BRCA1 mutation carriers | ||
| Esophagus | 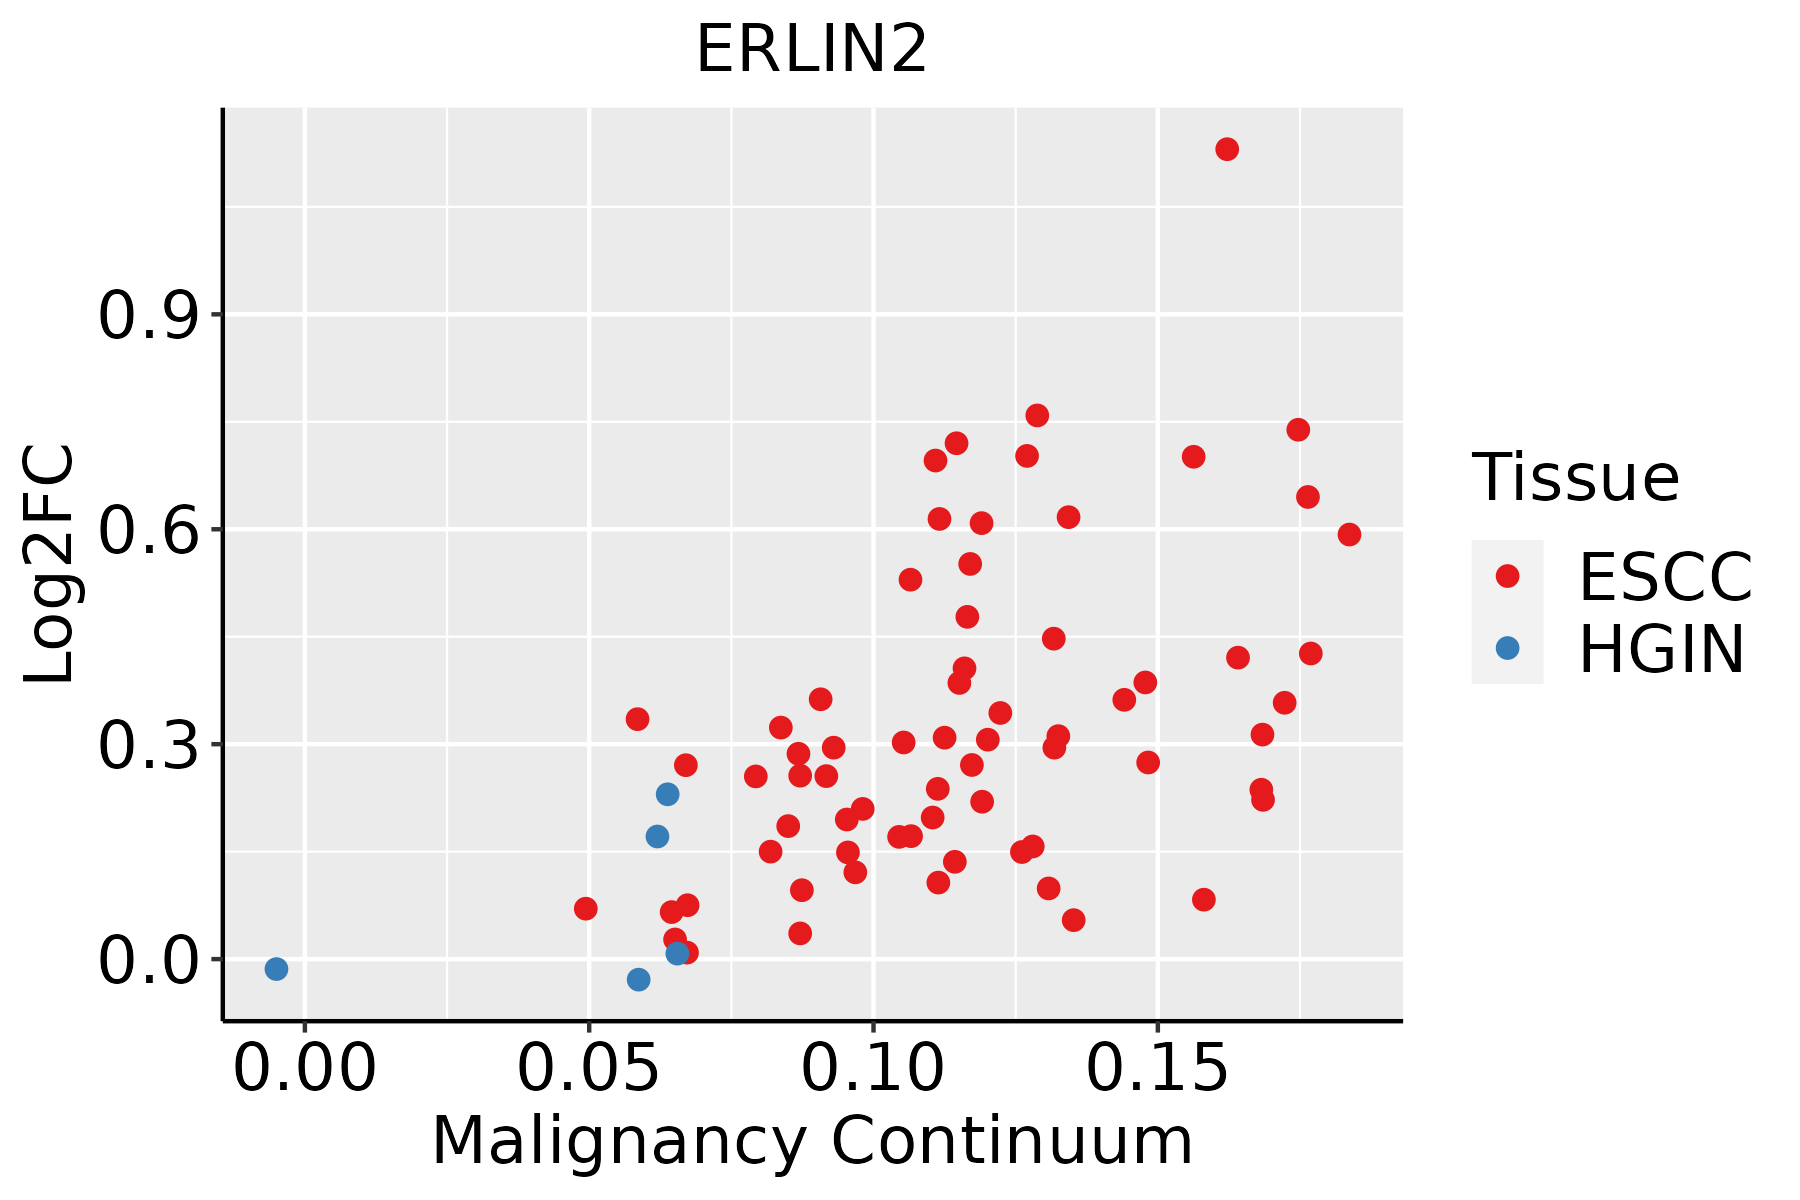 | ESCC: Esophageal squamous cell carcinoma |
| HGIN: High-grade intraepithelial neoplasias | ||
| LGIN: Low-grade intraepithelial neoplasias | ||
| Liver | 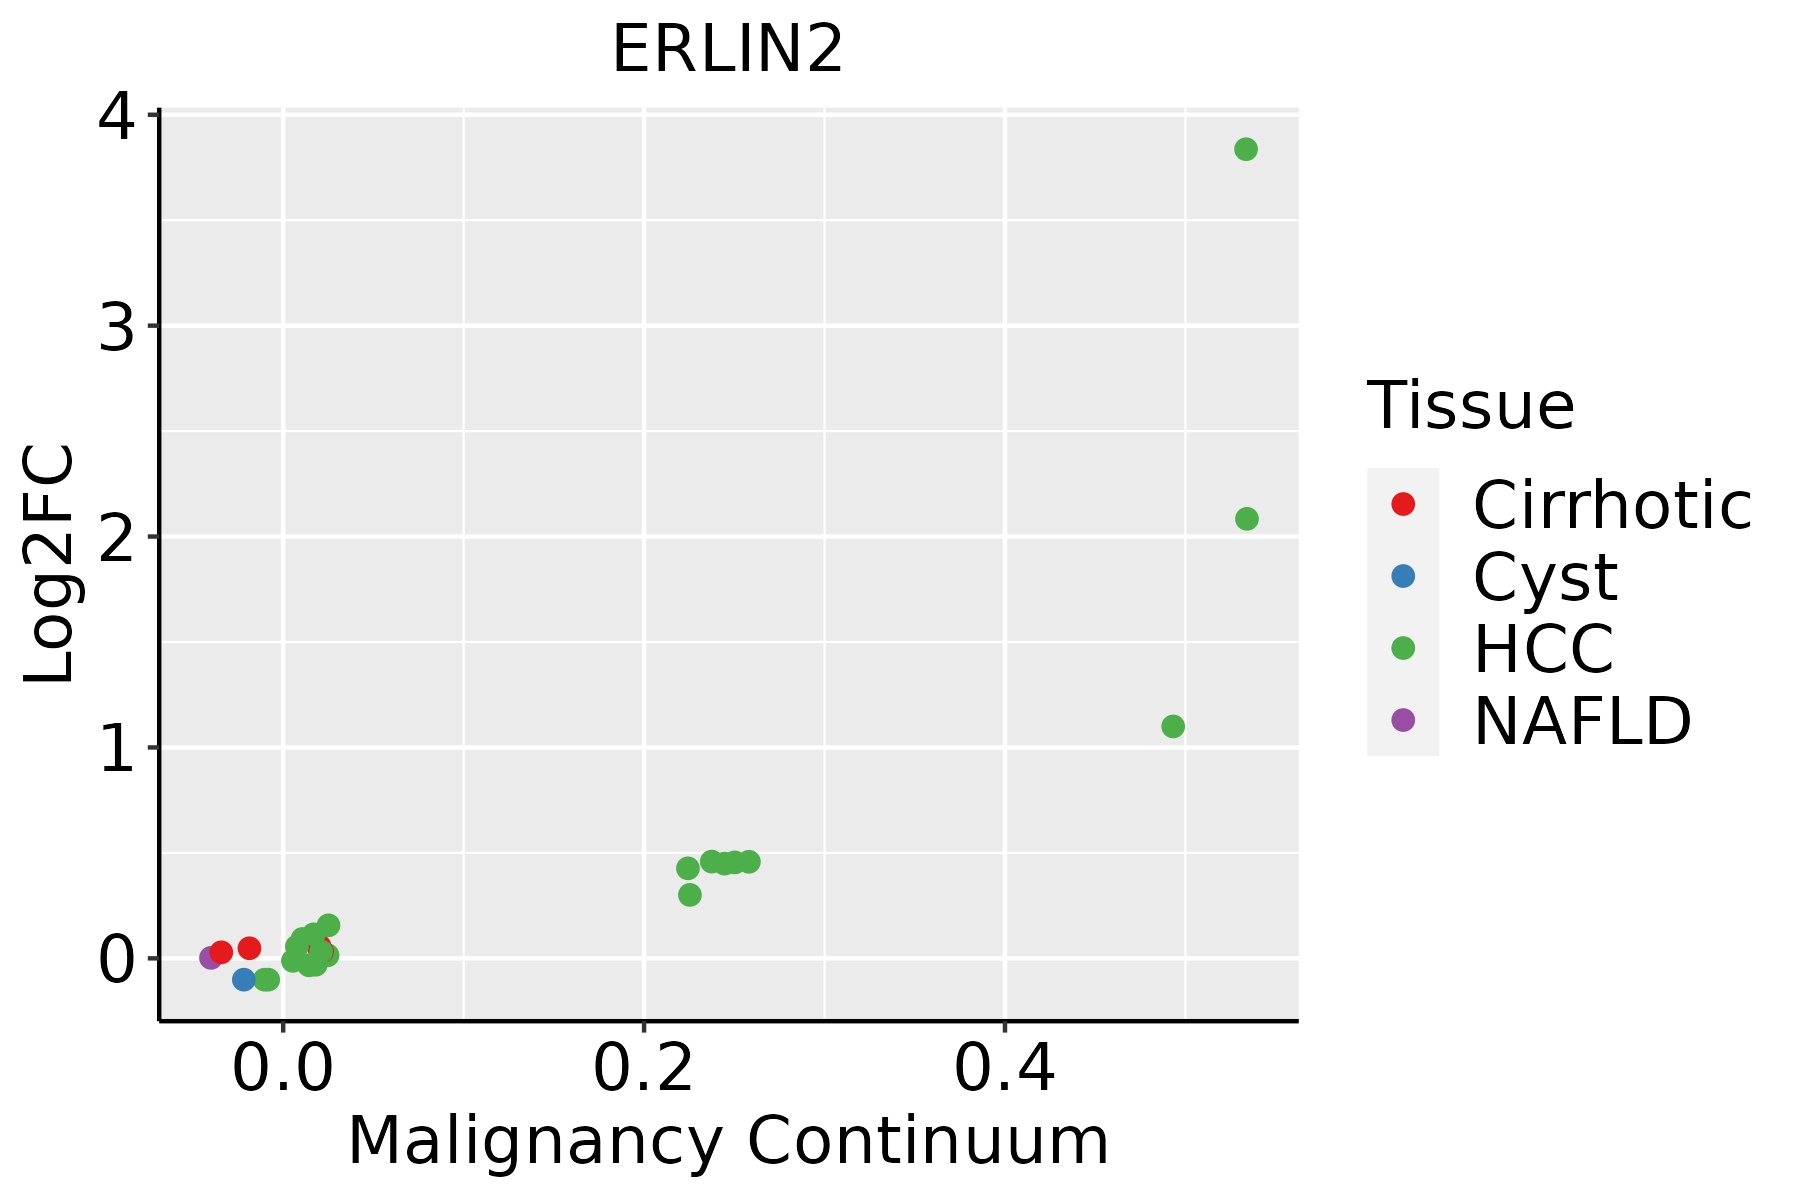 | HCC: Hepatocellular carcinoma |
| NAFLD: Non-alcoholic fatty liver disease | ||
| Oral Cavity | 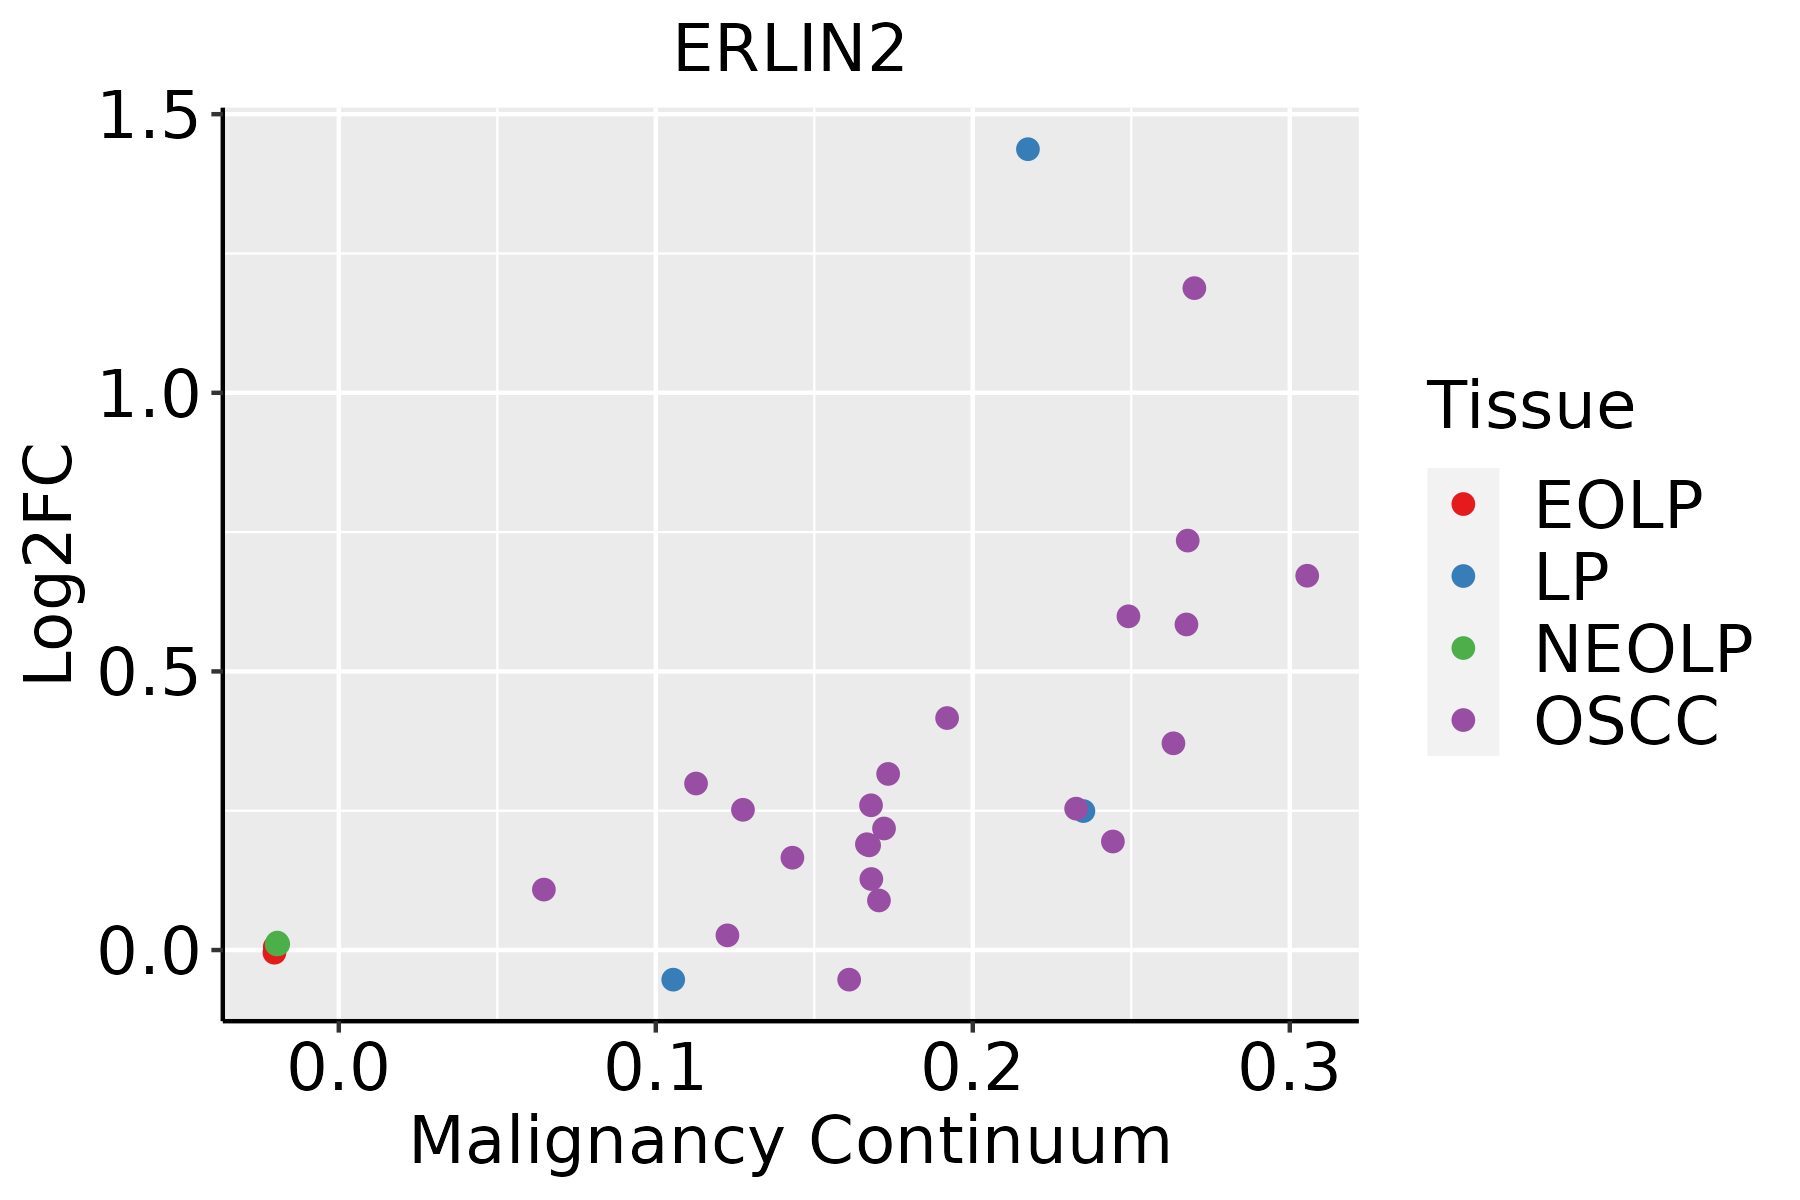 | EOLP: Erosive Oral lichen planus |
| LP: leukoplakia | ||
| NEOLP: Non-erosive oral lichen planus | ||
| OSCC: Oral squamous cell carcinoma | ||
| Prostate | 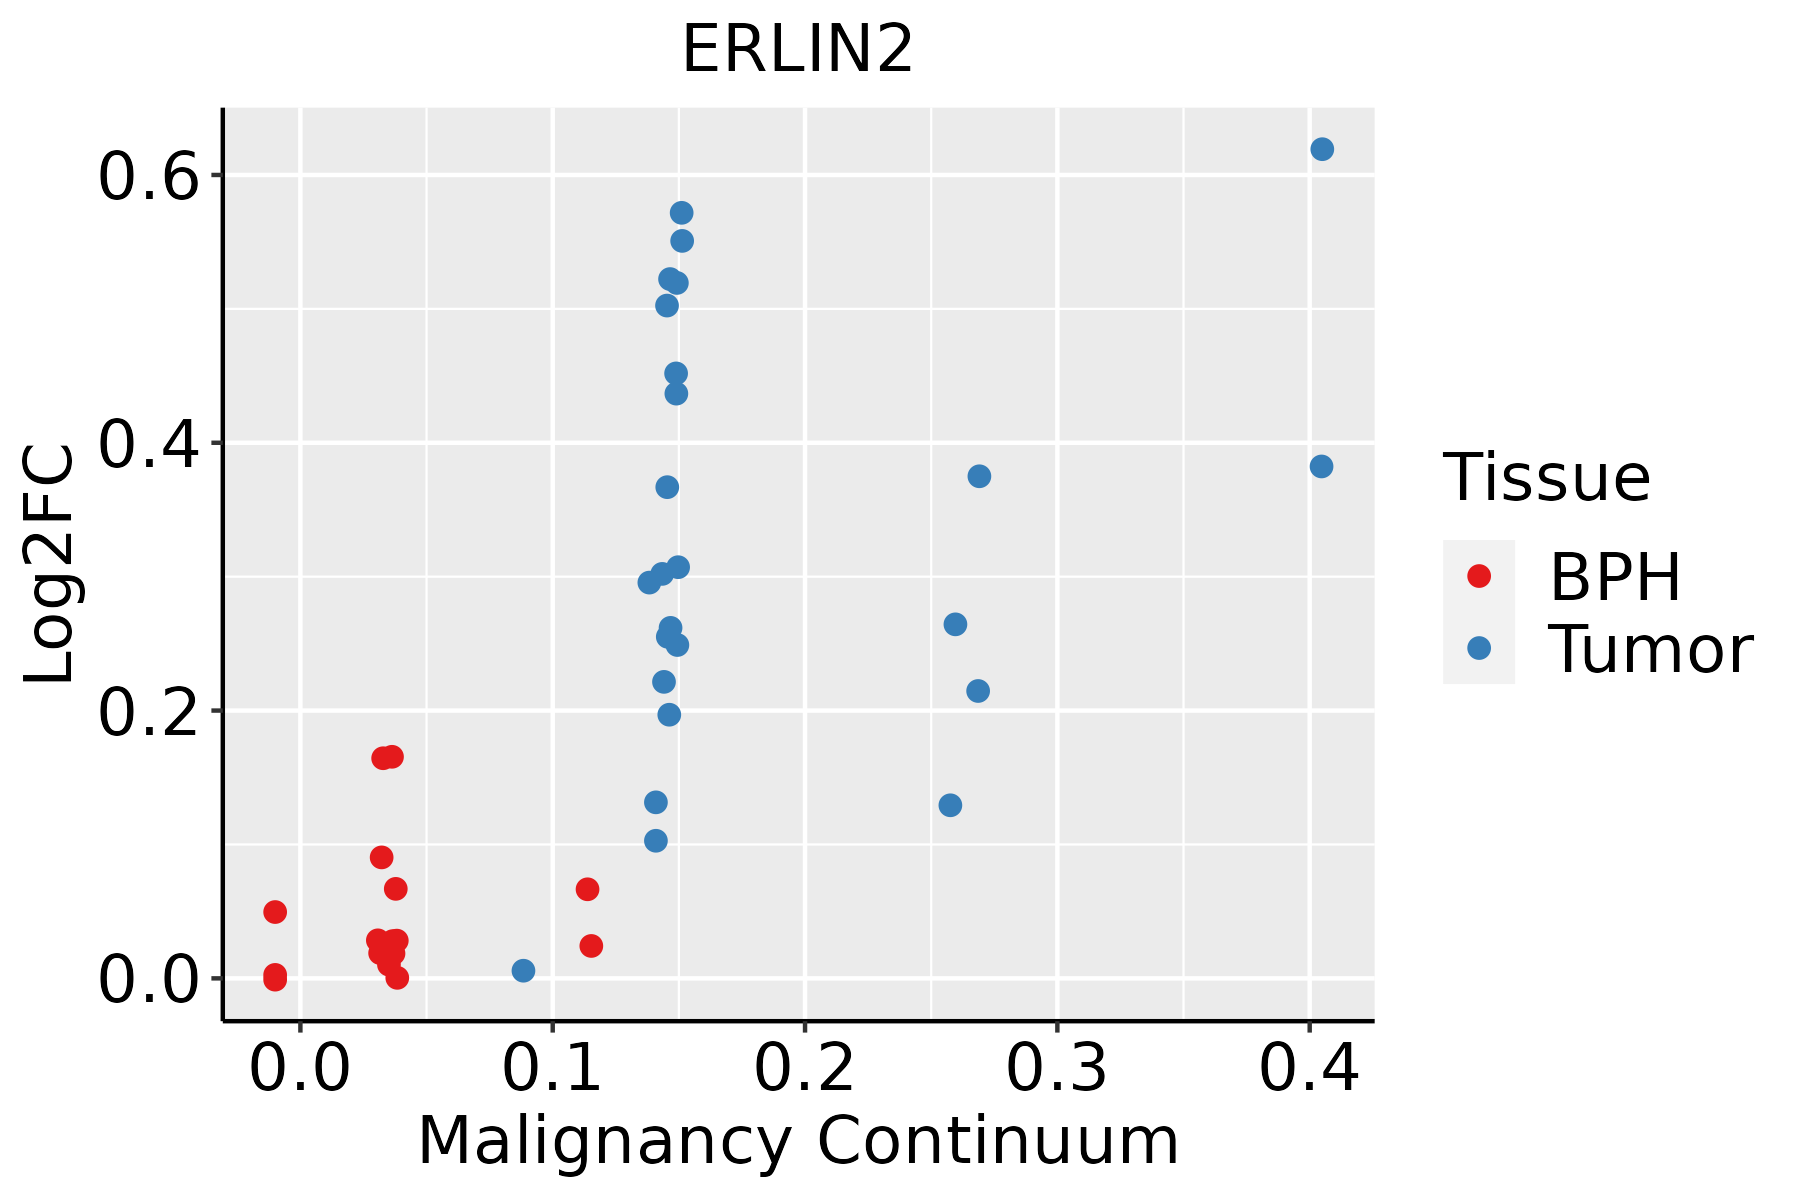 | BPH: Benign Prostatic Hyperplasia |
| Thyroid | 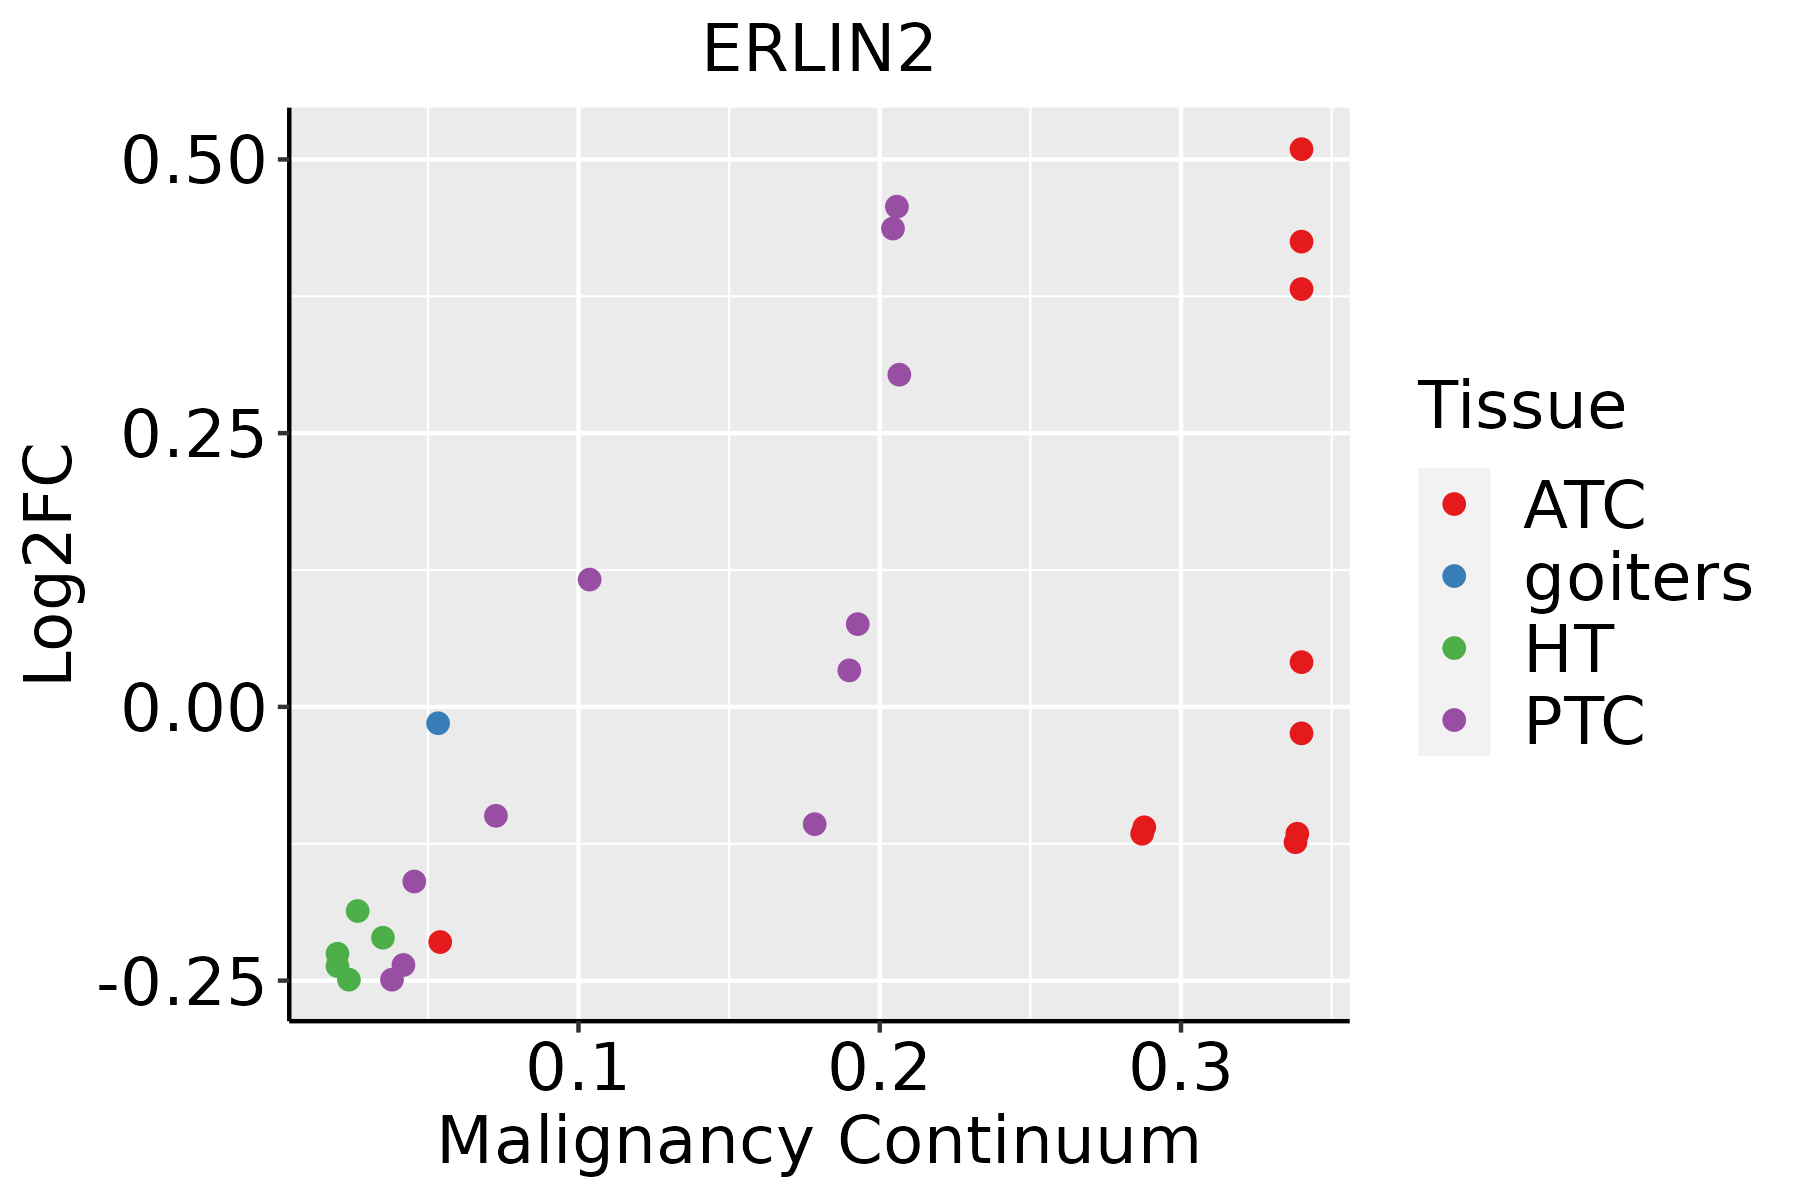 | ATC: Anaplastic thyroid cancer |
| HT: Hashimoto's thyroiditis | ||
| PTC: Papillary thyroid cancer |
| ∗log2FC in expression of this searched gene in stem-like cells from each diseased tissue sample relative to stem-like cells in normal samples in each tissue plotted against the malignancy continuum. Samples are colored based on if they are from different disease stage. |
Top |
Malignant transformation related pathway analysis |
| Find out the enriched GO biological processes and KEGG pathways involved in transition from healthy to precancer to cancer |
| Tissue | Disease Stage | Enriched GO biological Processes |
| Colorectum | AD |  |
| Colorectum | SER |  |
| Colorectum | MSS |  |
| Colorectum | MSI-H |  |
| Colorectum | FAP |  |
| ∗Top 15 enriched GO BP terms are showed in the bar plot of each disease state in each tissue. Each row represents a significant GO biological process which is colored according to the -log10(p.adjust). |
| Page: 1 2 3 4 5 6 7 8 9 |
| GO ID | Tissue | Disease Stage | Description | Gene Ratio | Bg Ratio | pvalue | p.adjust | Count |
| GO:001049814 | Breast | IDC | proteasomal protein catabolic process | 75/1434 | 490/18723 | 5.59e-09 | 4.41e-07 | 75 |
| GO:003497614 | Breast | IDC | response to endoplasmic reticulum stress | 43/1434 | 256/18723 | 8.42e-07 | 3.82e-05 | 43 |
| GO:004316114 | Breast | IDC | proteasome-mediated ubiquitin-dependent protein catabolic process | 57/1434 | 412/18723 | 9.55e-06 | 2.68e-04 | 57 |
| GO:001921612 | Breast | IDC | regulation of lipid metabolic process | 45/1434 | 331/18723 | 1.21e-04 | 2.24e-03 | 45 |
| GO:00192184 | Breast | IDC | regulation of steroid metabolic process | 18/1434 | 100/18723 | 5.40e-04 | 6.96e-03 | 18 |
| GO:00468904 | Breast | IDC | regulation of lipid biosynthetic process | 26/1434 | 171/18723 | 5.92e-04 | 7.50e-03 | 26 |
| GO:00508102 | Breast | IDC | regulation of steroid biosynthetic process | 14/1434 | 69/18723 | 6.37e-04 | 7.94e-03 | 14 |
| GO:00066944 | Breast | IDC | steroid biosynthetic process | 25/1434 | 173/18723 | 1.56e-03 | 1.56e-02 | 25 |
| GO:007233012 | Breast | IDC | monocarboxylic acid biosynthetic process | 29/1434 | 214/18723 | 1.91e-03 | 1.83e-02 | 29 |
| GO:001605313 | Breast | IDC | organic acid biosynthetic process | 39/1434 | 316/18723 | 2.13e-03 | 1.99e-02 | 39 |
| GO:000698412 | Breast | IDC | ER-nucleus signaling pathway | 10/1434 | 46/18723 | 2.15e-03 | 2.00e-02 | 10 |
| GO:000663312 | Breast | IDC | fatty acid biosynthetic process | 23/1434 | 163/18723 | 3.21e-03 | 2.70e-02 | 23 |
| GO:004639413 | Breast | IDC | carboxylic acid biosynthetic process | 38/1434 | 314/18723 | 3.39e-03 | 2.83e-02 | 38 |
| GO:004230411 | Breast | IDC | regulation of fatty acid biosynthetic process | 10/1434 | 49/18723 | 3.51e-03 | 2.90e-02 | 10 |
| GO:001049824 | Breast | DCIS | proteasomal protein catabolic process | 75/1390 | 490/18723 | 1.44e-09 | 1.40e-07 | 75 |
| GO:003497622 | Breast | DCIS | response to endoplasmic reticulum stress | 43/1390 | 256/18723 | 3.65e-07 | 1.71e-05 | 43 |
| GO:004316124 | Breast | DCIS | proteasome-mediated ubiquitin-dependent protein catabolic process | 57/1390 | 412/18723 | 3.76e-06 | 1.16e-04 | 57 |
| GO:001921621 | Breast | DCIS | regulation of lipid metabolic process | 43/1390 | 331/18723 | 2.37e-04 | 3.71e-03 | 43 |
| GO:000698421 | Breast | DCIS | ER-nucleus signaling pathway | 10/1390 | 46/18723 | 1.70e-03 | 1.68e-02 | 10 |
| GO:004689012 | Breast | DCIS | regulation of lipid biosynthetic process | 24/1390 | 171/18723 | 1.89e-03 | 1.81e-02 | 24 |
| Page: 1 2 3 4 5 6 7 8 9 |
| Pathway ID | Tissue | Disease Stage | Description | Gene Ratio | Bg Ratio | pvalue | p.adjust | qvalue | Count |
| Page: 1 |
Top |
Cell-cell communication analysis |
| Identification of potential cell-cell interactions between two cell types and their ligand-receptor pairs for different disease states |
| Ligand | Receptor | LRpair | Pathway | Tissue | Disease Stage |
| Page: 1 |
Top |
Single-cell gene regulatory network inference analysis |
| Find out the significant the regulons (TFs) and the target genes of each regulon across cell types for different disease states |
| TF | Cell Type | Tissue | Disease Stage | Target Gene | RSS | Regulon Activity |
| ∗The dot plots of a searched regulon are shown for all cell subpopulations in each disease state of each tissue based on the regulon specific score inferred using pySCENIC and by calculating the average expression. |
| Page: 1 |
Top |
Somatic mutation of malignant transformation related genes |
| Annotation of somatic variants for genes involved in malignant transformation |
| Hugo Symbol | Variant Class | Variant Classification | dbSNP RS | HGVSc | HGVSp | HGVSp Short | SWISSPROT | BIOTYPE | SIFT | PolyPhen | Tumor Sample Barcode | Tissue | Histology | Sex | Age | Stage | Therapy Types | Drugs | Outcome |
| ERLIN2 | SNV | Missense_Mutation | novel | c.632G>A | p.Arg211Gln | p.R211Q | O94905 | protein_coding | deleterious(0) | probably_damaging(0.988) | TCGA-A2-A0YH-01 | Breast | breast invasive carcinoma | Female | <65 | III/IV | Chemotherapy | adriamycin | SD |
| ERLIN2 | SNV | Missense_Mutation | c.304G>C | p.Asp102His | p.D102H | O94905 | protein_coding | deleterious(0) | probably_damaging(0.998) | TCGA-E2-A1B0-01 | Breast | breast invasive carcinoma | Female | <65 | III/IV | Chemotherapy | cytoxan | SD | |
| ERLIN2 | deletion | Frame_Shift_Del | novel | c.686_695delNNNNNNNNNN | p.Tyr229TrpfsTer2 | p.Y229Wfs*2 | O94905 | protein_coding | TCGA-A8-A08R-01 | Breast | breast invasive carcinoma | Female | <65 | I/II | Unknown | Unknown | SD | ||
| ERLIN2 | SNV | Missense_Mutation | novel | c.437N>T | p.Glu146Val | p.E146V | O94905 | protein_coding | deleterious(0.03) | probably_damaging(0.987) | TCGA-2W-A8YY-01 | Cervix | cervical & endocervical cancer | Female | <65 | I/II | Chemotherapy | cisplatin | CR |
| ERLIN2 | SNV | Missense_Mutation | novel | c.571N>G | p.Thr191Ala | p.T191A | O94905 | protein_coding | deleterious(0.05) | probably_damaging(0.983) | TCGA-2W-A8YY-01 | Cervix | cervical & endocervical cancer | Female | <65 | I/II | Chemotherapy | cisplatin | CR |
| ERLIN2 | SNV | Missense_Mutation | novel | c.259N>A | p.Asp87Asn | p.D87N | O94905 | protein_coding | deleterious(0) | probably_damaging(0.994) | TCGA-MA-AA41-01 | Cervix | cervical & endocervical cancer | Female | <65 | I/II | Unknown | Unknown | SD |
| ERLIN2 | SNV | Missense_Mutation | c.367N>A | p.Glu123Lys | p.E123K | O94905 | protein_coding | deleterious(0) | probably_damaging(0.989) | TCGA-AA-3510-01 | Colorectum | colon adenocarcinoma | Male | >=65 | I/II | Unknown | Unknown | SD | |
| ERLIN2 | SNV | Missense_Mutation | novel | c.344N>A | p.Leu115His | p.L115H | O94905 | protein_coding | deleterious(0) | probably_damaging(0.998) | TCGA-AA-3950-01 | Colorectum | colon adenocarcinoma | Female | >=65 | I/II | Unknown | Unknown | SD |
| ERLIN2 | SNV | Missense_Mutation | novel | c.20N>C | p.Val7Ala | p.V7A | O94905 | protein_coding | tolerated(0.06) | benign(0) | TCGA-AA-3984-01 | Colorectum | colon adenocarcinoma | Female | <65 | I/II | Unknown | Unknown | SD |
| ERLIN2 | SNV | Missense_Mutation | rs772986050 | c.395N>T | p.Thr132Met | p.T132M | O94905 | protein_coding | deleterious(0) | possibly_damaging(0.761) | TCGA-AM-5820-01 | Colorectum | colon adenocarcinoma | Female | <65 | I/II | Unknown | Unknown | SD |
| Page: 1 2 3 4 |
Top |
Related drugs of malignant transformation related genes |
| Identification of chemicals and drugs interact with genes involved in malignant transfromation |
| (DGIdb 4.0) |
| Entrez ID | Symbol | Category | Interaction Types | Drug Claim Name | Drug Name | PMIDs |
| Page: 1 |

Copyright 2023-Present -The University of Texas Health Science Center at Houston |