
|
|||||
|
 | |
| |
| |
| |
| |
| |
|
Gene: ERLIN1 |
Gene summary for ERLIN1 |
| Gene information | Species | Human | Gene symbol | ERLIN1 | Gene ID | 10613 |
| Gene name | ER lipid raft associated 1 | |
| Gene Alias | C10orf69 | |
| Cytomap | 10q24.31 | |
| Gene Type | protein-coding | GO ID | GO:0006066 | UniProtAcc | D3DR65 |
Top |
Malignant transformation analysis |
| Identification of the aberrant gene expression in precancerous and cancerous lesions by comparing the gene expression of stem-like cells in diseased tissues with normal stem cells |
| Entrez ID | Symbol | Replicates | Species | Organ | Tissue | Adj P-value | Log2FC | Malignancy |
| 10613 | ERLIN1 | HTA11_1938_2000001011 | Human | Colorectum | AD | 4.02e-03 | 4.17e-01 | -0.0811 |
| 10613 | ERLIN1 | HTA11_347_2000001011 | Human | Colorectum | AD | 2.10e-11 | 5.12e-01 | -0.1954 |
| 10613 | ERLIN1 | HTA11_696_2000001011 | Human | Colorectum | AD | 9.48e-04 | 2.95e-01 | -0.1464 |
| 10613 | ERLIN1 | HTA11_99999970781_79442 | Human | Colorectum | MSS | 3.98e-04 | 3.64e-01 | 0.294 |
| 10613 | ERLIN1 | HTA11_99999971662_82457 | Human | Colorectum | MSS | 7.98e-06 | 3.92e-01 | 0.3859 |
| 10613 | ERLIN1 | A015-C-203 | Human | Colorectum | FAP | 1.56e-05 | -2.01e-01 | -0.1294 |
| 10613 | ERLIN1 | A002-C-201 | Human | Colorectum | FAP | 4.16e-02 | -1.64e-01 | 0.0324 |
| 10613 | ERLIN1 | A002-C-205 | Human | Colorectum | FAP | 2.13e-05 | -1.98e-01 | -0.1236 |
| 10613 | ERLIN1 | A015-C-006 | Human | Colorectum | FAP | 2.78e-03 | -2.16e-01 | -0.0994 |
| 10613 | ERLIN1 | A002-C-114 | Human | Colorectum | FAP | 3.40e-04 | -1.93e-01 | -0.1561 |
| 10613 | ERLIN1 | A015-C-104 | Human | Colorectum | FAP | 1.43e-05 | -1.91e-01 | -0.1899 |
| 10613 | ERLIN1 | A002-C-016 | Human | Colorectum | FAP | 8.16e-03 | -1.52e-01 | 0.0521 |
| 10613 | ERLIN1 | A001-C-203 | Human | Colorectum | FAP | 4.34e-04 | -2.14e-01 | -0.0481 |
| 10613 | ERLIN1 | A002-C-116 | Human | Colorectum | FAP | 1.73e-07 | -2.22e-01 | -0.0452 |
| 10613 | ERLIN1 | A014-C-008 | Human | Colorectum | FAP | 1.82e-03 | -2.31e-01 | -0.191 |
| 10613 | ERLIN1 | A018-E-020 | Human | Colorectum | FAP | 5.63e-05 | -2.40e-01 | -0.2034 |
| 10613 | ERLIN1 | F034 | Human | Colorectum | FAP | 4.31e-02 | -1.49e-01 | -0.0665 |
| 10613 | ERLIN1 | LZE4T | Human | Esophagus | ESCC | 2.36e-02 | 9.91e-02 | 0.0811 |
| 10613 | ERLIN1 | LZE5T | Human | Esophagus | ESCC | 1.46e-02 | 1.48e-01 | 0.0514 |
| 10613 | ERLIN1 | LZE24T | Human | Esophagus | ESCC | 3.65e-08 | 2.57e-01 | 0.0596 |
| Page: 1 2 3 4 5 6 |
| Tissue | Expression Dynamics | Abbreviation |
| Colorectum (GSE201348) |  | FAP: Familial adenomatous polyposis |
| CRC: Colorectal cancer | ||
| Colorectum (HTA11) |  | AD: Adenomas |
| SER: Sessile serrated lesions | ||
| MSI-H: Microsatellite-high colorectal cancer | ||
| MSS: Microsatellite stable colorectal cancer | ||
| Esophagus | 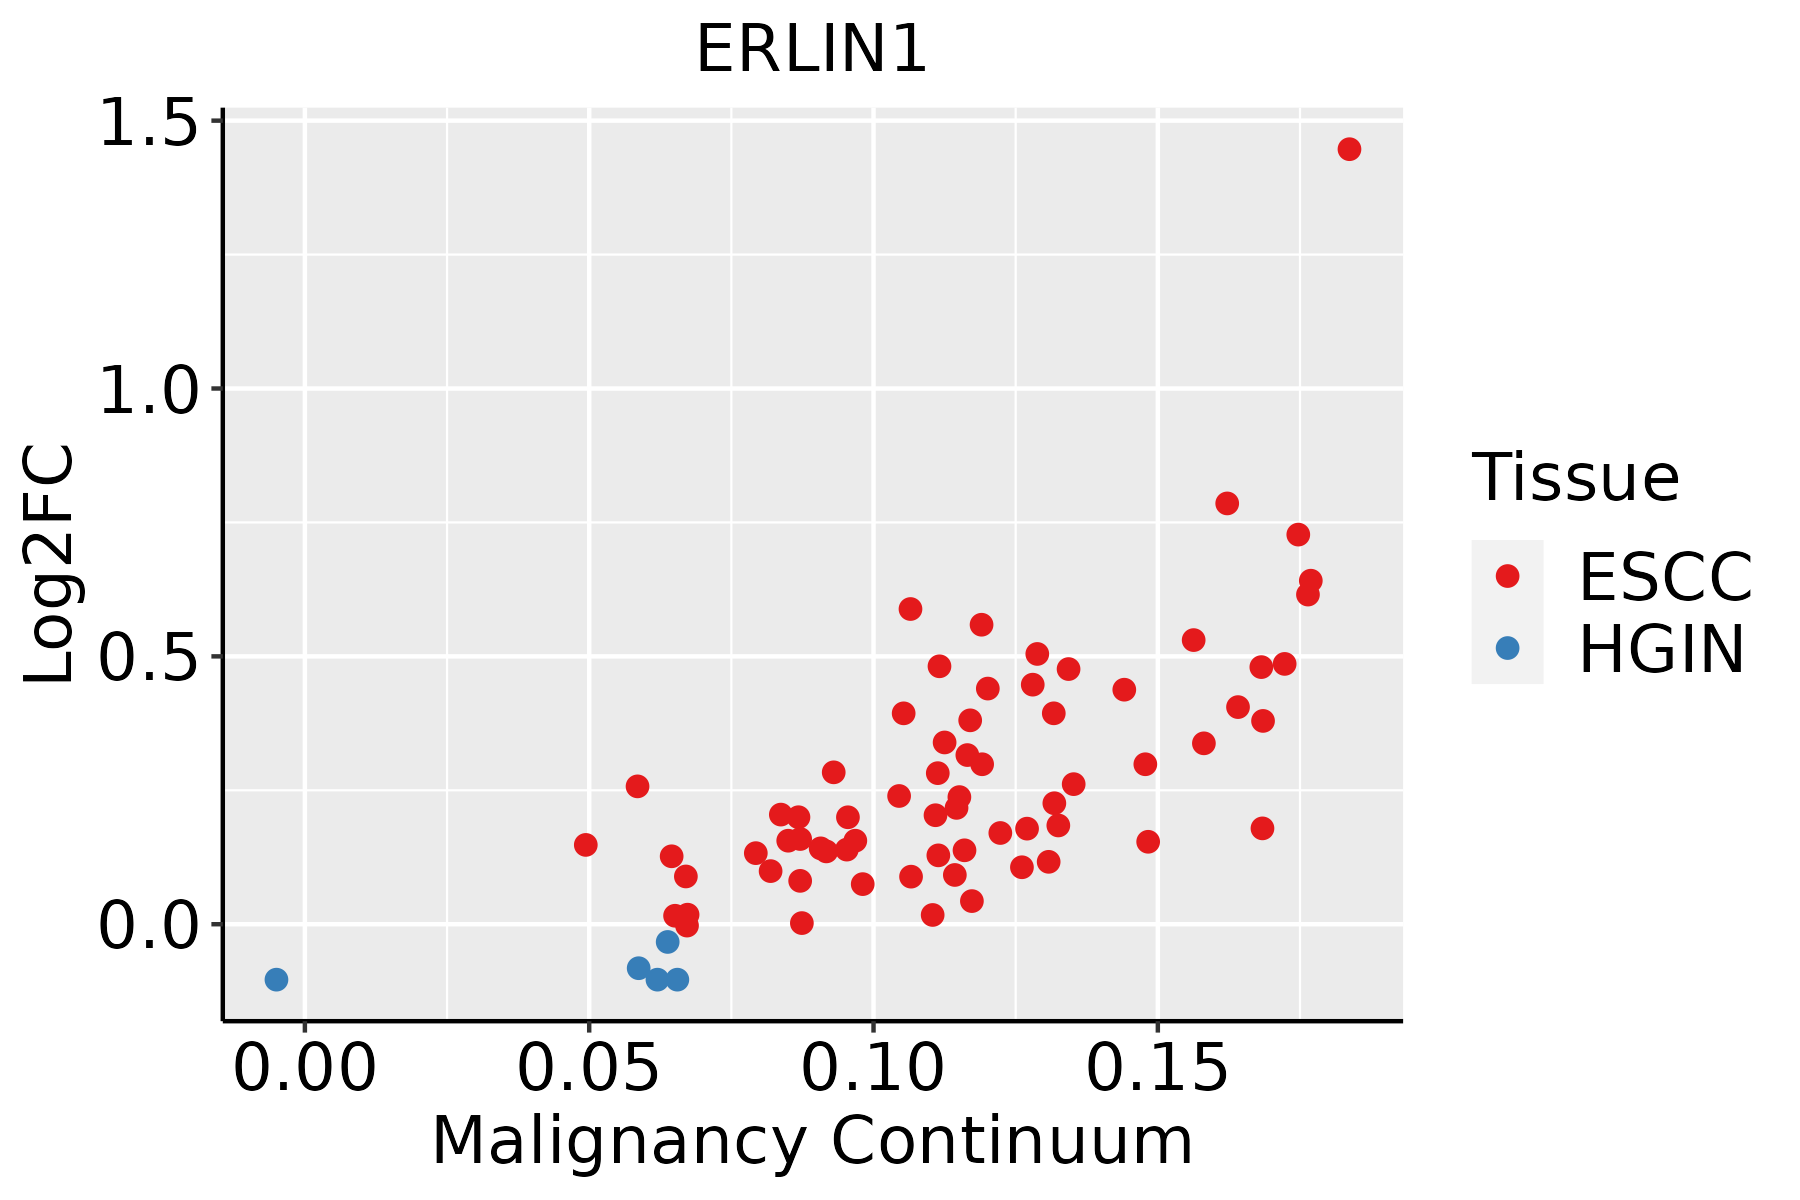 | ESCC: Esophageal squamous cell carcinoma |
| HGIN: High-grade intraepithelial neoplasias | ||
| LGIN: Low-grade intraepithelial neoplasias | ||
| Liver | 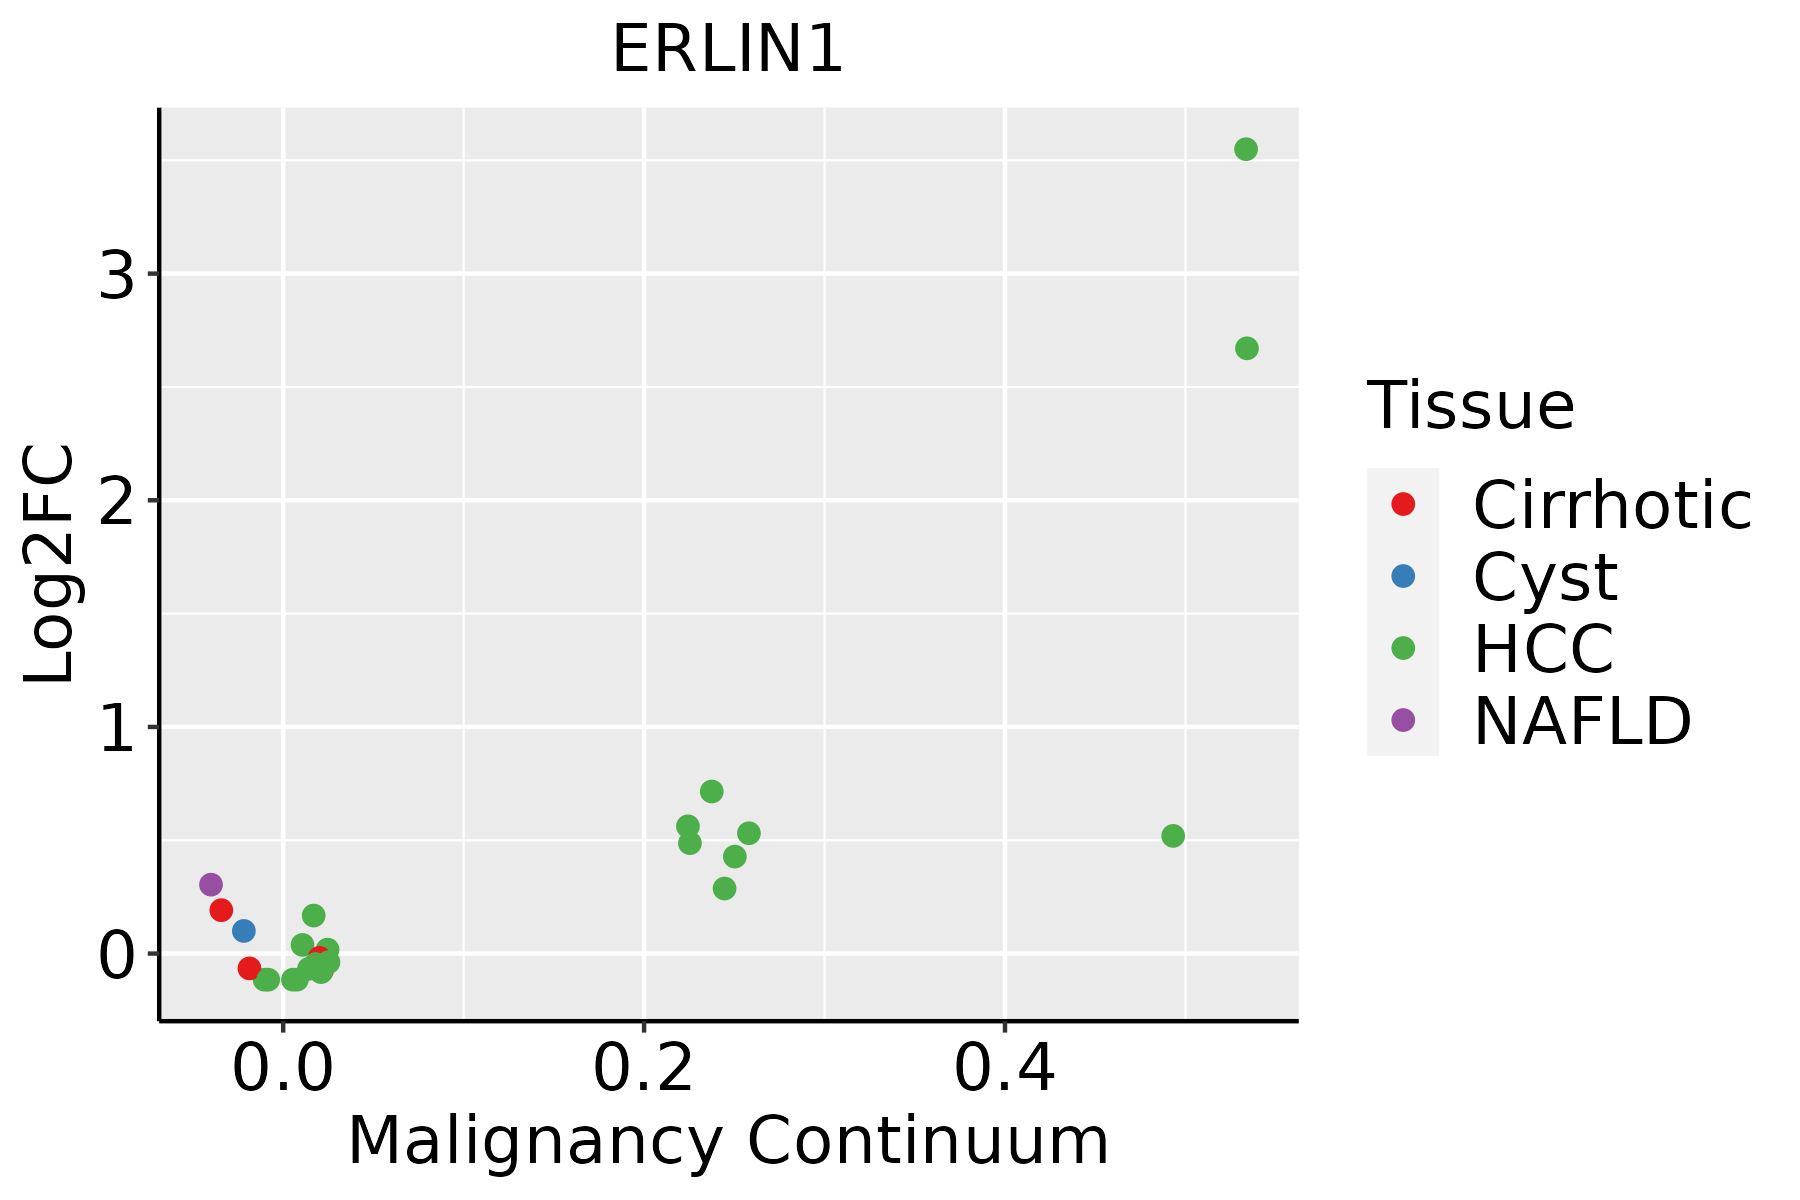 | HCC: Hepatocellular carcinoma |
| NAFLD: Non-alcoholic fatty liver disease | ||
| Oral Cavity | 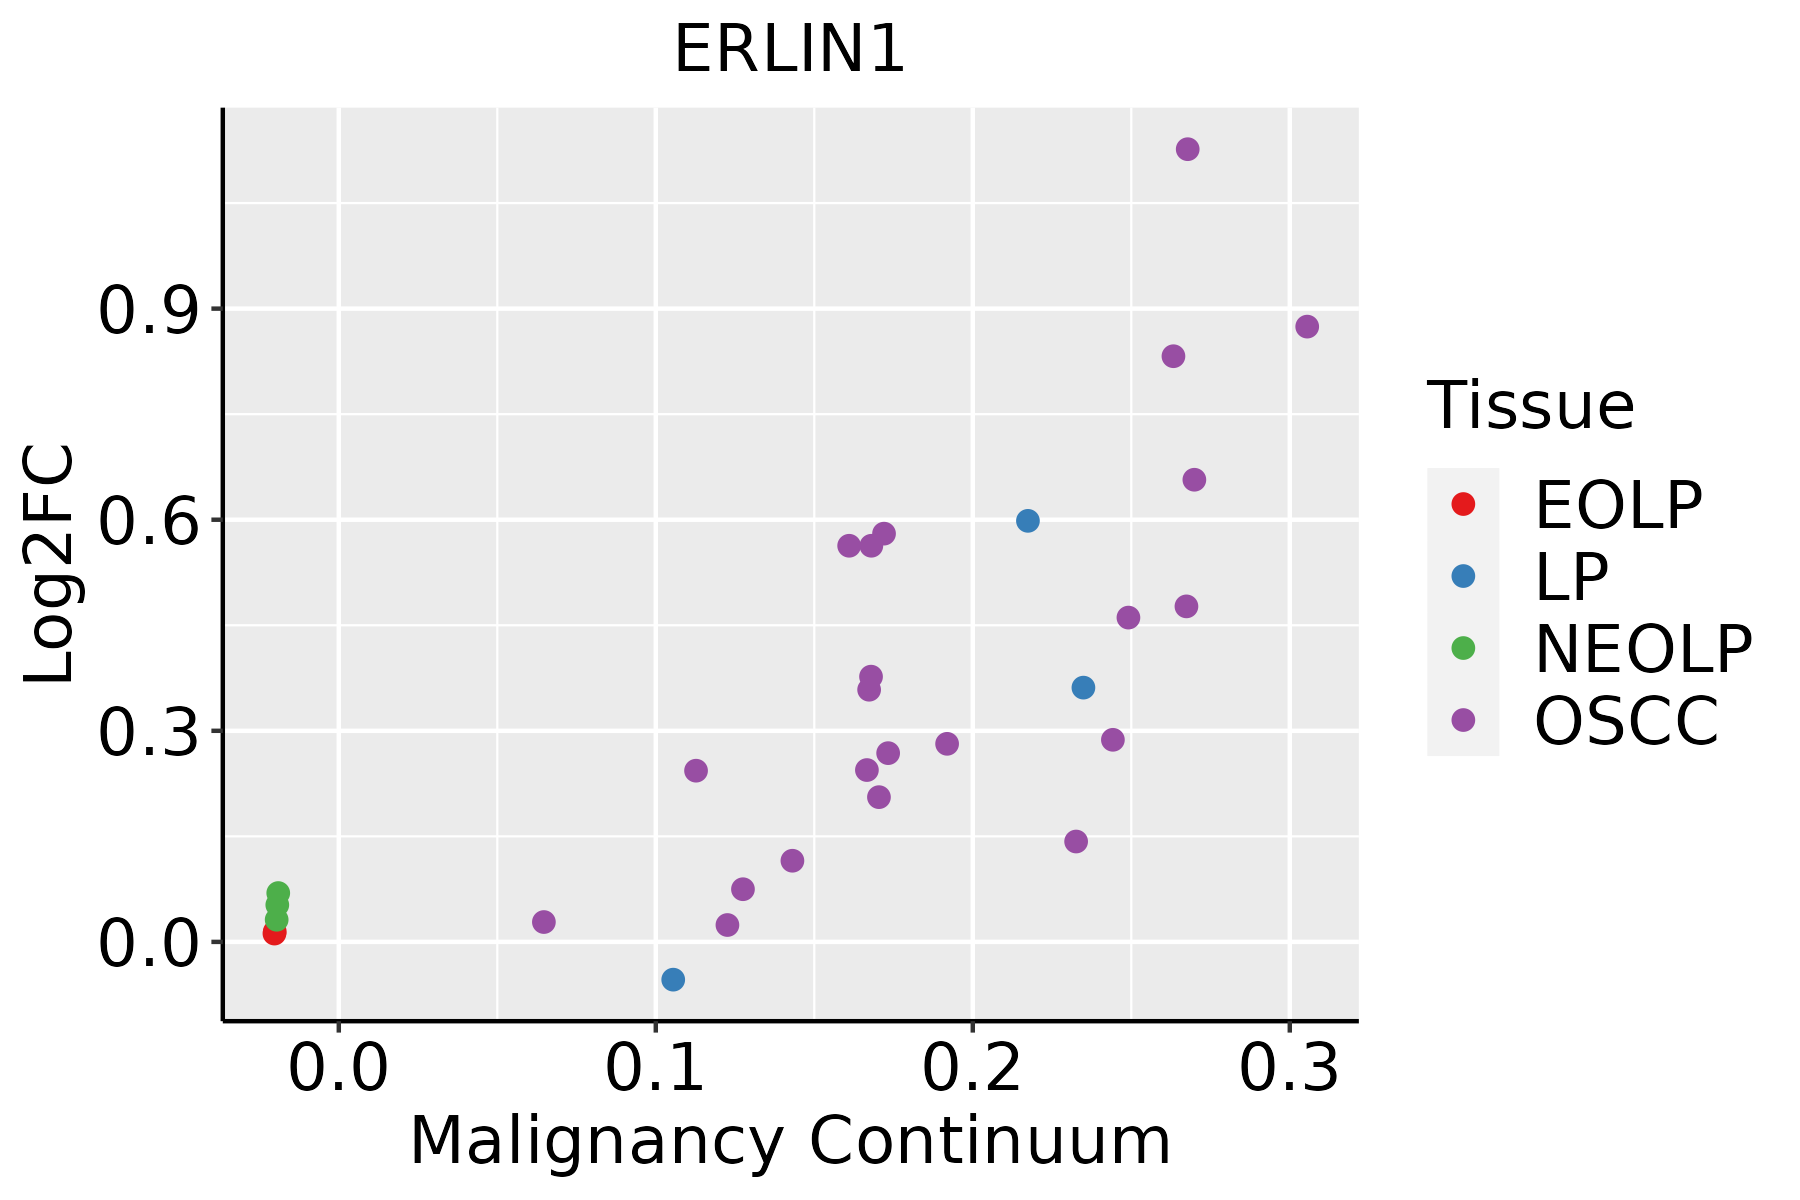 | EOLP: Erosive Oral lichen planus |
| LP: leukoplakia | ||
| NEOLP: Non-erosive oral lichen planus | ||
| OSCC: Oral squamous cell carcinoma | ||
| Thyroid | 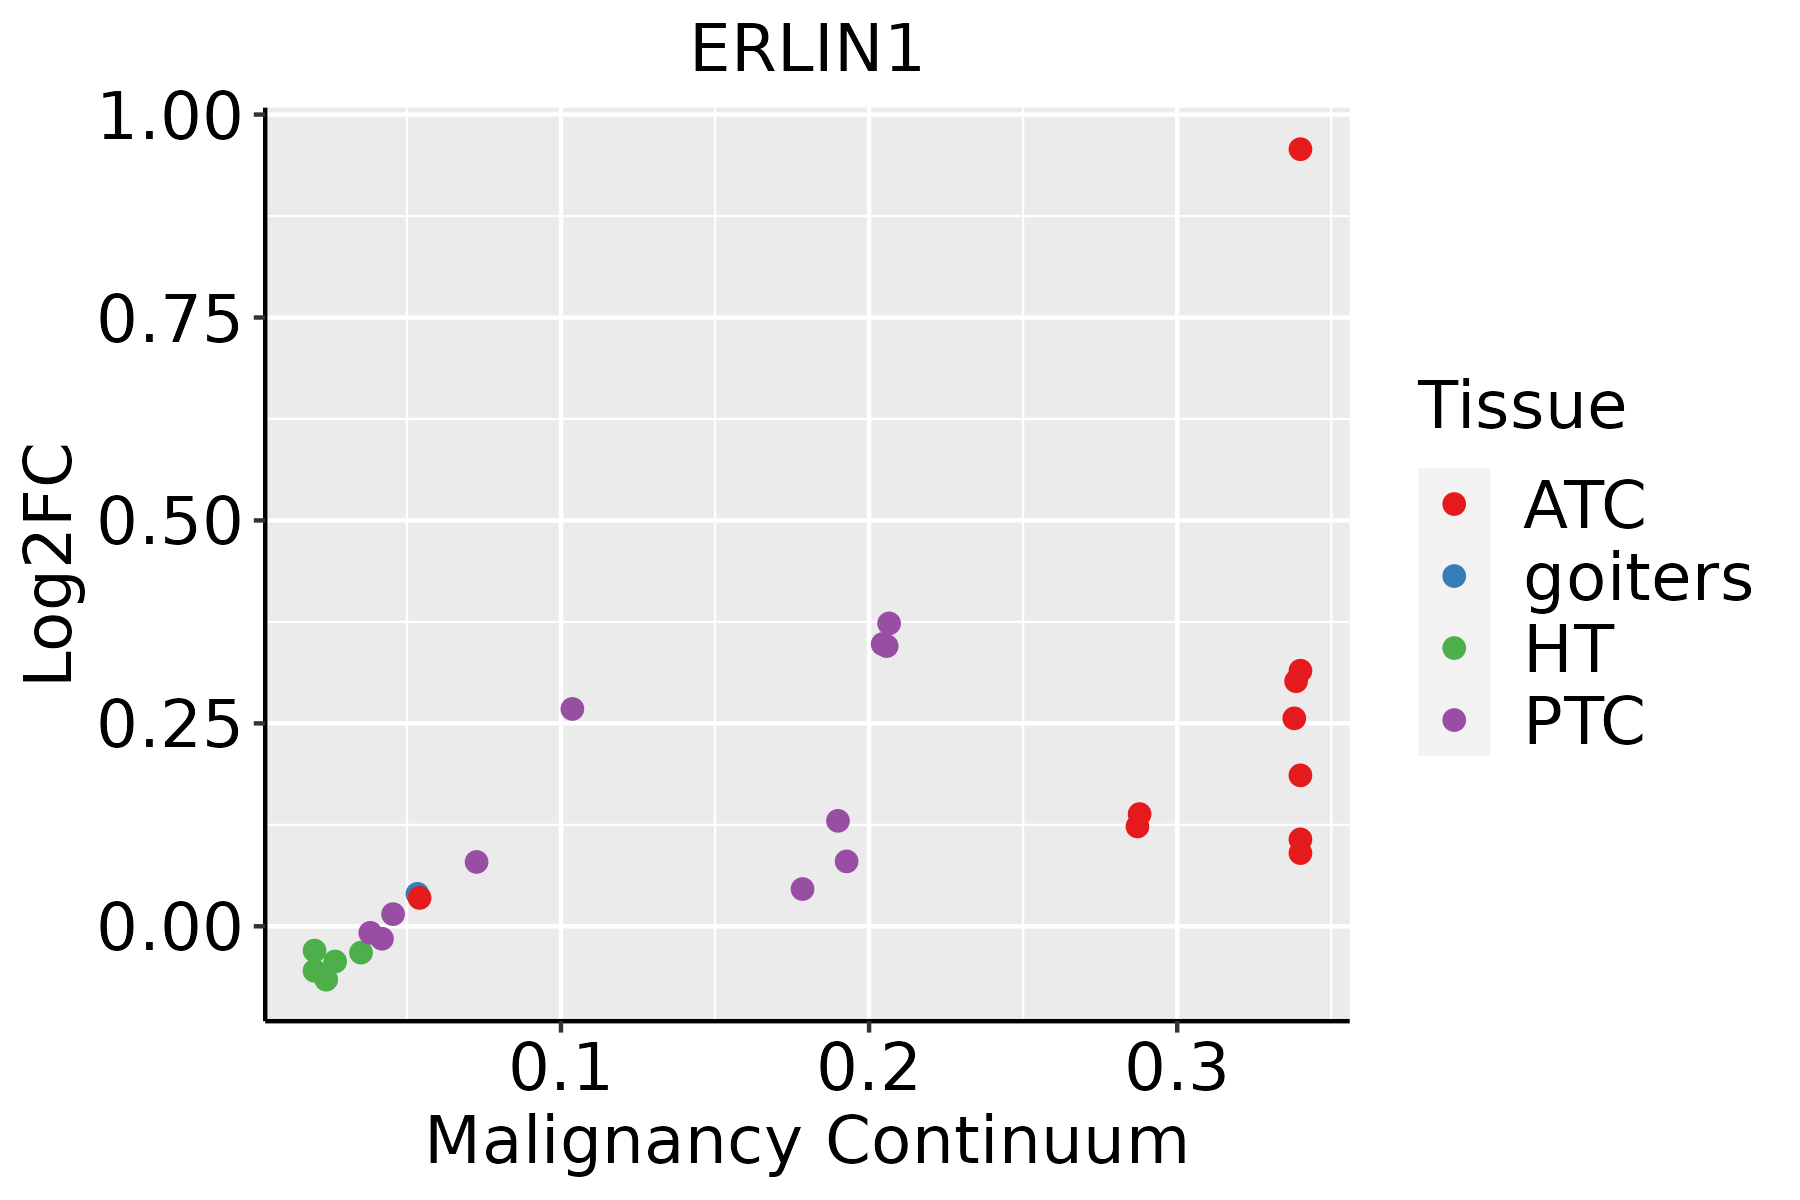 | ATC: Anaplastic thyroid cancer |
| HT: Hashimoto's thyroiditis | ||
| PTC: Papillary thyroid cancer |
| ∗log2FC in expression of this searched gene in stem-like cells from each diseased tissue sample relative to stem-like cells in normal samples in each tissue plotted against the malignancy continuum. Samples are colored based on if they are from different disease stage. |
Top |
Malignant transformation related pathway analysis |
| Find out the enriched GO biological processes and KEGG pathways involved in transition from healthy to precancer to cancer |
| Tissue | Disease Stage | Enriched GO biological Processes |
| Colorectum | AD |  |
| Colorectum | SER |  |
| Colorectum | MSS |  |
| Colorectum | MSI-H |  |
| Colorectum | FAP |  |
| ∗Top 15 enriched GO BP terms are showed in the bar plot of each disease state in each tissue. Each row represents a significant GO biological process which is colored according to the -log10(p.adjust). |
| Page: 1 2 3 4 5 6 7 8 9 |
| GO ID | Tissue | Disease Stage | Description | Gene Ratio | Bg Ratio | pvalue | p.adjust | Count |
| GO:0010498 | Colorectum | AD | proteasomal protein catabolic process | 174/3918 | 490/18723 | 3.18e-14 | 7.66e-12 | 174 |
| GO:0043161 | Colorectum | AD | proteasome-mediated ubiquitin-dependent protein catabolic process | 141/3918 | 412/18723 | 1.77e-10 | 1.68e-08 | 141 |
| GO:0034976 | Colorectum | AD | response to endoplasmic reticulum stress | 90/3918 | 256/18723 | 8.48e-08 | 4.28e-06 | 90 |
| GO:0006066 | Colorectum | AD | alcohol metabolic process | 106/3918 | 353/18723 | 3.02e-05 | 5.57e-04 | 106 |
| GO:0006631 | Colorectum | AD | fatty acid metabolic process | 114/3918 | 390/18723 | 5.58e-05 | 9.44e-04 | 114 |
| GO:0006984 | Colorectum | AD | ER-nucleus signaling pathway | 21/3918 | 46/18723 | 1.47e-04 | 2.08e-03 | 21 |
| GO:0032933 | Colorectum | AD | SREBP signaling pathway | 9/3918 | 15/18723 | 1.11e-03 | 1.01e-02 | 9 |
| GO:0062012 | Colorectum | AD | regulation of small molecule metabolic process | 93/3918 | 334/18723 | 1.46e-03 | 1.24e-02 | 93 |
| GO:0071501 | Colorectum | AD | cellular response to sterol depletion | 9/3918 | 16/18723 | 2.06e-03 | 1.64e-02 | 9 |
| GO:0036503 | Colorectum | AD | ERAD pathway | 34/3918 | 107/18723 | 5.57e-03 | 3.63e-02 | 34 |
| GO:0006991 | Colorectum | AD | response to sterol depletion | 9/3918 | 18/18723 | 5.82e-03 | 3.67e-02 | 9 |
| GO:0008202 | Colorectum | AD | steroid metabolic process | 85/3918 | 319/18723 | 8.07e-03 | 4.75e-02 | 85 |
| GO:00104982 | Colorectum | MSS | proteasomal protein catabolic process | 157/3467 | 490/18723 | 2.39e-13 | 5.25e-11 | 157 |
| GO:00431612 | Colorectum | MSS | proteasome-mediated ubiquitin-dependent protein catabolic process | 127/3467 | 412/18723 | 7.70e-10 | 6.32e-08 | 127 |
| GO:00349762 | Colorectum | MSS | response to endoplasmic reticulum stress | 81/3467 | 256/18723 | 2.65e-07 | 1.10e-05 | 81 |
| GO:00060662 | Colorectum | MSS | alcohol metabolic process | 92/3467 | 353/18723 | 2.57e-04 | 3.46e-03 | 92 |
| GO:00069842 | Colorectum | MSS | ER-nucleus signaling pathway | 19/3467 | 46/18723 | 2.79e-04 | 3.69e-03 | 19 |
| GO:00066312 | Colorectum | MSS | fatty acid metabolic process | 95/3467 | 390/18723 | 2.20e-03 | 1.84e-02 | 95 |
| GO:00620121 | Colorectum | MSS | regulation of small molecule metabolic process | 83/3467 | 334/18723 | 2.25e-03 | 1.85e-02 | 83 |
| GO:00329332 | Colorectum | MSS | SREBP signaling pathway | 8/3467 | 15/18723 | 2.54e-03 | 2.02e-02 | 8 |
| Page: 1 2 3 4 5 6 7 8 |
| Pathway ID | Tissue | Disease Stage | Description | Gene Ratio | Bg Ratio | pvalue | p.adjust | qvalue | Count |
| Page: 1 |
Top |
Cell-cell communication analysis |
| Identification of potential cell-cell interactions between two cell types and their ligand-receptor pairs for different disease states |
| Ligand | Receptor | LRpair | Pathway | Tissue | Disease Stage |
| Page: 1 |
Top |
Single-cell gene regulatory network inference analysis |
| Find out the significant the regulons (TFs) and the target genes of each regulon across cell types for different disease states |
| TF | Cell Type | Tissue | Disease Stage | Target Gene | RSS | Regulon Activity |
| ∗The dot plots of a searched regulon are shown for all cell subpopulations in each disease state of each tissue based on the regulon specific score inferred using pySCENIC and by calculating the average expression. |
| Page: 1 |
Top |
Somatic mutation of malignant transformation related genes |
| Annotation of somatic variants for genes involved in malignant transformation |
| Hugo Symbol | Variant Class | Variant Classification | dbSNP RS | HGVSc | HGVSp | HGVSp Short | SWISSPROT | BIOTYPE | SIFT | PolyPhen | Tumor Sample Barcode | Tissue | Histology | Sex | Age | Stage | Therapy Types | Drugs | Outcome |
| ERLIN1 | SNV | Missense_Mutation | novel | c.888N>C | p.Lys296Asn | p.K296N | O75477 | protein_coding | deleterious(0) | probably_damaging(0.999) | TCGA-A2-A0CL-01 | Breast | breast invasive carcinoma | Female | <65 | III/IV | Chemotherapy | cytoxan | SD |
| ERLIN1 | SNV | Missense_Mutation | c.556N>C | p.Glu186Gln | p.E186Q | O75477 | protein_coding | deleterious(0.04) | probably_damaging(0.995) | TCGA-D8-A27G-01 | Breast | breast invasive carcinoma | Female | >=65 | I/II | Unknown | Unknown | SD | |
| ERLIN1 | SNV | Missense_Mutation | c.367N>T | p.His123Tyr | p.H123Y | O75477 | protein_coding | tolerated(0.07) | probably_damaging(0.962) | TCGA-AZ-6599-01 | Colorectum | colon adenocarcinoma | Male | >=65 | I/II | Unknown | Unknown | SD | |
| ERLIN1 | SNV | Missense_Mutation | c.952N>A | p.Asp318Asn | p.D318N | O75477 | protein_coding | tolerated_low_confidence(0.27) | benign(0.015) | TCGA-CA-6717-01 | Colorectum | colon adenocarcinoma | Male | <65 | I/II | Chemotherapy | oxaliplatin | CR | |
| ERLIN1 | SNV | Missense_Mutation | c.600N>T | p.Gln200His | p.Q200H | O75477 | protein_coding | deleterious(0.02) | probably_damaging(0.994) | TCGA-CA-6717-01 | Colorectum | colon adenocarcinoma | Male | <65 | I/II | Chemotherapy | oxaliplatin | CR | |
| ERLIN1 | SNV | Missense_Mutation | c.602N>G | p.Lys201Arg | p.K201R | O75477 | protein_coding | tolerated(0.5) | benign(0.01) | TCGA-CA-6718-01 | Colorectum | colon adenocarcinoma | Male | <65 | I/II | Unknown | Unknown | PD | |
| ERLIN1 | SNV | Missense_Mutation | novel | c.260N>G | p.Tyr87Cys | p.Y87C | O75477 | protein_coding | deleterious(0.01) | probably_damaging(0.992) | TCGA-A5-A0G1-01 | Endometrium | uterine corpus endometrioid carcinoma | Female | >=65 | I/II | Unknown | Unknown | SD |
| ERLIN1 | SNV | Missense_Mutation | c.23N>G | p.Val8Gly | p.V8G | O75477 | protein_coding | tolerated(0.2) | benign(0.026) | TCGA-AP-A059-01 | Endometrium | uterine corpus endometrioid carcinoma | Female | >=65 | I/II | Unknown | Unknown | SD | |
| ERLIN1 | SNV | Missense_Mutation | novel | c.768N>T | p.Glu256Asp | p.E256D | O75477 | protein_coding | deleterious(0.03) | benign(0.155) | TCGA-AP-A0LM-01 | Endometrium | uterine corpus endometrioid carcinoma | Female | <65 | III/IV | Chemotherapy | cisplatin | SD |
| ERLIN1 | SNV | Missense_Mutation | rs774701385 | c.688C>T | p.Arg230Trp | p.R230W | O75477 | protein_coding | deleterious(0.02) | benign(0) | TCGA-AX-A2HC-01 | Endometrium | uterine corpus endometrioid carcinoma | Female | <65 | III/IV | Chemotherapy | paclitaxel | PD |
| Page: 1 2 3 |
Top |
Related drugs of malignant transformation related genes |
| Identification of chemicals and drugs interact with genes involved in malignant transfromation |
| (DGIdb 4.0) |
| Entrez ID | Symbol | Category | Interaction Types | Drug Claim Name | Drug Name | PMIDs |
| Page: 1 |

Copyright 2023-Present -The University of Texas Health Science Center at Houston |