
|
|||||
|
 | |
| |
| |
| |
| |
| |
|
Gene: ERLEC1 |
Gene summary for ERLEC1 |
| Gene information | Species | Human | Gene symbol | ERLEC1 | Gene ID | 27248 |
| Gene name | endoplasmic reticulum lectin 1 | |
| Gene Alias | C2orf30 | |
| Cytomap | 2p16.2 | |
| Gene Type | protein-coding | GO ID | GO:0006508 | UniProtAcc | Q96DZ1 |
Top |
Malignant transformation analysis |
| Identification of the aberrant gene expression in precancerous and cancerous lesions by comparing the gene expression of stem-like cells in diseased tissues with normal stem cells |
| Entrez ID | Symbol | Replicates | Species | Organ | Tissue | Adj P-value | Log2FC | Malignancy |
| 27248 | ERLEC1 | LZE2T | Human | Esophagus | ESCC | 8.61e-04 | 7.59e-01 | 0.082 |
| 27248 | ERLEC1 | LZE4T | Human | Esophagus | ESCC | 3.47e-13 | 6.30e-01 | 0.0811 |
| 27248 | ERLEC1 | LZE5T | Human | Esophagus | ESCC | 1.62e-03 | 6.24e-01 | 0.0514 |
| 27248 | ERLEC1 | LZE7T | Human | Esophagus | ESCC | 8.90e-10 | 5.78e-01 | 0.0667 |
| 27248 | ERLEC1 | LZE8T | Human | Esophagus | ESCC | 2.38e-08 | 3.55e-01 | 0.067 |
| 27248 | ERLEC1 | LZE20T | Human | Esophagus | ESCC | 9.57e-08 | 2.08e-01 | 0.0662 |
| 27248 | ERLEC1 | LZE24T | Human | Esophagus | ESCC | 4.91e-29 | 9.17e-01 | 0.0596 |
| 27248 | ERLEC1 | LZE6T | Human | Esophagus | ESCC | 2.59e-09 | 5.05e-01 | 0.0845 |
| 27248 | ERLEC1 | P1T-E | Human | Esophagus | ESCC | 2.43e-14 | 8.44e-01 | 0.0875 |
| 27248 | ERLEC1 | P2T-E | Human | Esophagus | ESCC | 4.07e-66 | 1.19e+00 | 0.1177 |
| 27248 | ERLEC1 | P4T-E | Human | Esophagus | ESCC | 8.22e-40 | 9.68e-01 | 0.1323 |
| 27248 | ERLEC1 | P5T-E | Human | Esophagus | ESCC | 1.46e-19 | 4.14e-01 | 0.1327 |
| 27248 | ERLEC1 | P8T-E | Human | Esophagus | ESCC | 1.95e-56 | 9.54e-01 | 0.0889 |
| 27248 | ERLEC1 | P9T-E | Human | Esophagus | ESCC | 1.38e-19 | 7.08e-01 | 0.1131 |
| 27248 | ERLEC1 | P10T-E | Human | Esophagus | ESCC | 1.34e-51 | 9.13e-01 | 0.116 |
| 27248 | ERLEC1 | P11T-E | Human | Esophagus | ESCC | 1.24e-20 | 1.13e+00 | 0.1426 |
| 27248 | ERLEC1 | P12T-E | Human | Esophagus | ESCC | 4.44e-44 | 8.60e-01 | 0.1122 |
| 27248 | ERLEC1 | P15T-E | Human | Esophagus | ESCC | 2.01e-26 | 6.93e-01 | 0.1149 |
| 27248 | ERLEC1 | P16T-E | Human | Esophagus | ESCC | 1.12e-71 | 1.28e+00 | 0.1153 |
| 27248 | ERLEC1 | P17T-E | Human | Esophagus | ESCC | 1.35e-06 | 5.70e-01 | 0.1278 |
| Page: 1 2 3 4 5 6 7 |
| Tissue | Expression Dynamics | Abbreviation |
| Esophagus | 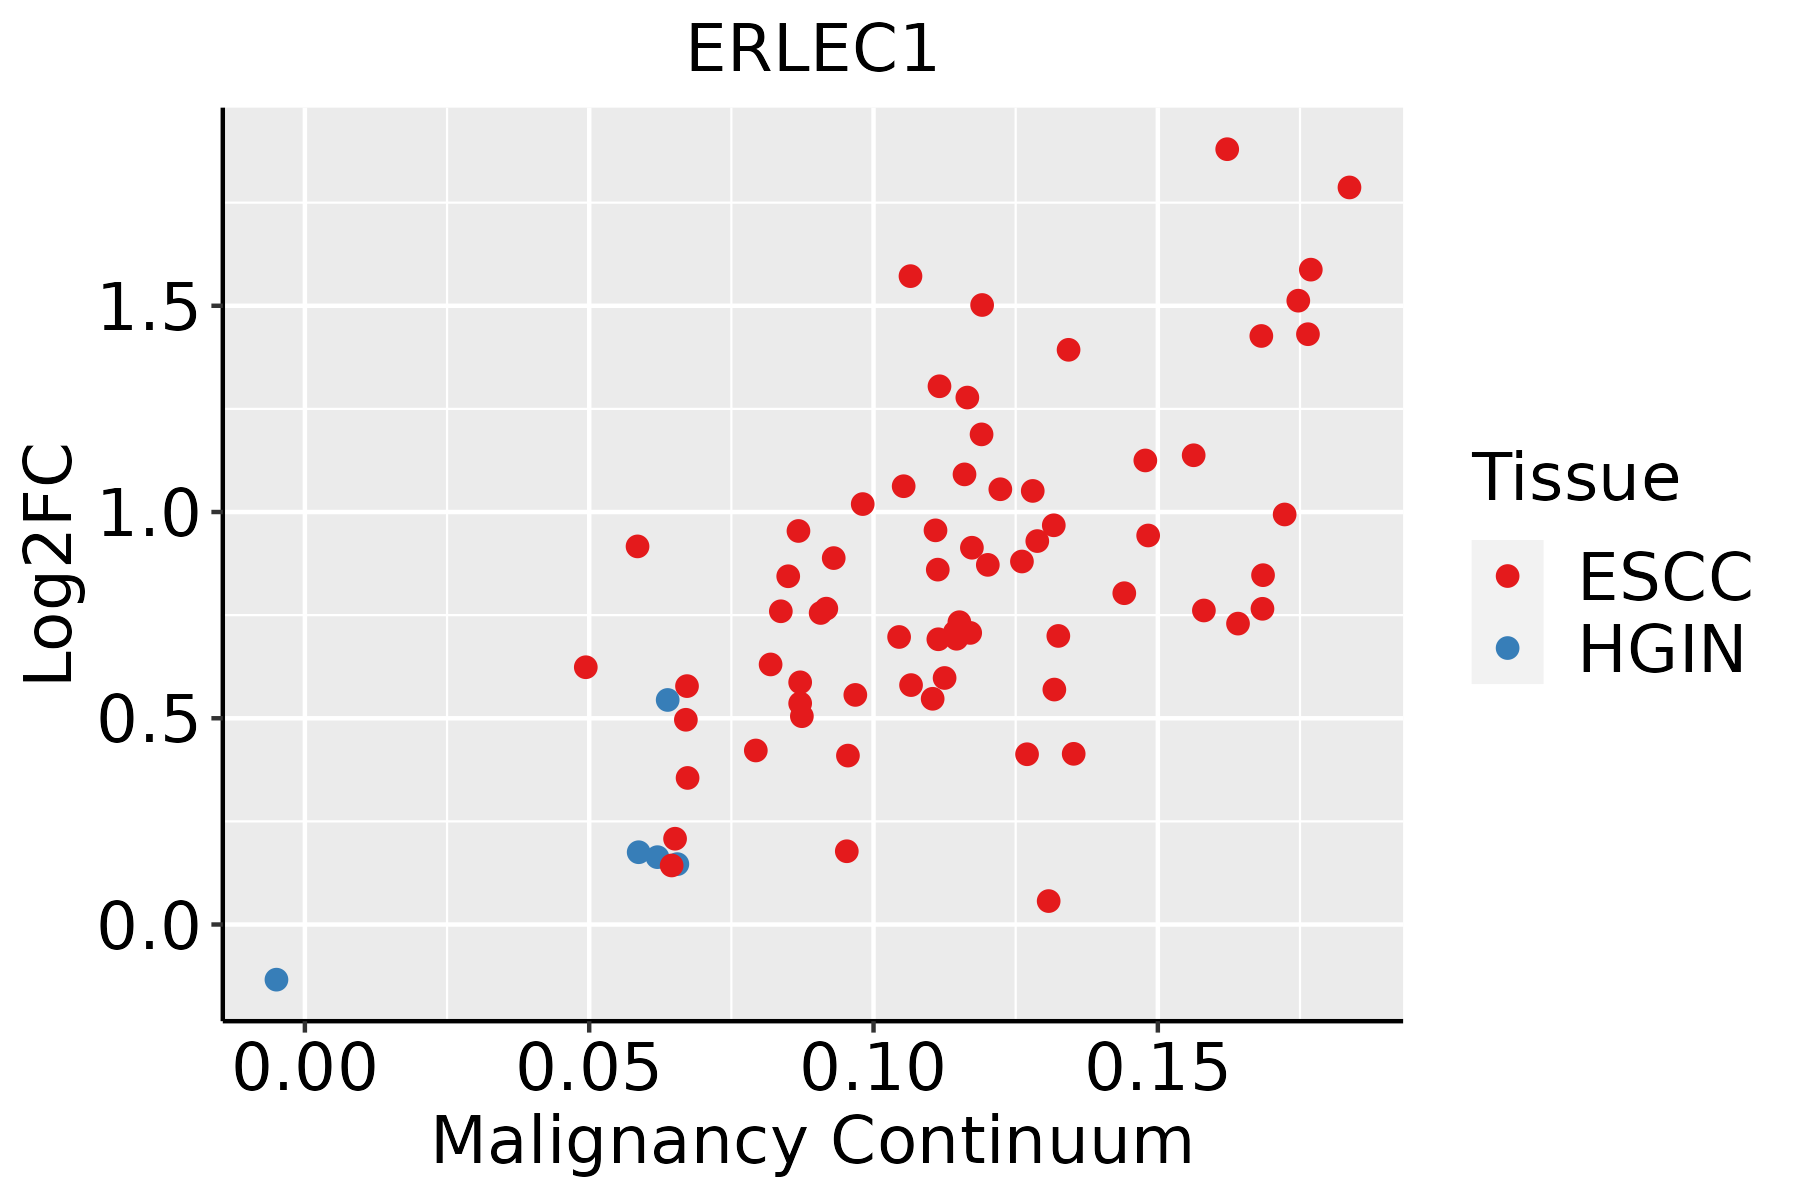 | ESCC: Esophageal squamous cell carcinoma |
| HGIN: High-grade intraepithelial neoplasias | ||
| LGIN: Low-grade intraepithelial neoplasias | ||
| Liver |  | HCC: Hepatocellular carcinoma |
| NAFLD: Non-alcoholic fatty liver disease | ||
| Oral Cavity | 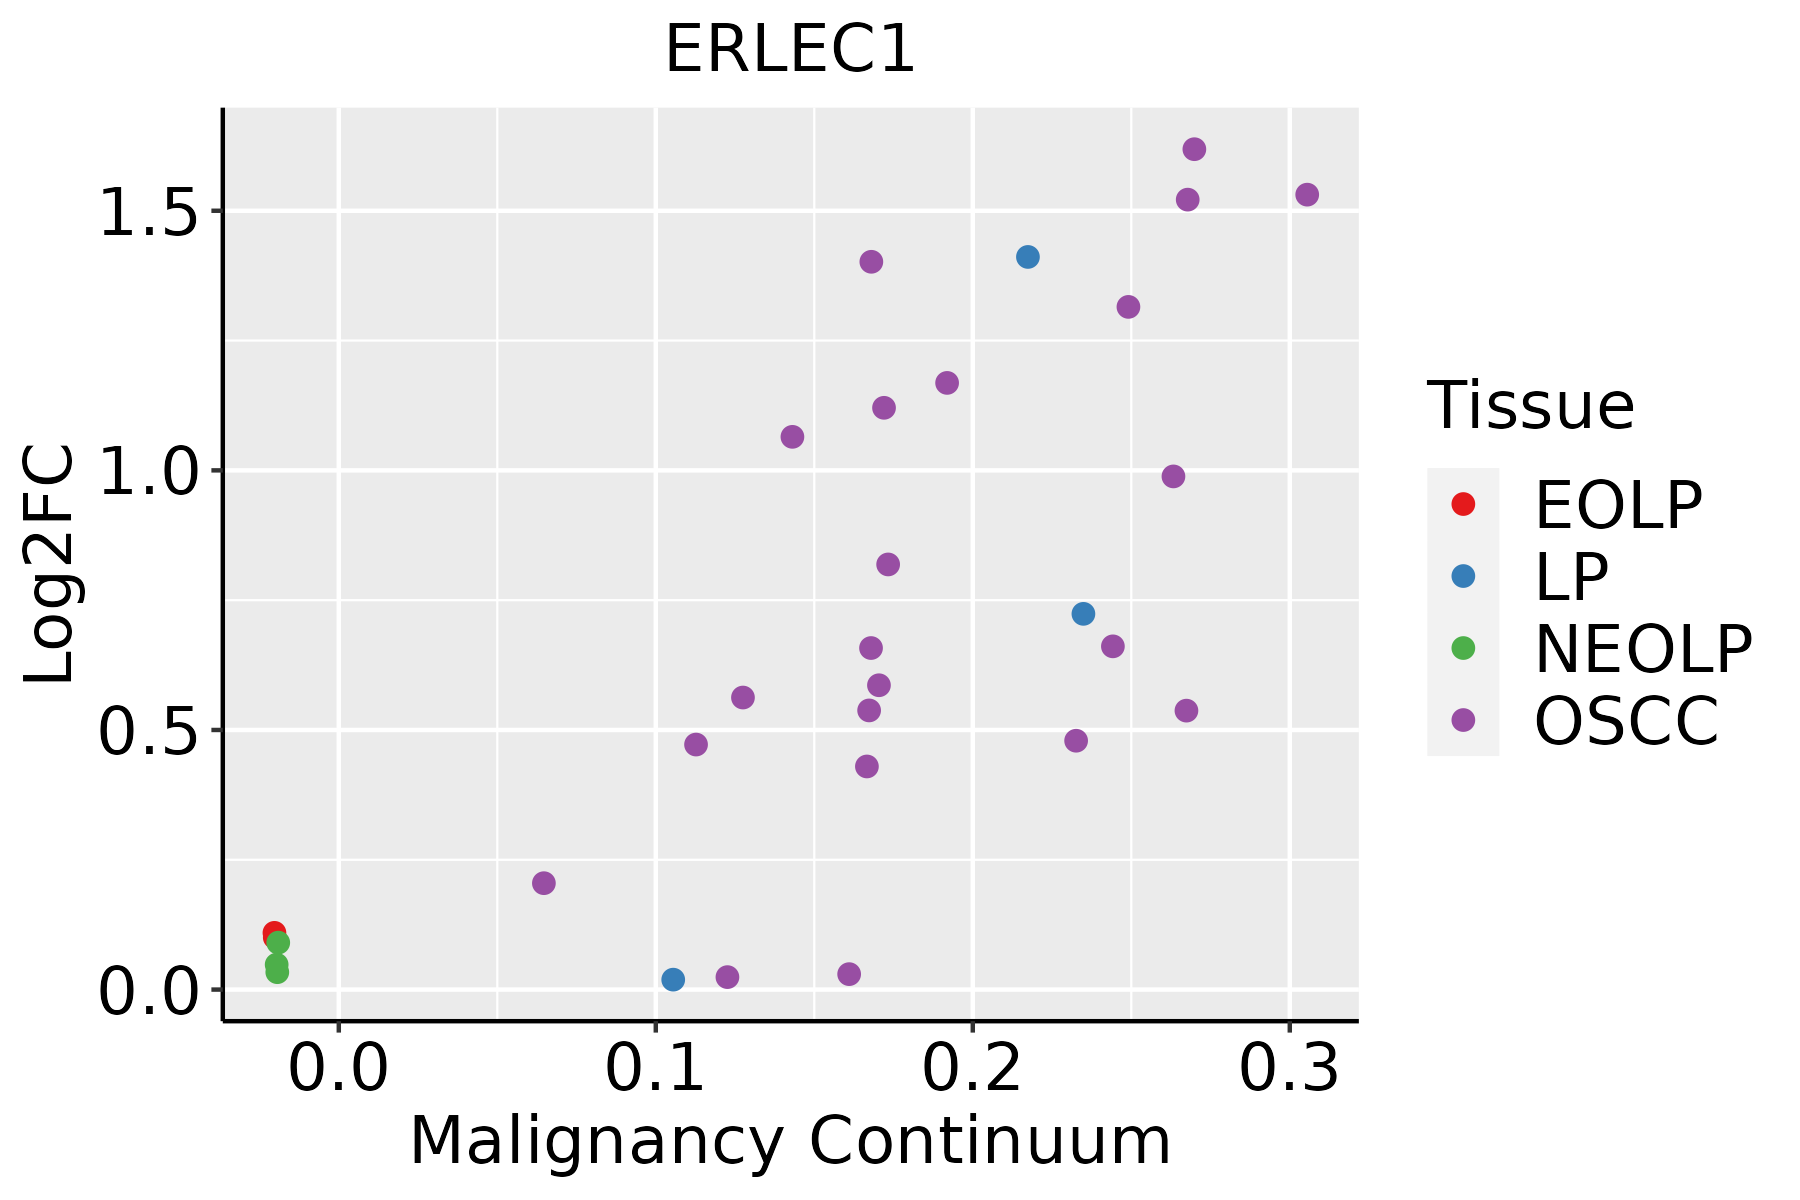 | EOLP: Erosive Oral lichen planus |
| LP: leukoplakia | ||
| NEOLP: Non-erosive oral lichen planus | ||
| OSCC: Oral squamous cell carcinoma | ||
| Prostate | 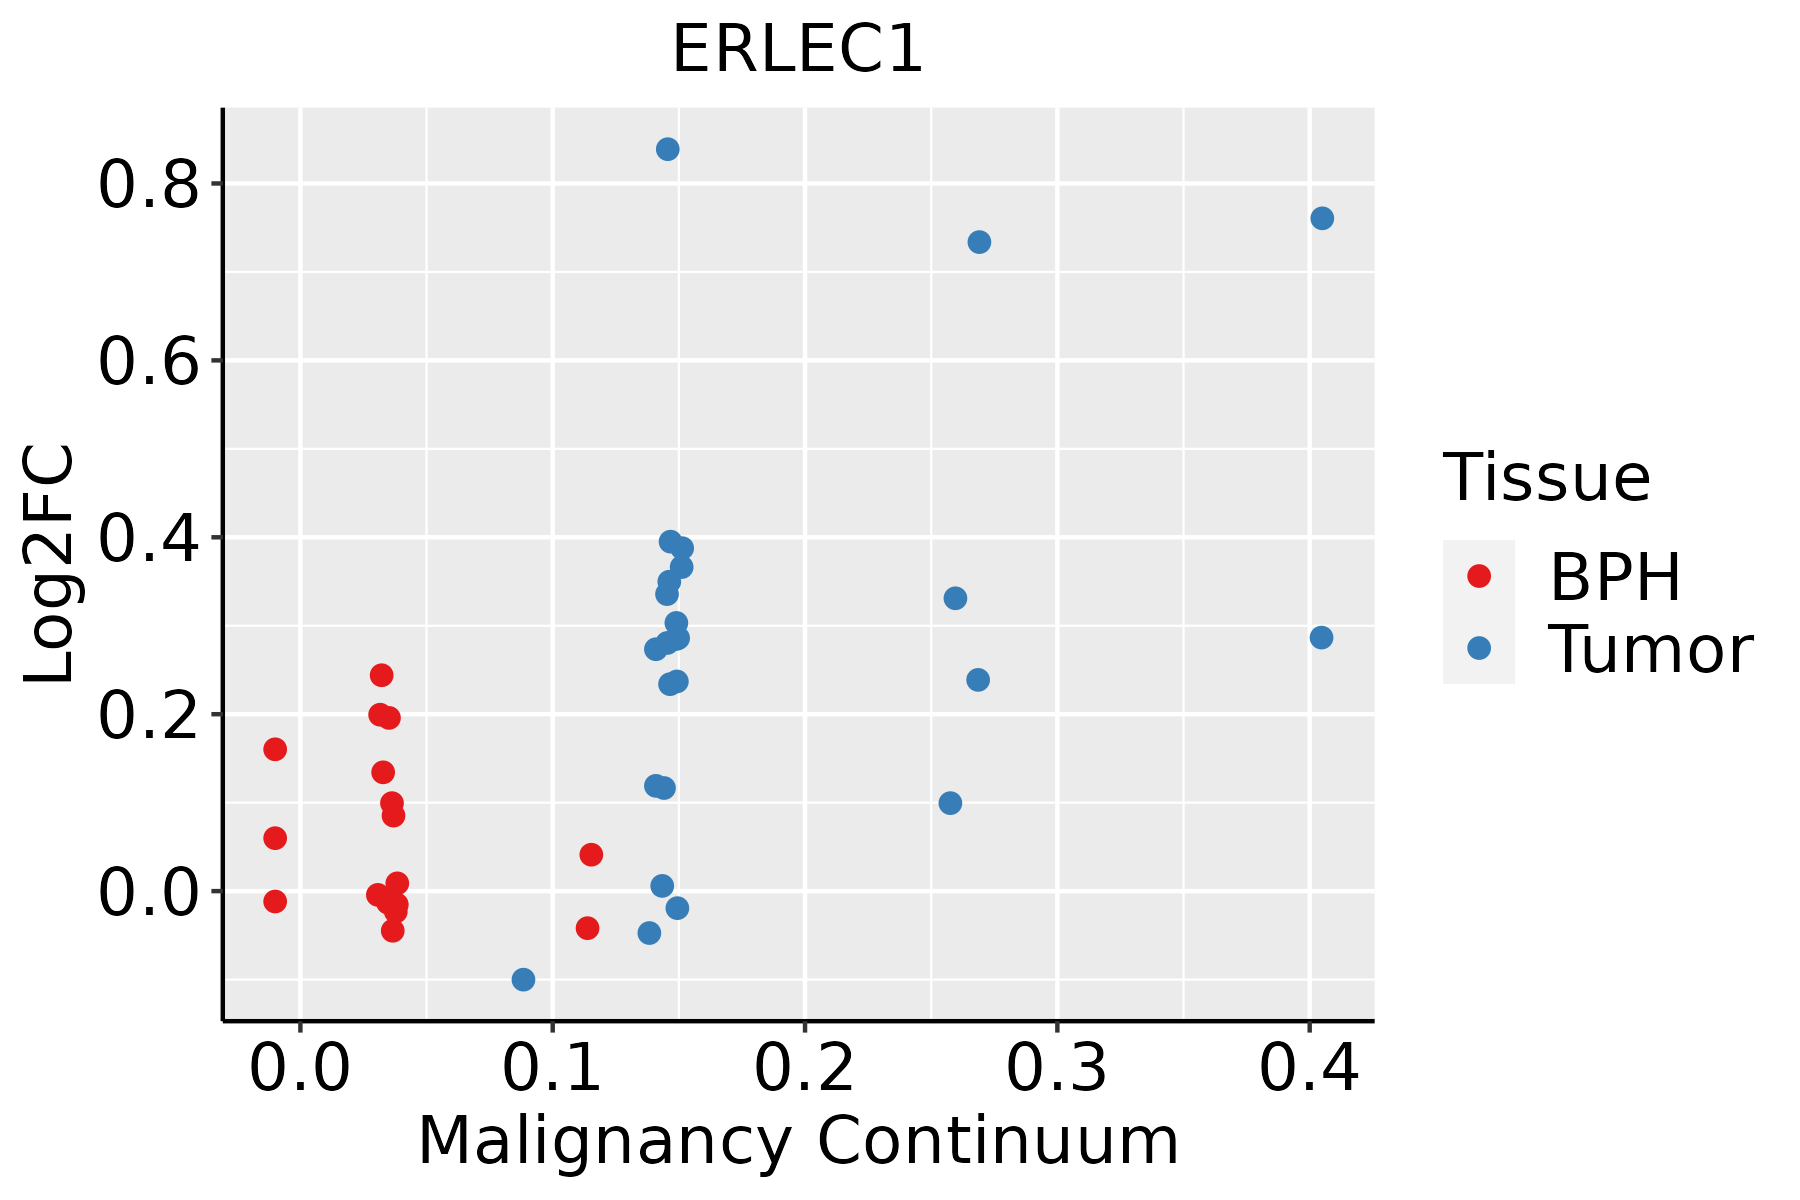 | BPH: Benign Prostatic Hyperplasia |
| Skin | 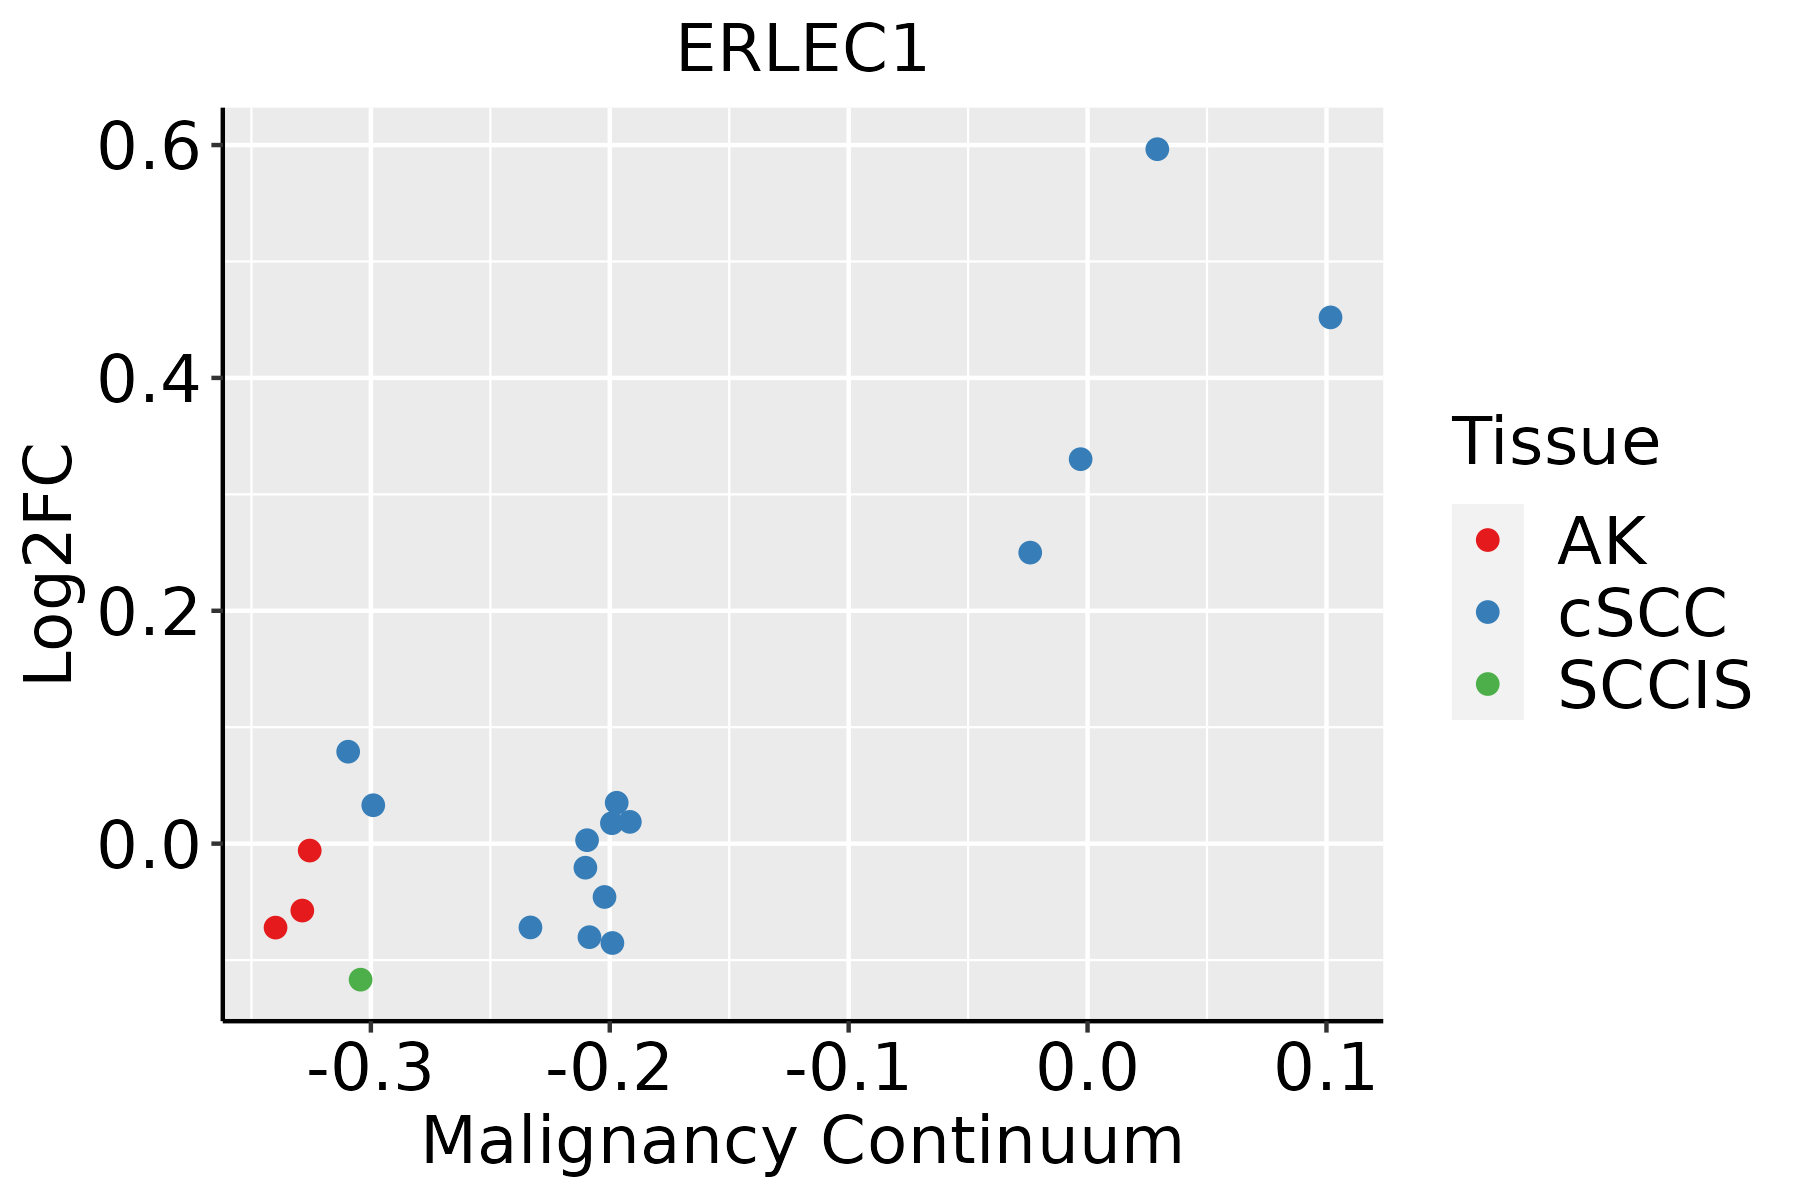 | AK: Actinic keratosis |
| cSCC: Cutaneous squamous cell carcinoma | ||
| SCCIS:squamous cell carcinoma in situ | ||
| Thyroid | 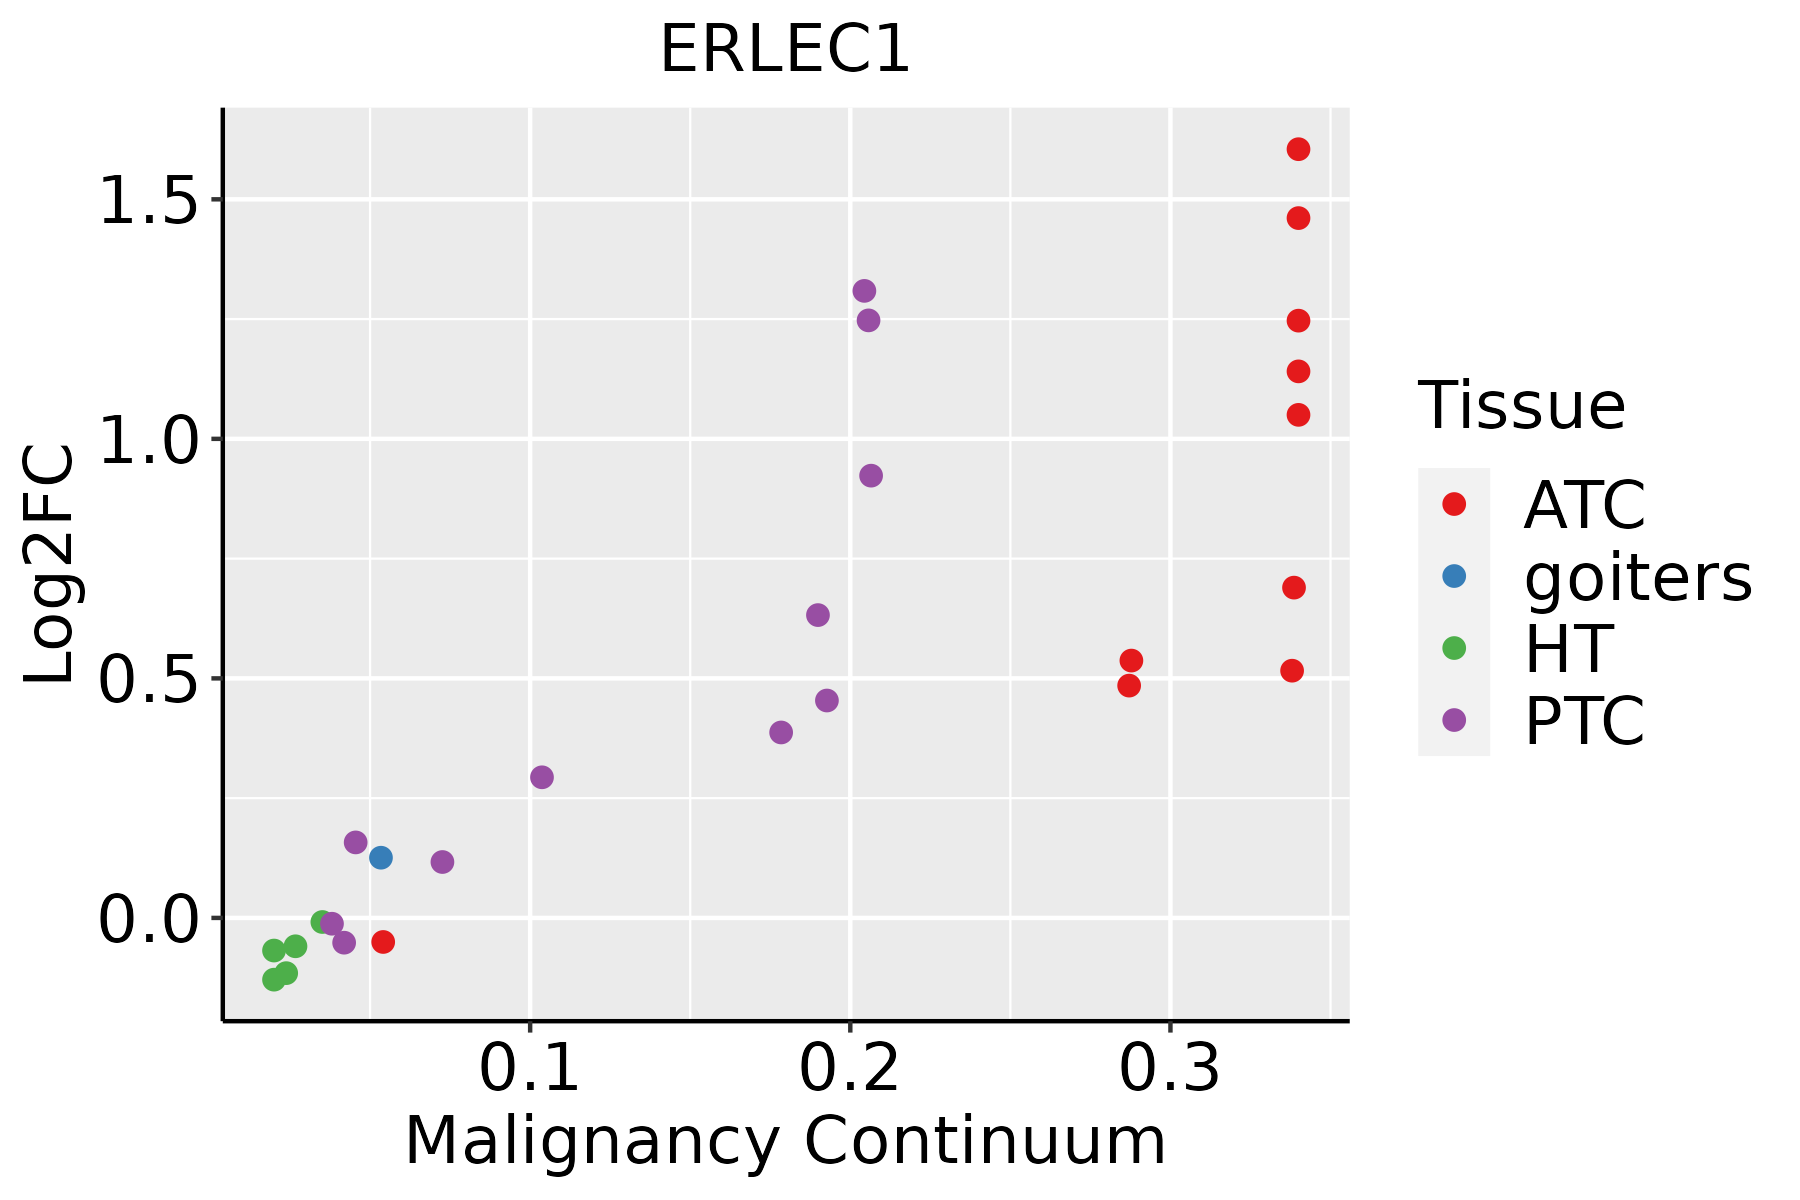 | ATC: Anaplastic thyroid cancer |
| HT: Hashimoto's thyroiditis | ||
| PTC: Papillary thyroid cancer |
| ∗log2FC in expression of this searched gene in stem-like cells from each diseased tissue sample relative to stem-like cells in normal samples in each tissue plotted against the malignancy continuum. Samples are colored based on if they are from different disease stage. |
Top |
Malignant transformation related pathway analysis |
| Find out the enriched GO biological processes and KEGG pathways involved in transition from healthy to precancer to cancer |
| Tissue | Disease Stage | Enriched GO biological Processes |
| Colorectum | AD |  |
| Colorectum | SER |  |
| Colorectum | MSS |  |
| Colorectum | MSI-H |  |
| Colorectum | FAP |  |
| ∗Top 15 enriched GO BP terms are showed in the bar plot of each disease state in each tissue. Each row represents a significant GO biological process which is colored according to the -log10(p.adjust). |
| Page: 1 2 3 4 5 6 7 8 9 |
| GO ID | Tissue | Disease Stage | Description | Gene Ratio | Bg Ratio | pvalue | p.adjust | Count |
| GO:0010498111 | Esophagus | ESCC | proteasomal protein catabolic process | 369/8552 | 490/18723 | 1.13e-41 | 1.80e-38 | 369 |
| GO:0043161111 | Esophagus | ESCC | proteasome-mediated ubiquitin-dependent protein catabolic process | 312/8552 | 412/18723 | 3.53e-36 | 4.48e-33 | 312 |
| GO:003238618 | Esophagus | ESCC | regulation of intracellular transport | 243/8552 | 337/18723 | 3.20e-23 | 7.25e-21 | 243 |
| GO:0034976111 | Esophagus | ESCC | response to endoplasmic reticulum stress | 192/8552 | 256/18723 | 7.15e-22 | 1.30e-19 | 192 |
| GO:0033157110 | Esophagus | ESCC | regulation of intracellular protein transport | 169/8552 | 229/18723 | 3.31e-18 | 3.23e-16 | 169 |
| GO:0035966111 | Esophagus | ESCC | response to topologically incorrect protein | 125/8552 | 159/18723 | 1.44e-17 | 1.27e-15 | 125 |
| GO:0006986111 | Esophagus | ESCC | response to unfolded protein | 107/8552 | 137/18723 | 7.01e-15 | 3.87e-13 | 107 |
| GO:0035967111 | Esophagus | ESCC | cellular response to topologically incorrect protein | 90/8552 | 116/18723 | 1.94e-12 | 8.11e-11 | 90 |
| GO:003650315 | Esophagus | ESCC | ERAD pathway | 82/8552 | 107/18723 | 5.80e-11 | 1.84e-09 | 82 |
| GO:0034620111 | Esophagus | ESCC | cellular response to unfolded protein | 74/8552 | 96/18723 | 3.10e-10 | 8.66e-09 | 74 |
| GO:003043314 | Esophagus | ESCC | ubiquitin-dependent ERAD pathway | 66/8552 | 85/18723 | 1.64e-09 | 3.78e-08 | 66 |
| GO:003096818 | Esophagus | ESCC | endoplasmic reticulum unfolded protein response | 59/8552 | 74/18723 | 1.90e-09 | 4.36e-08 | 59 |
| GO:003252714 | Esophagus | ESCC | protein exit from endoplasmic reticulum | 37/8552 | 48/18723 | 8.99e-06 | 8.65e-05 | 37 |
| GO:19038289 | Esophagus | ESCC | negative regulation of cellular protein localization | 76/8552 | 117/18723 | 1.97e-05 | 1.72e-04 | 76 |
| GO:003097014 | Esophagus | ESCC | retrograde protein transport, ER to cytosol | 23/8552 | 29/18723 | 2.25e-04 | 1.40e-03 | 23 |
| GO:190351314 | Esophagus | ESCC | endoplasmic reticulum to cytosol transport | 23/8552 | 29/18723 | 2.25e-04 | 1.40e-03 | 23 |
| GO:00512244 | Esophagus | ESCC | negative regulation of protein transport | 74/8552 | 127/18723 | 2.86e-03 | 1.21e-02 | 74 |
| GO:19049505 | Esophagus | ESCC | negative regulation of establishment of protein localization | 76/8552 | 131/18723 | 2.96e-03 | 1.24e-02 | 76 |
| GO:00323875 | Esophagus | ESCC | negative regulation of intracellular transport | 37/8552 | 58/18723 | 4.12e-03 | 1.64e-02 | 37 |
| GO:00903174 | Esophagus | ESCC | negative regulation of intracellular protein transport | 28/8552 | 42/18723 | 4.90e-03 | 1.89e-02 | 28 |
| Page: 1 2 3 4 5 6 7 8 9 10 11 12 13 |
| Pathway ID | Tissue | Disease Stage | Description | Gene Ratio | Bg Ratio | pvalue | p.adjust | qvalue | Count |
| hsa04141211 | Esophagus | ESCC | Protein processing in endoplasmic reticulum | 147/4205 | 174/8465 | 3.29e-22 | 1.10e-19 | 5.64e-20 | 147 |
| hsa04141310 | Esophagus | ESCC | Protein processing in endoplasmic reticulum | 147/4205 | 174/8465 | 3.29e-22 | 1.10e-19 | 5.64e-20 | 147 |
| hsa0414114 | Liver | Cirrhotic | Protein processing in endoplasmic reticulum | 114/2530 | 174/8465 | 1.16e-22 | 9.67e-21 | 5.96e-21 | 114 |
| hsa0414115 | Liver | Cirrhotic | Protein processing in endoplasmic reticulum | 114/2530 | 174/8465 | 1.16e-22 | 9.67e-21 | 5.96e-21 | 114 |
| hsa0414122 | Liver | HCC | Protein processing in endoplasmic reticulum | 146/4020 | 174/8465 | 7.34e-24 | 2.46e-21 | 1.37e-21 | 146 |
| hsa0414132 | Liver | HCC | Protein processing in endoplasmic reticulum | 146/4020 | 174/8465 | 7.34e-24 | 2.46e-21 | 1.37e-21 | 146 |
| hsa0414130 | Oral cavity | OSCC | Protein processing in endoplasmic reticulum | 143/3704 | 174/8465 | 6.82e-26 | 2.28e-23 | 1.16e-23 | 143 |
| hsa04141113 | Oral cavity | OSCC | Protein processing in endoplasmic reticulum | 143/3704 | 174/8465 | 6.82e-26 | 2.28e-23 | 1.16e-23 | 143 |
| hsa04141210 | Oral cavity | LP | Protein processing in endoplasmic reticulum | 113/2418 | 174/8465 | 8.74e-24 | 5.82e-22 | 3.76e-22 | 113 |
| hsa0414138 | Oral cavity | LP | Protein processing in endoplasmic reticulum | 113/2418 | 174/8465 | 8.74e-24 | 5.82e-22 | 3.76e-22 | 113 |
| hsa0414145 | Oral cavity | EOLP | Protein processing in endoplasmic reticulum | 70/1218 | 174/8465 | 2.84e-17 | 3.06e-15 | 1.81e-15 | 70 |
| hsa0414155 | Oral cavity | EOLP | Protein processing in endoplasmic reticulum | 70/1218 | 174/8465 | 2.84e-17 | 3.06e-15 | 1.81e-15 | 70 |
| hsa0414128 | Prostate | BPH | Protein processing in endoplasmic reticulum | 97/1718 | 174/8465 | 2.37e-25 | 1.30e-23 | 8.07e-24 | 97 |
| hsa04141112 | Prostate | BPH | Protein processing in endoplasmic reticulum | 97/1718 | 174/8465 | 2.37e-25 | 1.30e-23 | 8.07e-24 | 97 |
| hsa0414129 | Prostate | Tumor | Protein processing in endoplasmic reticulum | 99/1791 | 174/8465 | 2.58e-25 | 1.71e-23 | 1.06e-23 | 99 |
| hsa0414137 | Prostate | Tumor | Protein processing in endoplasmic reticulum | 99/1791 | 174/8465 | 2.58e-25 | 1.71e-23 | 1.06e-23 | 99 |
| Page: 1 |
Top |
Cell-cell communication analysis |
| Identification of potential cell-cell interactions between two cell types and their ligand-receptor pairs for different disease states |
| Ligand | Receptor | LRpair | Pathway | Tissue | Disease Stage |
| Page: 1 |
Top |
Single-cell gene regulatory network inference analysis |
| Find out the significant the regulons (TFs) and the target genes of each regulon across cell types for different disease states |
| TF | Cell Type | Tissue | Disease Stage | Target Gene | RSS | Regulon Activity |
| ∗The dot plots of a searched regulon are shown for all cell subpopulations in each disease state of each tissue based on the regulon specific score inferred using pySCENIC and by calculating the average expression. |
| Page: 1 |
Top |
Somatic mutation of malignant transformation related genes |
| Annotation of somatic variants for genes involved in malignant transformation |
| Hugo Symbol | Variant Class | Variant Classification | dbSNP RS | HGVSc | HGVSp | HGVSp Short | SWISSPROT | BIOTYPE | SIFT | PolyPhen | Tumor Sample Barcode | Tissue | Histology | Sex | Age | Stage | Therapy Types | Drugs | Outcome |
| ERLEC1 | SNV | Missense_Mutation | c.1031G>T | p.Cys344Phe | p.C344F | Q96DZ1 | protein_coding | deleterious(0) | probably_damaging(1) | TCGA-AN-A0AT-01 | Breast | breast invasive carcinoma | Female | <65 | I/II | Unknown | Unknown | SD | |
| ERLEC1 | SNV | Missense_Mutation | novel | c.95G>A | p.Arg32Gln | p.R32Q | Q96DZ1 | protein_coding | tolerated(0.15) | benign(0.098) | TCGA-AN-A0XW-01 | Breast | breast invasive carcinoma | Female | <65 | III/IV | Unknown | Unknown | SD |
| ERLEC1 | SNV | Missense_Mutation | c.1207N>A | p.Asp403Asn | p.D403N | Q96DZ1 | protein_coding | deleterious(0.04) | probably_damaging(0.916) | TCGA-EW-A2FV-01 | Breast | breast invasive carcinoma | Female | <65 | III/IV | Chemotherapy | docetaxel | SD | |
| ERLEC1 | SNV | Missense_Mutation | c.112N>C | p.Ser38Arg | p.S38R | Q96DZ1 | protein_coding | deleterious(0.02) | benign(0.005) | TCGA-JW-A5VK-01 | Cervix | cervical & endocervical cancer | Female | <65 | I/II | Unknown | Unknown | SD | |
| ERLEC1 | SNV | Missense_Mutation | rs748288717 | c.494G>A | p.Arg165Gln | p.R165Q | Q96DZ1 | protein_coding | tolerated(0.61) | benign(0.001) | TCGA-AA-3845-01 | Colorectum | colon adenocarcinoma | Female | >=65 | I/II | Unknown | Unknown | PD |
| ERLEC1 | SNV | Missense_Mutation | c.1124C>A | p.Ser375Tyr | p.S375Y | Q96DZ1 | protein_coding | deleterious(0.02) | possibly_damaging(0.744) | TCGA-AD-6895-01 | Colorectum | colon adenocarcinoma | Male | >=65 | III/IV | Unknown | Unknown | SD | |
| ERLEC1 | SNV | Missense_Mutation | rs146951835 | c.1448N>G | p.Asn483Ser | p.N483S | Q96DZ1 | protein_coding | tolerated_low_confidence(0.67) | benign(0) | TCGA-AZ-6606-01 | Colorectum | colon adenocarcinoma | Male | >=65 | III/IV | Chemotherapy | folfiri | PD |
| ERLEC1 | SNV | Missense_Mutation | rs201137433 | c.517N>C | p.Ser173Pro | p.S173P | Q96DZ1 | protein_coding | tolerated(0.2) | benign(0.003) | TCGA-CA-6717-01 | Colorectum | colon adenocarcinoma | Male | <65 | I/II | Chemotherapy | oxaliplatin | CR |
| ERLEC1 | SNV | Missense_Mutation | c.812N>T | p.Pro271Leu | p.P271L | Q96DZ1 | protein_coding | deleterious(0) | probably_damaging(1) | TCGA-D5-5541-01 | Colorectum | colon adenocarcinoma | Male | <65 | III/IV | Chemotherapy | calcium | SD | |
| ERLEC1 | SNV | Missense_Mutation | novel | c.1439N>A | p.Ser480Tyr | p.S480Y | Q96DZ1 | protein_coding | deleterious(0) | benign(0.386) | TCGA-AG-A002-01 | Colorectum | rectum adenocarcinoma | Male | <65 | I/II | Unknown | Unknown | SD |
| Page: 1 2 3 4 |
Top |
Related drugs of malignant transformation related genes |
| Identification of chemicals and drugs interact with genes involved in malignant transfromation |
| (DGIdb 4.0) |
| Entrez ID | Symbol | Category | Interaction Types | Drug Claim Name | Drug Name | PMIDs |
| Page: 1 |

Copyright 2023-Present -The University of Texas Health Science Center at Houston |