
|
|||||
|
 | |
| |
| |
| |
| |
| |
|
Gene: ERICH1 |
Gene summary for ERICH1 |
| Gene information | Species | Human | Gene symbol | ERICH1 | Gene ID | 157697 |
| Gene name | glutamate rich 1 | |
| Gene Alias | HSPC319 | |
| Cytomap | 8p23.3 | |
| Gene Type | protein-coding | GO ID | GO:0003674 | UniProtAcc | B4DMI5 |
Top |
Malignant transformation analysis |
| Identification of the aberrant gene expression in precancerous and cancerous lesions by comparing the gene expression of stem-like cells in diseased tissues with normal stem cells |
| Entrez ID | Symbol | Replicates | Species | Organ | Tissue | Adj P-value | Log2FC | Malignancy |
| 157697 | ERICH1 | LZE2T | Human | Esophagus | ESCC | 3.41e-04 | 4.11e-01 | 0.082 |
| 157697 | ERICH1 | LZE3D | Human | Esophagus | HGIN | 1.27e-03 | 5.74e-01 | 0.0668 |
| 157697 | ERICH1 | LZE4T | Human | Esophagus | ESCC | 3.03e-21 | 3.11e-01 | 0.0811 |
| 157697 | ERICH1 | LZE7T | Human | Esophagus | ESCC | 1.65e-06 | 3.58e-01 | 0.0667 |
| 157697 | ERICH1 | LZE8T | Human | Esophagus | ESCC | 1.70e-14 | 3.67e-01 | 0.067 |
| 157697 | ERICH1 | LZE20T | Human | Esophagus | ESCC | 7.56e-08 | 1.36e-01 | 0.0662 |
| 157697 | ERICH1 | LZE21D1 | Human | Esophagus | HGIN | 1.12e-05 | 3.22e-01 | 0.0632 |
| 157697 | ERICH1 | LZE22D1 | Human | Esophagus | HGIN | 1.26e-02 | 1.16e-01 | 0.0595 |
| 157697 | ERICH1 | LZE22T | Human | Esophagus | ESCC | 1.69e-04 | 2.32e-01 | 0.068 |
| 157697 | ERICH1 | LZE24T | Human | Esophagus | ESCC | 2.47e-19 | 4.94e-01 | 0.0596 |
| 157697 | ERICH1 | LZE21T | Human | Esophagus | ESCC | 4.21e-11 | 4.44e-01 | 0.0655 |
| 157697 | ERICH1 | LZE6T | Human | Esophagus | ESCC | 9.82e-10 | 3.07e-01 | 0.0845 |
| 157697 | ERICH1 | P1T-E | Human | Esophagus | ESCC | 3.33e-22 | 5.10e-01 | 0.0875 |
| 157697 | ERICH1 | P2T-E | Human | Esophagus | ESCC | 4.03e-21 | 3.21e-01 | 0.1177 |
| 157697 | ERICH1 | P4T-E | Human | Esophagus | ESCC | 8.55e-50 | 9.41e-01 | 0.1323 |
| 157697 | ERICH1 | P5T-E | Human | Esophagus | ESCC | 1.22e-19 | 3.68e-01 | 0.1327 |
| 157697 | ERICH1 | P8T-E | Human | Esophagus | ESCC | 2.67e-28 | 5.94e-01 | 0.0889 |
| 157697 | ERICH1 | P9T-E | Human | Esophagus | ESCC | 3.18e-29 | 4.64e-01 | 0.1131 |
| 157697 | ERICH1 | P10T-E | Human | Esophagus | ESCC | 1.96e-49 | 8.17e-01 | 0.116 |
| 157697 | ERICH1 | P11T-E | Human | Esophagus | ESCC | 5.99e-15 | 2.85e-01 | 0.1426 |
| Page: 1 2 3 4 5 6 |
| Tissue | Expression Dynamics | Abbreviation |
| Esophagus | 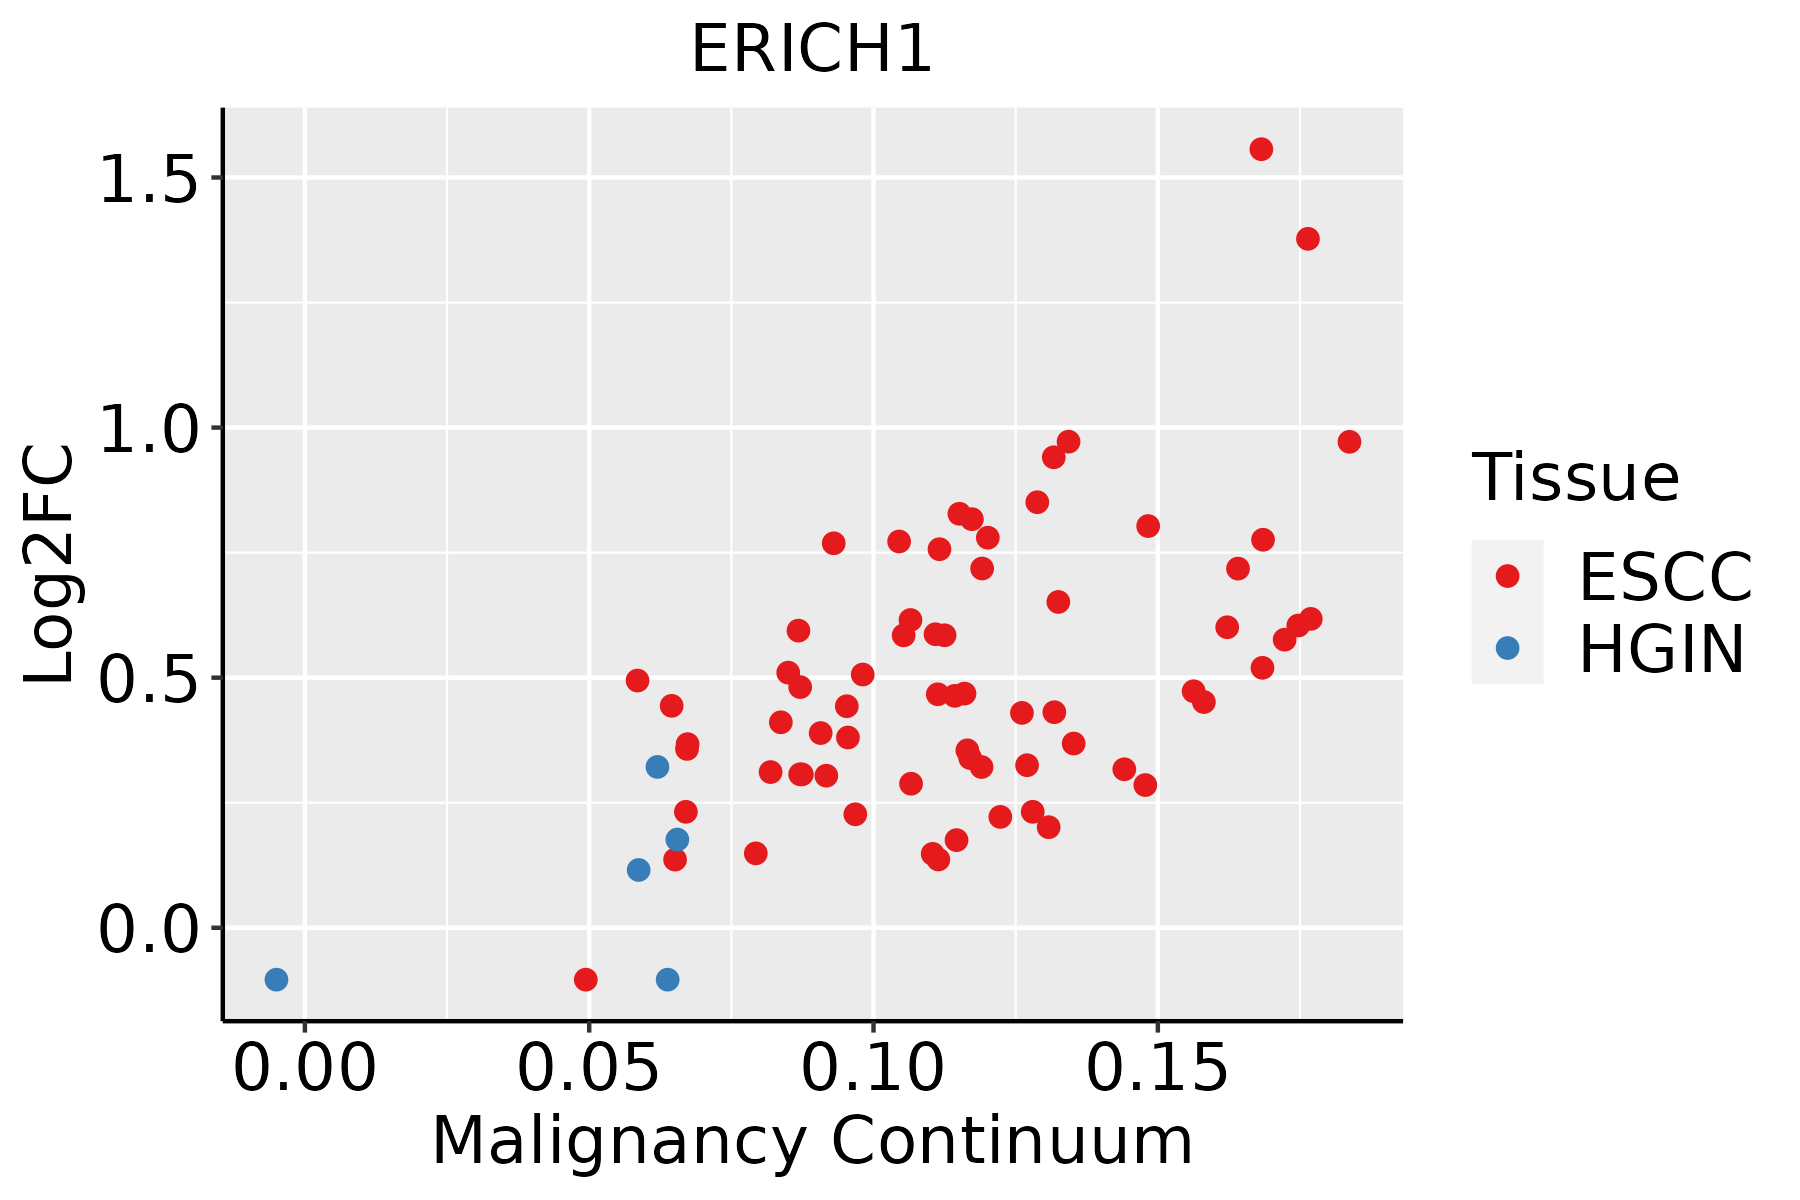 | ESCC: Esophageal squamous cell carcinoma |
| HGIN: High-grade intraepithelial neoplasias | ||
| LGIN: Low-grade intraepithelial neoplasias | ||
| Oral Cavity | 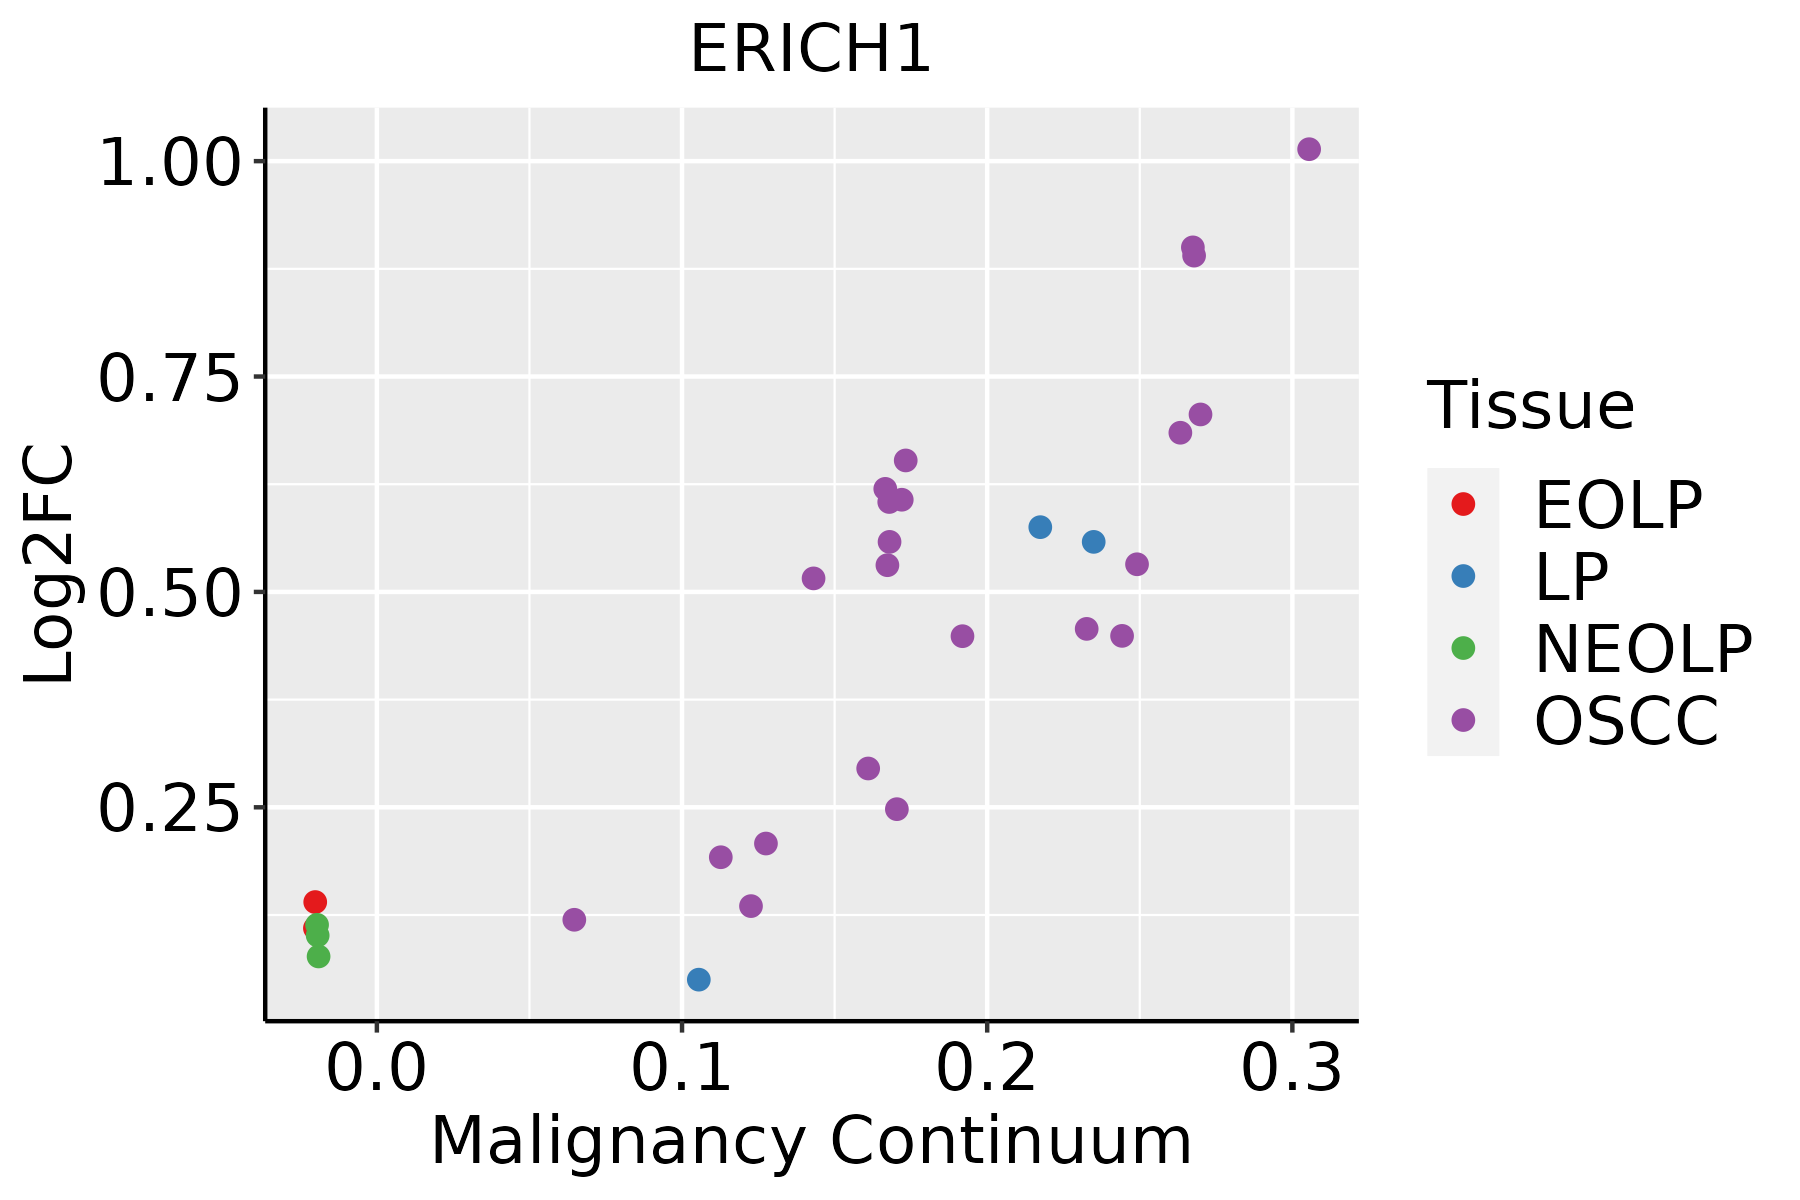 | EOLP: Erosive Oral lichen planus |
| LP: leukoplakia | ||
| NEOLP: Non-erosive oral lichen planus | ||
| OSCC: Oral squamous cell carcinoma | ||
| Skin | 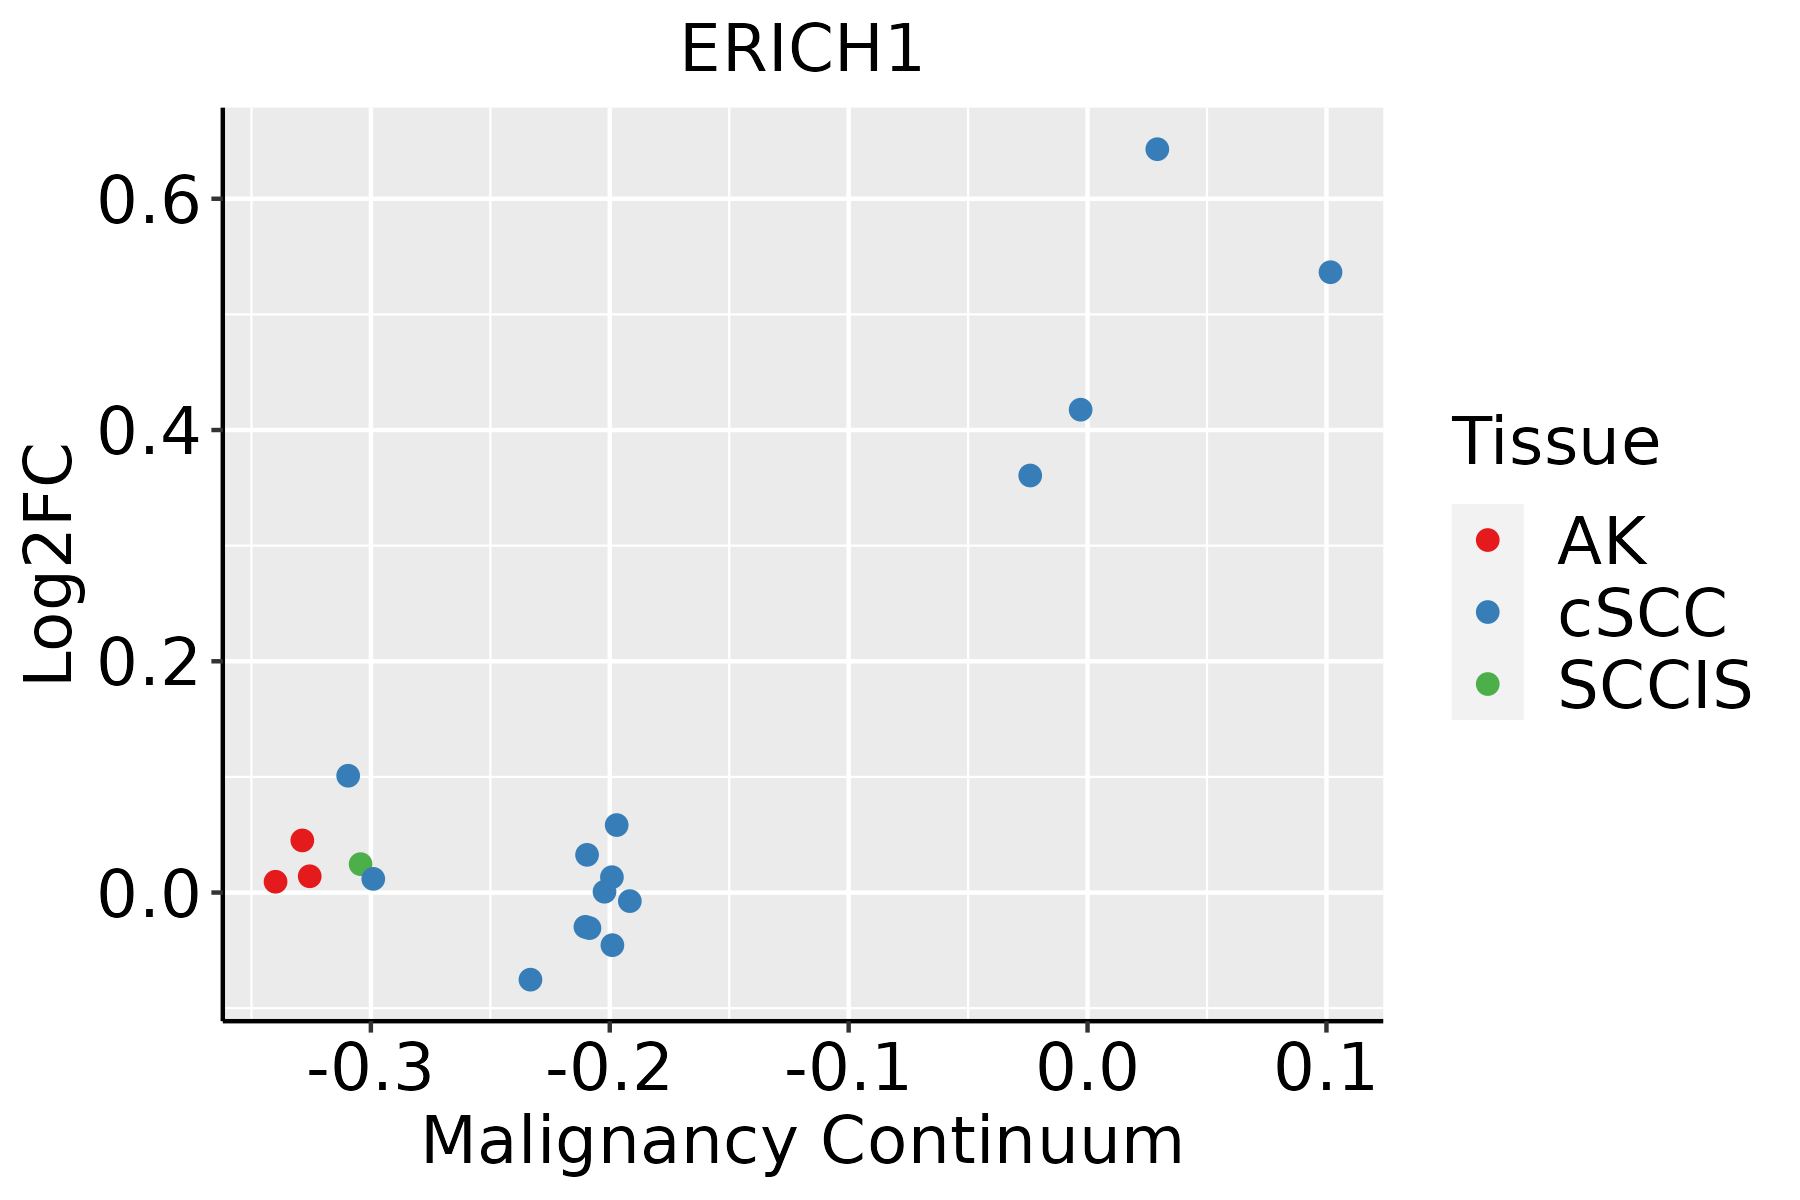 | AK: Actinic keratosis |
| cSCC: Cutaneous squamous cell carcinoma | ||
| SCCIS:squamous cell carcinoma in situ | ||
| Thyroid | 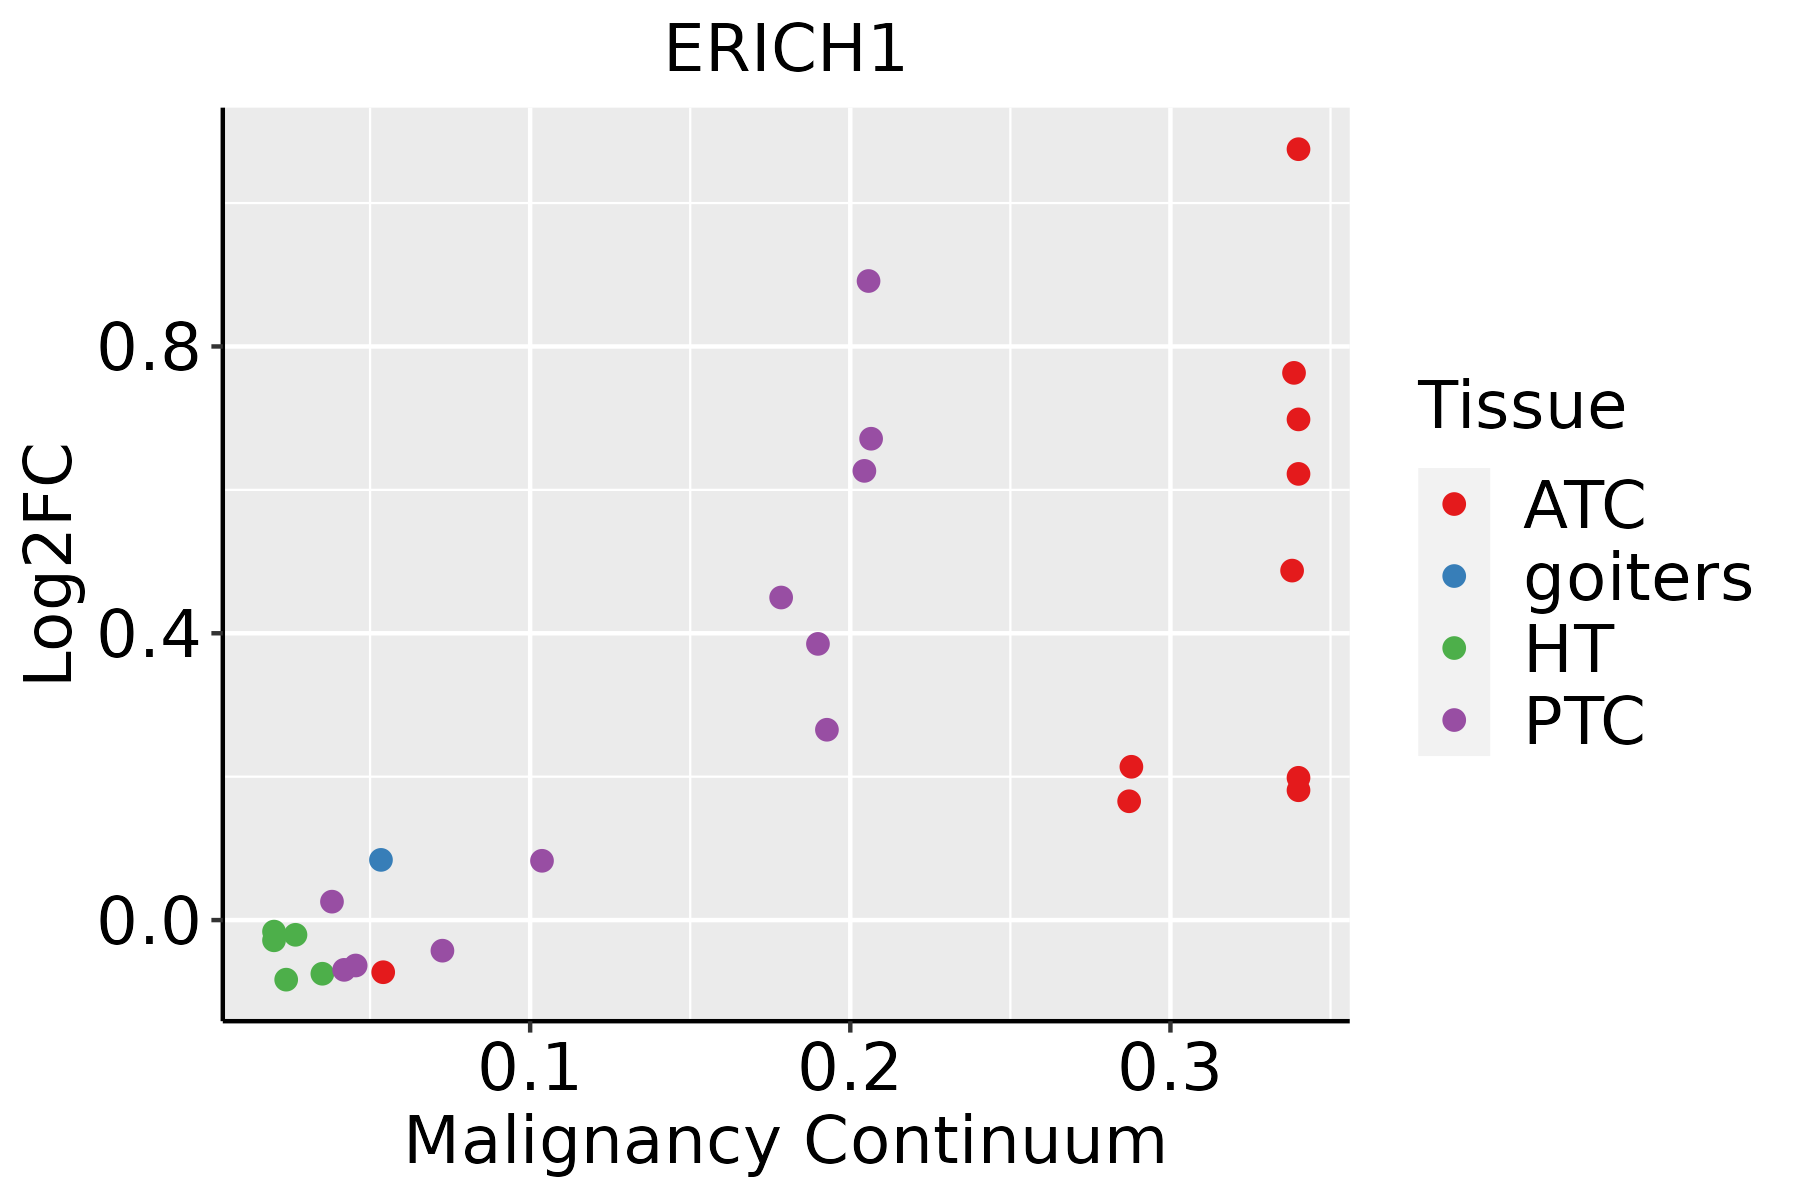 | ATC: Anaplastic thyroid cancer |
| HT: Hashimoto's thyroiditis | ||
| PTC: Papillary thyroid cancer |
| ∗log2FC in expression of this searched gene in stem-like cells from each diseased tissue sample relative to stem-like cells in normal samples in each tissue plotted against the malignancy continuum. Samples are colored based on if they are from different disease stage. |
Top |
Malignant transformation related pathway analysis |
| Find out the enriched GO biological processes and KEGG pathways involved in transition from healthy to precancer to cancer |
| Tissue | Disease Stage | Enriched GO biological Processes |
| Colorectum | AD |  |
| Colorectum | SER |  |
| Colorectum | MSS |  |
| Colorectum | MSI-H |  |
| Colorectum | FAP |  |
| ∗Top 15 enriched GO BP terms are showed in the bar plot of each disease state in each tissue. Each row represents a significant GO biological process which is colored according to the -log10(p.adjust). |
| Page: 1 2 3 4 5 6 7 8 9 |
| GO ID | Tissue | Disease Stage | Description | Gene Ratio | Bg Ratio | pvalue | p.adjust | Count |
| Page: 1 |
| Pathway ID | Tissue | Disease Stage | Description | Gene Ratio | Bg Ratio | pvalue | p.adjust | qvalue | Count |
| Page: 1 |
Top |
Cell-cell communication analysis |
| Identification of potential cell-cell interactions between two cell types and their ligand-receptor pairs for different disease states |
| Ligand | Receptor | LRpair | Pathway | Tissue | Disease Stage |
| Page: 1 |
Top |
Single-cell gene regulatory network inference analysis |
| Find out the significant the regulons (TFs) and the target genes of each regulon across cell types for different disease states |
| TF | Cell Type | Tissue | Disease Stage | Target Gene | RSS | Regulon Activity |
| ∗The dot plots of a searched regulon are shown for all cell subpopulations in each disease state of each tissue based on the regulon specific score inferred using pySCENIC and by calculating the average expression. |
| Page: 1 |
Top |
Somatic mutation of malignant transformation related genes |
| Annotation of somatic variants for genes involved in malignant transformation |
| Hugo Symbol | Variant Class | Variant Classification | dbSNP RS | HGVSc | HGVSp | HGVSp Short | SWISSPROT | BIOTYPE | SIFT | PolyPhen | Tumor Sample Barcode | Tissue | Histology | Sex | Age | Stage | Therapy Types | Drugs | Outcome |
| ERICH1 | SNV | Missense_Mutation | novel | c.983N>T | p.Glu328Val | p.E328V | Q86X53 | protein_coding | deleterious(0) | probably_damaging(0.962) | TCGA-S3-AA12-01 | Breast | breast invasive carcinoma | Female | >=65 | III/IV | Hormone Therapy | anastrozole | SD |
| ERICH1 | SNV | Missense_Mutation | rs552049087 | c.796G>T | p.Val266Phe | p.V266F | Q86X53 | protein_coding | deleterious_low_confidence(0.02) | benign(0.164) | TCGA-DS-A7WF-01 | Cervix | cervical & endocervical cancer | Female | <65 | I/II | Chemotherapy | cisplatin | PD |
| ERICH1 | SNV | Missense_Mutation | c.972C>G | p.Asp324Glu | p.D324E | Q86X53 | protein_coding | deleterious(0.01) | probably_damaging(0.995) | TCGA-AA-3852-01 | Colorectum | colon adenocarcinoma | Male | >=65 | I/II | Unknown | Unknown | PD | |
| ERICH1 | SNV | Missense_Mutation | c.501N>T | p.Lys167Asn | p.K167N | Q86X53 | protein_coding | deleterious(0) | probably_damaging(0.964) | TCGA-AA-3977-01 | Colorectum | colon adenocarcinoma | Male | >=65 | I/II | Unknown | Unknown | SD | |
| ERICH1 | SNV | Missense_Mutation | rs752885695 | c.1327N>A | p.Asp443Asn | p.D443N | Q86X53 | protein_coding | deleterious(0) | benign(0.022) | TCGA-AD-5900-01 | Colorectum | colon adenocarcinoma | Male | >=65 | I/II | Unknown | Unknown | SD |
| ERICH1 | SNV | Missense_Mutation | rs780803882 | c.514N>G | p.Lys172Glu | p.K172E | Q86X53 | protein_coding | deleterious(0.04) | benign(0.327) | TCGA-AZ-4315-01 | Colorectum | colon adenocarcinoma | Male | <65 | I/II | Unknown | Unknown | SD |
| ERICH1 | SNV | Missense_Mutation | c.457N>A | p.Asp153Asn | p.D153N | Q86X53 | protein_coding | deleterious(0.04) | probably_damaging(0.964) | TCGA-AZ-6598-01 | Colorectum | colon adenocarcinoma | Female | >=65 | I/II | Unknown | Unknown | SD | |
| ERICH1 | SNV | Missense_Mutation | rs143811367 | c.248N>T | p.Pro83Leu | p.P83L | Q86X53 | protein_coding | tolerated(0.05) | possibly_damaging(0.625) | TCGA-AZ-6598-01 | Colorectum | colon adenocarcinoma | Female | >=65 | I/II | Unknown | Unknown | SD |
| ERICH1 | SNV | Missense_Mutation | c.706N>A | p.Asp236Asn | p.D236N | Q86X53 | protein_coding | tolerated(0.17) | benign(0.001) | TCGA-CM-4743-01 | Colorectum | colon adenocarcinoma | Male | >=65 | I/II | Chemotherapy | capecitabine | SD | |
| ERICH1 | deletion | Frame_Shift_Del | c.487delN | p.Arg163GlyfsTer3 | p.R163Gfs*3 | Q86X53 | protein_coding | TCGA-AA-3713-01 | Colorectum | colon adenocarcinoma | Male | >=65 | III/IV | Chemotherapy | 5-fluorouracil | PR |
| Page: 1 2 3 4 5 6 7 |
Top |
Related drugs of malignant transformation related genes |
| Identification of chemicals and drugs interact with genes involved in malignant transfromation |
| (DGIdb 4.0) |
| Entrez ID | Symbol | Category | Interaction Types | Drug Claim Name | Drug Name | PMIDs |
| Page: 1 |

Copyright 2023-Present -The University of Texas Health Science Center at Houston |