
|
|||||
|
 | |
| |
| |
| |
| |
| |
|
Gene: ERI1 |
Gene summary for ERI1 |
| Gene information | Species | Human | Gene symbol | ERI1 | Gene ID | 90459 |
| Gene name | exoribonuclease 1 | |
| Gene Alias | 3'HEXO | |
| Cytomap | 8p23.1 | |
| Gene Type | protein-coding | GO ID | GO:0000459 | UniProtAcc | A0A024R355 |
Top |
Malignant transformation analysis |
| Identification of the aberrant gene expression in precancerous and cancerous lesions by comparing the gene expression of stem-like cells in diseased tissues with normal stem cells |
| Entrez ID | Symbol | Replicates | Species | Organ | Tissue | Adj P-value | Log2FC | Malignancy |
| 90459 | ERI1 | male-WTA | Human | Thyroid | PTC | 8.21e-03 | 2.90e-02 | 0.1037 |
| 90459 | ERI1 | PTC05 | Human | Thyroid | PTC | 1.71e-04 | 1.77e-01 | 0.2065 |
| 90459 | ERI1 | PTC07 | Human | Thyroid | PTC | 4.26e-05 | 1.09e-01 | 0.2044 |
| 90459 | ERI1 | ATC12 | Human | Thyroid | ATC | 2.67e-04 | 8.09e-02 | 0.34 |
| 90459 | ERI1 | ATC13 | Human | Thyroid | ATC | 6.75e-07 | 7.32e-02 | 0.34 |
| 90459 | ERI1 | ATC1 | Human | Thyroid | ATC | 3.39e-02 | 1.07e-01 | 0.2878 |
| 90459 | ERI1 | ATC2 | Human | Thyroid | ATC | 6.85e-06 | 6.29e-01 | 0.34 |
| 90459 | ERI1 | ATC4 | Human | Thyroid | ATC | 1.28e-07 | 1.28e-01 | 0.34 |
| 90459 | ERI1 | ATC5 | Human | Thyroid | ATC | 4.44e-07 | 9.09e-02 | 0.34 |
| Page: 1 |
| Tissue | Expression Dynamics | Abbreviation |
| Thyroid | 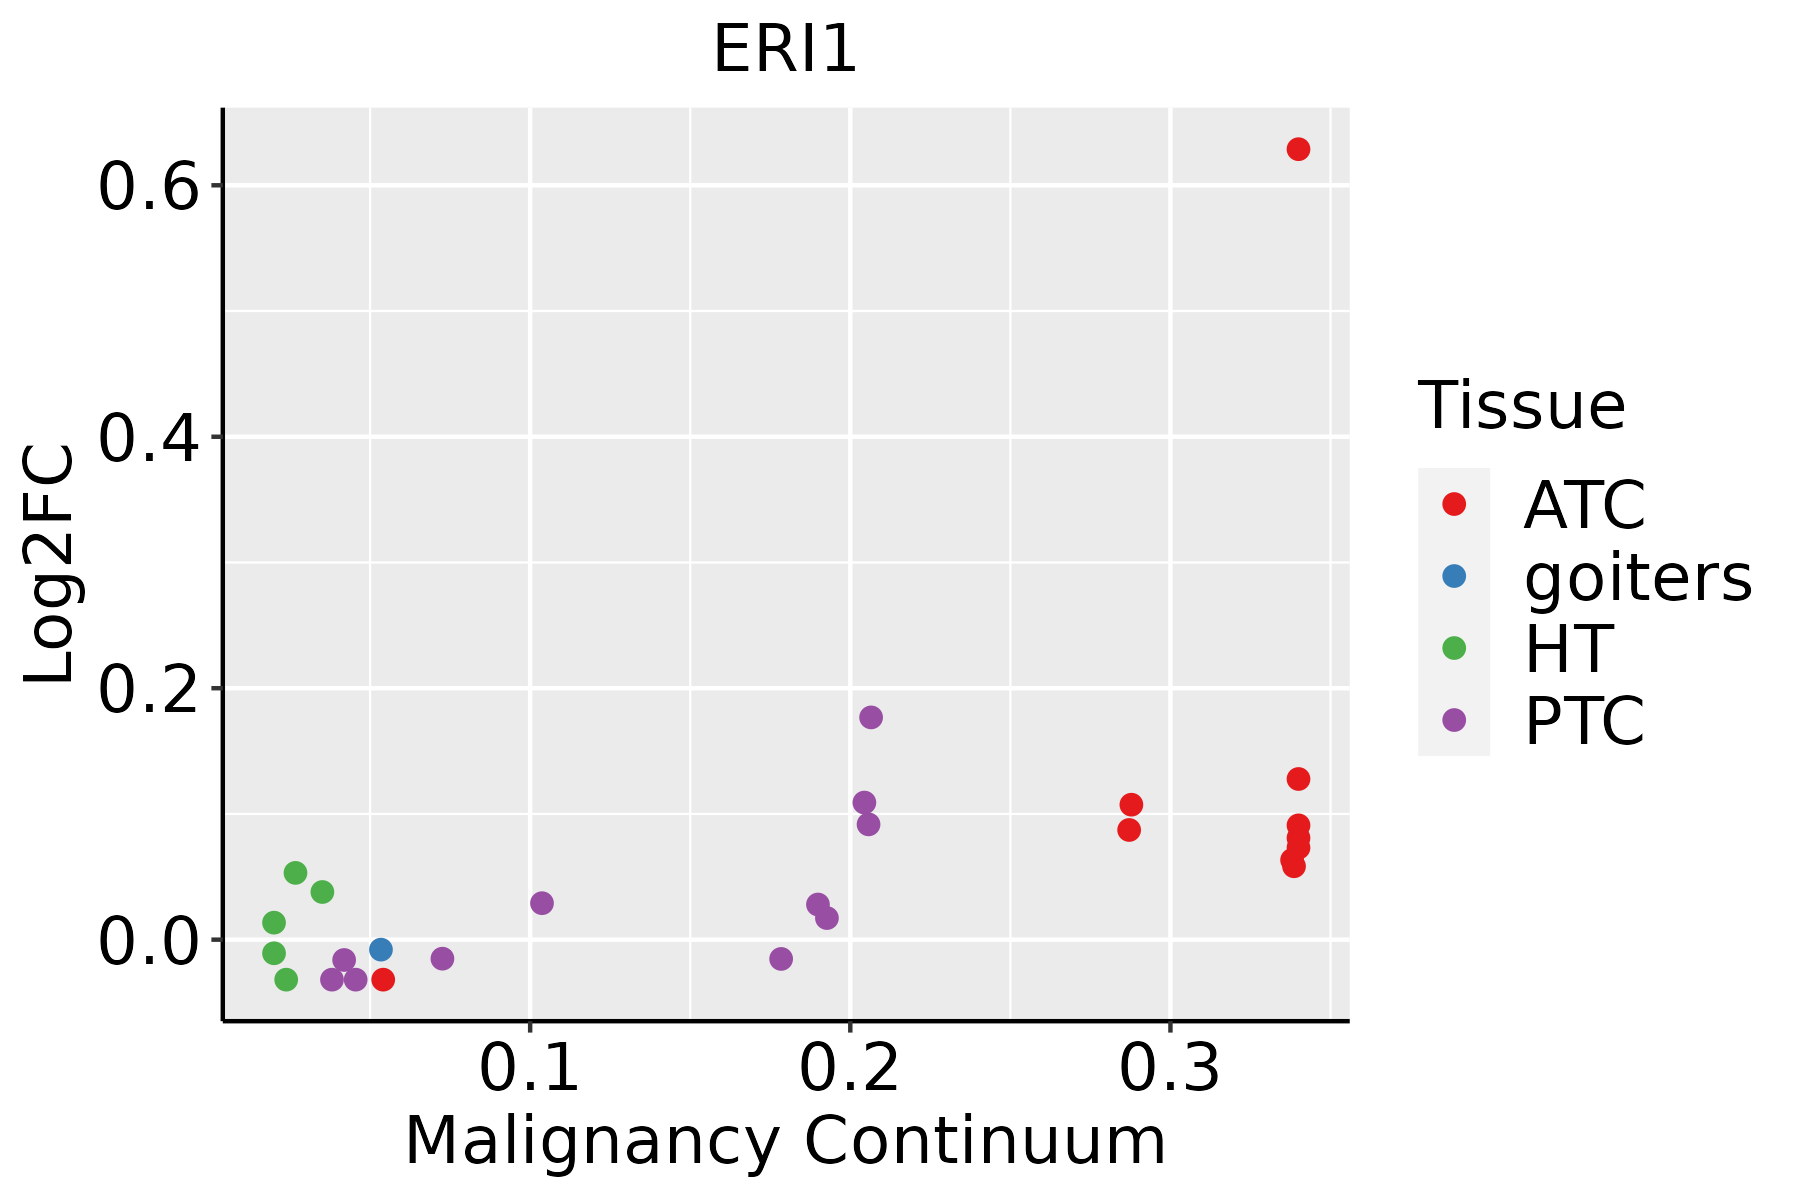 | ATC: Anaplastic thyroid cancer |
| HT: Hashimoto's thyroiditis | ||
| PTC: Papillary thyroid cancer |
| ∗log2FC in expression of this searched gene in stem-like cells from each diseased tissue sample relative to stem-like cells in normal samples in each tissue plotted against the malignancy continuum. Samples are colored based on if they are from different disease stage. |
Top |
Malignant transformation related pathway analysis |
| Find out the enriched GO biological processes and KEGG pathways involved in transition from healthy to precancer to cancer |
| Tissue | Disease Stage | Enriched GO biological Processes |
| Colorectum | AD |  |
| Colorectum | SER |  |
| Colorectum | MSS |  |
| Colorectum | MSI-H |  |
| Colorectum | FAP |  |
| ∗Top 15 enriched GO BP terms are showed in the bar plot of each disease state in each tissue. Each row represents a significant GO biological process which is colored according to the -log10(p.adjust). |
| Page: 1 2 3 4 5 6 7 8 9 |
| GO ID | Tissue | Disease Stage | Description | Gene Ratio | Bg Ratio | pvalue | p.adjust | Count |
| GO:0022613113 | Thyroid | PTC | ribonucleoprotein complex biogenesis | 292/5968 | 463/18723 | 3.24e-44 | 2.05e-40 | 292 |
| GO:0042254113 | Thyroid | PTC | ribosome biogenesis | 202/5968 | 299/18723 | 3.47e-37 | 5.47e-34 | 202 |
| GO:0006364112 | Thyroid | PTC | rRNA processing | 156/5968 | 225/18723 | 5.58e-31 | 5.03e-28 | 156 |
| GO:0016072112 | Thyroid | PTC | rRNA metabolic process | 160/5968 | 236/18723 | 5.68e-30 | 3.58e-27 | 160 |
| GO:003447018 | Thyroid | PTC | ncRNA processing | 215/5968 | 395/18723 | 7.14e-21 | 1.22e-18 | 215 |
| GO:00346608 | Thyroid | PTC | ncRNA metabolic process | 239/5968 | 485/18723 | 5.54e-16 | 4.26e-14 | 239 |
| GO:00311235 | Thyroid | PTC | RNA 3'-end processing | 65/5968 | 116/18723 | 6.24e-08 | 1.30e-06 | 65 |
| GO:00004695 | Thyroid | PTC | cleavage involved in rRNA processing | 21/5968 | 27/18723 | 1.24e-06 | 1.79e-05 | 21 |
| GO:00905015 | Thyroid | PTC | RNA phosphodiester bond hydrolysis | 76/5968 | 152/18723 | 2.40e-06 | 3.17e-05 | 76 |
| GO:00004605 | Thyroid | PTC | maturation of 5.8S rRNA | 24/5968 | 35/18723 | 9.08e-06 | 1.03e-04 | 24 |
| GO:00905035 | Thyroid | PTC | RNA phosphodiester bond hydrolysis, exonucleolytic | 27/5968 | 42/18723 | 1.58e-05 | 1.67e-04 | 27 |
| GO:00004665 | Thyroid | PTC | maturation of 5.8S rRNA from tricistronic rRNA transcript (SSU-rRNA, 5.8S rRNA, LSU-rRNA) | 15/5968 | 24/18723 | 1.95e-03 | 1.05e-02 | 15 |
| GO:00311253 | Thyroid | PTC | rRNA 3'-end processing | 8/5968 | 10/18723 | 2.46e-03 | 1.27e-02 | 8 |
| GO:00903055 | Thyroid | PTC | nucleic acid phosphodiester bond hydrolysis | 105/5968 | 261/18723 | 2.53e-03 | 1.31e-02 | 105 |
| GO:002261334 | Thyroid | ATC | ribonucleoprotein complex biogenesis | 292/6293 | 463/18723 | 3.05e-39 | 9.63e-36 | 292 |
| GO:004225434 | Thyroid | ATC | ribosome biogenesis | 203/6293 | 299/18723 | 3.63e-34 | 4.59e-31 | 203 |
| GO:000636432 | Thyroid | ATC | rRNA processing | 157/6293 | 225/18723 | 9.02e-29 | 5.70e-26 | 157 |
| GO:001607232 | Thyroid | ATC | rRNA metabolic process | 161/6293 | 236/18723 | 1.02e-27 | 5.89e-25 | 161 |
| GO:003447021 | Thyroid | ATC | ncRNA processing | 216/6293 | 395/18723 | 3.14e-18 | 3.98e-16 | 216 |
| GO:003466021 | Thyroid | ATC | ncRNA metabolic process | 240/6293 | 485/18723 | 2.03e-13 | 9.91e-12 | 240 |
| Page: 1 2 |
| Pathway ID | Tissue | Disease Stage | Description | Gene Ratio | Bg Ratio | pvalue | p.adjust | qvalue | Count |
| Page: 1 |
Top |
Cell-cell communication analysis |
| Identification of potential cell-cell interactions between two cell types and their ligand-receptor pairs for different disease states |
| Ligand | Receptor | LRpair | Pathway | Tissue | Disease Stage |
| Page: 1 |
Top |
Single-cell gene regulatory network inference analysis |
| Find out the significant the regulons (TFs) and the target genes of each regulon across cell types for different disease states |
| TF | Cell Type | Tissue | Disease Stage | Target Gene | RSS | Regulon Activity |
| ∗The dot plots of a searched regulon are shown for all cell subpopulations in each disease state of each tissue based on the regulon specific score inferred using pySCENIC and by calculating the average expression. |
| Page: 1 |
Top |
Somatic mutation of malignant transformation related genes |
| Annotation of somatic variants for genes involved in malignant transformation |
| Hugo Symbol | Variant Class | Variant Classification | dbSNP RS | HGVSc | HGVSp | HGVSp Short | SWISSPROT | BIOTYPE | SIFT | PolyPhen | Tumor Sample Barcode | Tissue | Histology | Sex | Age | Stage | Therapy Types | Drugs | Outcome |
| ERI1 | SNV | Missense_Mutation | rs772848272 | c.872N>A | p.Arg291Gln | p.R291Q | Q8IV48 | protein_coding | deleterious(0.03) | benign(0.106) | TCGA-E2-A14W-01 | Breast | breast invasive carcinoma | Male | >=65 | I/II | Chemotherapy | cytoxan | SD |
| ERI1 | SNV | Missense_Mutation | novel | c.354N>T | p.Lys118Asn | p.K118N | Q8IV48 | protein_coding | tolerated(0.05) | benign(0.018) | TCGA-AG-A002-01 | Colorectum | rectum adenocarcinoma | Male | <65 | I/II | Unknown | Unknown | SD |
| ERI1 | SNV | Missense_Mutation | novel | c.302N>C | p.Val101Ala | p.V101A | Q8IV48 | protein_coding | deleterious(0.01) | possibly_damaging(0.677) | TCGA-F5-6814-01 | Colorectum | rectum adenocarcinoma | Male | <65 | I/II | Unknown | Unknown | SD |
| ERI1 | SNV | Missense_Mutation | novel | c.903N>G | p.Asn301Lys | p.N301K | Q8IV48 | protein_coding | deleterious(0) | probably_damaging(1) | TCGA-F5-6814-01 | Colorectum | rectum adenocarcinoma | Male | <65 | I/II | Unknown | Unknown | SD |
| ERI1 | insertion | Frame_Shift_Ins | novel | c.620_621insA | p.Val210SerfsTer3 | p.V210Sfs*3 | Q8IV48 | protein_coding | TCGA-AA-3715-01 | Colorectum | colon adenocarcinoma | Male | >=65 | I/II | Unknown | Unknown | PD | ||
| ERI1 | SNV | Missense_Mutation | novel | c.236N>C | p.Met79Thr | p.M79T | Q8IV48 | protein_coding | deleterious(0) | probably_damaging(1) | TCGA-AJ-A3BG-01 | Endometrium | uterine corpus endometrioid carcinoma | Female | >=65 | I/II | Chemotherapy | carboplatin | PD |
| ERI1 | SNV | Missense_Mutation | novel | c.469N>A | p.Val157Ile | p.V157I | Q8IV48 | protein_coding | tolerated(0.1) | benign(0.231) | TCGA-AJ-A3EK-01 | Endometrium | uterine corpus endometrioid carcinoma | Female | <65 | I/II | Chemotherapy | carboplatin | CR |
| ERI1 | SNV | Missense_Mutation | rs749327249 | c.923N>A | p.Arg308Gln | p.R308Q | Q8IV48 | protein_coding | tolerated(0.2) | benign(0.028) | TCGA-AP-A056-01 | Endometrium | uterine corpus endometrioid carcinoma | Female | <65 | I/II | Unknown | Unknown | SD |
| ERI1 | SNV | Missense_Mutation | novel | c.933G>T | p.Gln311His | p.Q311H | Q8IV48 | protein_coding | deleterious(0.01) | benign(0.285) | TCGA-AP-A1DK-01 | Endometrium | uterine corpus endometrioid carcinoma | Female | <65 | I/II | Unknown | Unknown | SD |
| ERI1 | SNV | Missense_Mutation | novel | c.400N>A | p.Asp134Asn | p.D134N | Q8IV48 | protein_coding | deleterious(0.01) | probably_damaging(0.942) | TCGA-AX-A0J1-01 | Endometrium | uterine corpus endometrioid carcinoma | Female | >=65 | I/II | Unknown | Unknown | SD |
| Page: 1 2 3 |
Top |
Related drugs of malignant transformation related genes |
| Identification of chemicals and drugs interact with genes involved in malignant transfromation |
| (DGIdb 4.0) |
| Entrez ID | Symbol | Category | Interaction Types | Drug Claim Name | Drug Name | PMIDs |
| Page: 1 |

Copyright 2023-Present -The University of Texas Health Science Center at Houston |