
|
|||||
|
 | |
| |
| |
| |
| |
| |
|
Gene: ERH |
Gene summary for ERH |
| Gene information | Species | Human | Gene symbol | ERH | Gene ID | 2079 |
| Gene name | ERH mRNA splicing and mitosis factor | |
| Gene Alias | DROER | |
| Cytomap | 14q24.1 | |
| Gene Type | protein-coding | GO ID | GO:0006139 | UniProtAcc | A0A024R6D4 |
Top |
Malignant transformation analysis |
| Identification of the aberrant gene expression in precancerous and cancerous lesions by comparing the gene expression of stem-like cells in diseased tissues with normal stem cells |
| Entrez ID | Symbol | Replicates | Species | Organ | Tissue | Adj P-value | Log2FC | Malignancy |
| 2079 | ERH | GSM4909281 | Human | Breast | IDC | 7.84e-13 | 4.26e-01 | 0.21 |
| 2079 | ERH | GSM4909285 | Human | Breast | IDC | 8.16e-40 | 6.60e-01 | 0.21 |
| 2079 | ERH | GSM4909286 | Human | Breast | IDC | 1.25e-04 | -2.13e-01 | 0.1081 |
| 2079 | ERH | GSM4909290 | Human | Breast | IDC | 3.97e-23 | 5.25e-01 | 0.2096 |
| 2079 | ERH | GSM4909293 | Human | Breast | IDC | 2.02e-03 | 2.50e-01 | 0.1581 |
| 2079 | ERH | GSM4909294 | Human | Breast | IDC | 1.08e-16 | 2.11e-01 | 0.2022 |
| 2079 | ERH | GSM4909296 | Human | Breast | IDC | 1.84e-21 | 2.12e-01 | 0.1524 |
| 2079 | ERH | GSM4909297 | Human | Breast | IDC | 9.99e-27 | -2.38e-02 | 0.1517 |
| 2079 | ERH | GSM4909301 | Human | Breast | IDC | 3.75e-02 | -4.26e-02 | 0.1577 |
| 2079 | ERH | GSM4909302 | Human | Breast | IDC | 4.92e-04 | 7.06e-02 | 0.1545 |
| 2079 | ERH | GSM4909305 | Human | Breast | IDC | 9.98e-09 | 3.56e-01 | 0.0436 |
| 2079 | ERH | GSM4909306 | Human | Breast | IDC | 1.28e-11 | 3.89e-01 | 0.1564 |
| 2079 | ERH | GSM4909307 | Human | Breast | IDC | 1.80e-19 | 4.49e-01 | 0.1569 |
| 2079 | ERH | GSM4909308 | Human | Breast | IDC | 3.19e-26 | 5.10e-01 | 0.158 |
| 2079 | ERH | GSM4909309 | Human | Breast | IDC | 5.79e-11 | 1.95e-01 | 0.0483 |
| 2079 | ERH | GSM4909311 | Human | Breast | IDC | 6.08e-45 | -3.18e-01 | 0.1534 |
| 2079 | ERH | GSM4909312 | Human | Breast | IDC | 4.06e-22 | 2.66e-01 | 0.1552 |
| 2079 | ERH | GSM4909313 | Human | Breast | IDC | 2.78e-06 | 4.96e-04 | 0.0391 |
| 2079 | ERH | GSM4909315 | Human | Breast | IDC | 3.30e-09 | 2.94e-01 | 0.21 |
| 2079 | ERH | GSM4909316 | Human | Breast | IDC | 8.18e-23 | 5.37e-01 | 0.21 |
| Page: 1 2 3 4 5 6 7 8 9 10 11 12 13 14 |
| Tissue | Expression Dynamics | Abbreviation |
| Breast | 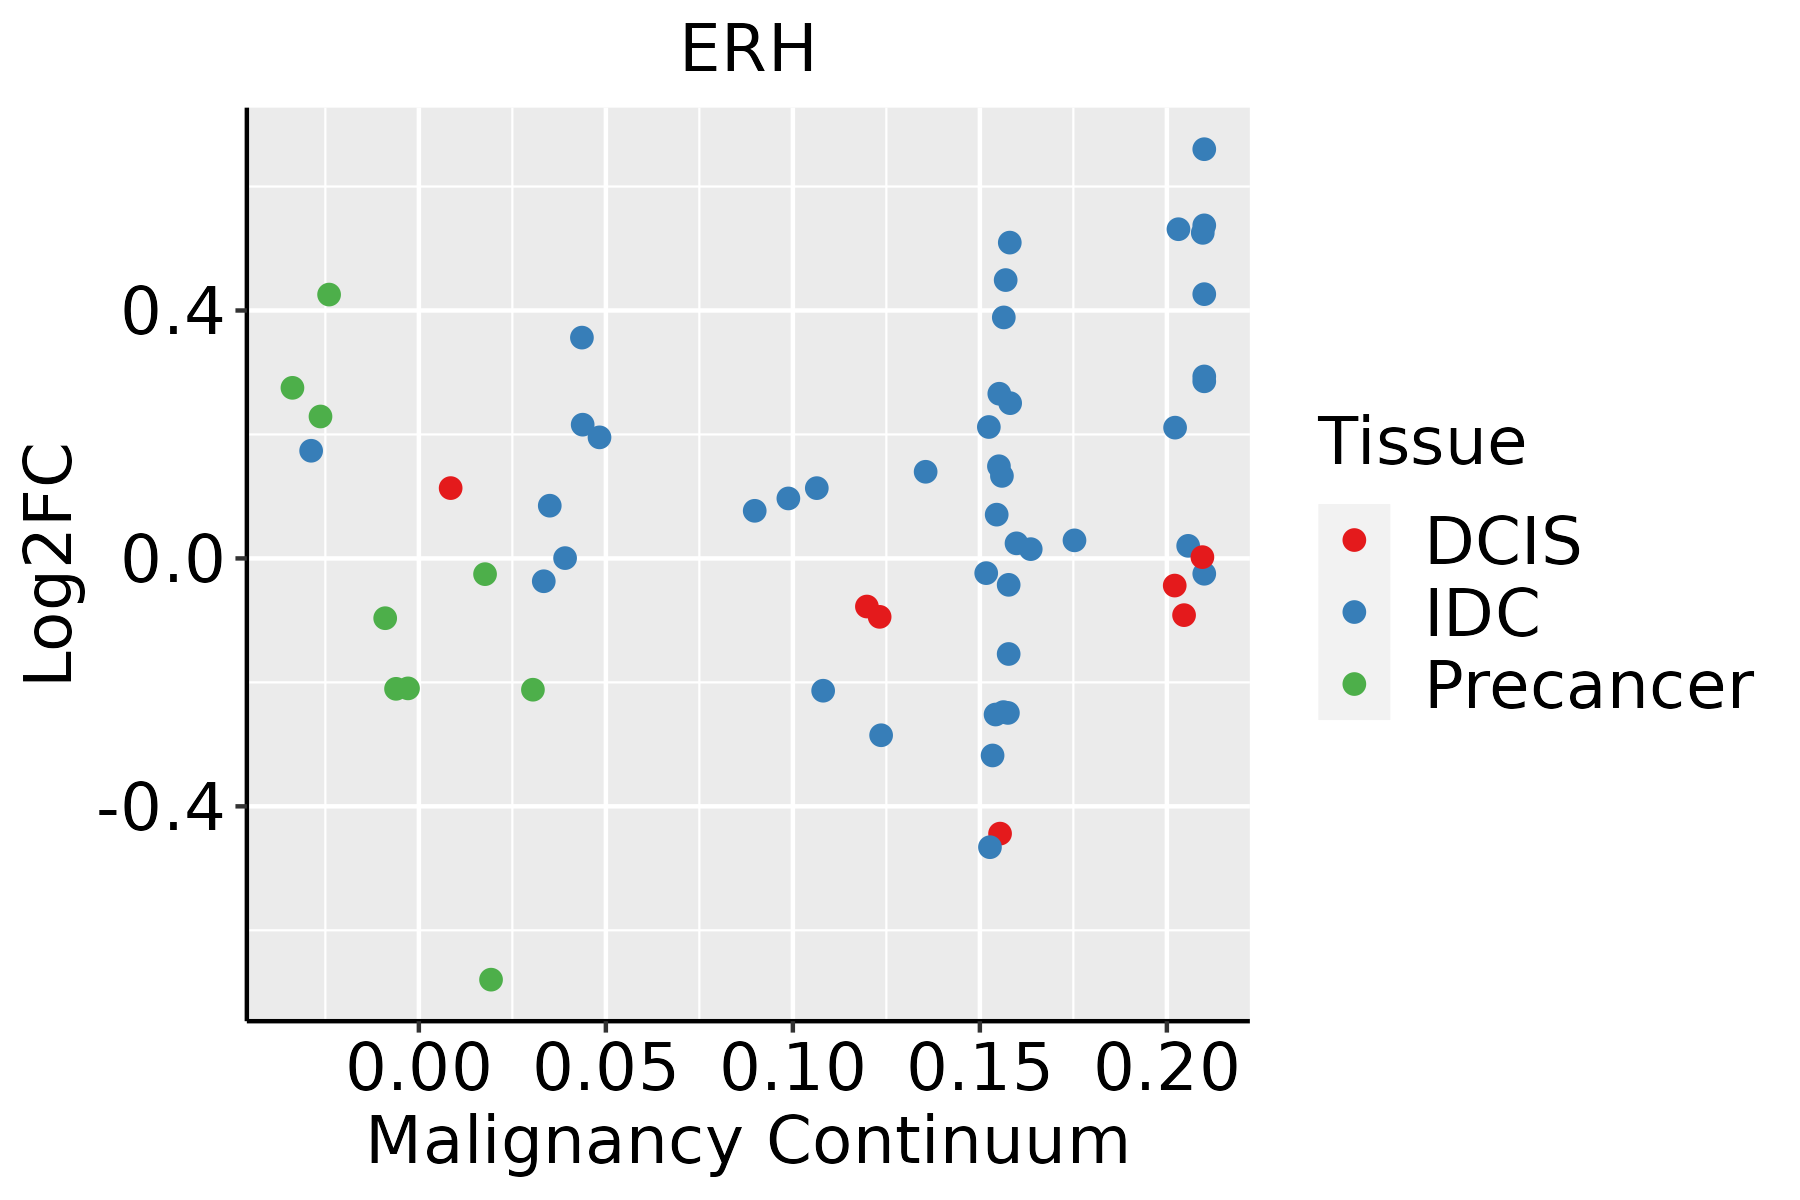 | IDC: Invasive ductal carcinoma |
| DCIS: Ductal carcinoma in situ | ||
| Precancer(BRCA1-mut): Precancerous lesion from BRCA1 mutation carriers | ||
| Cervix | 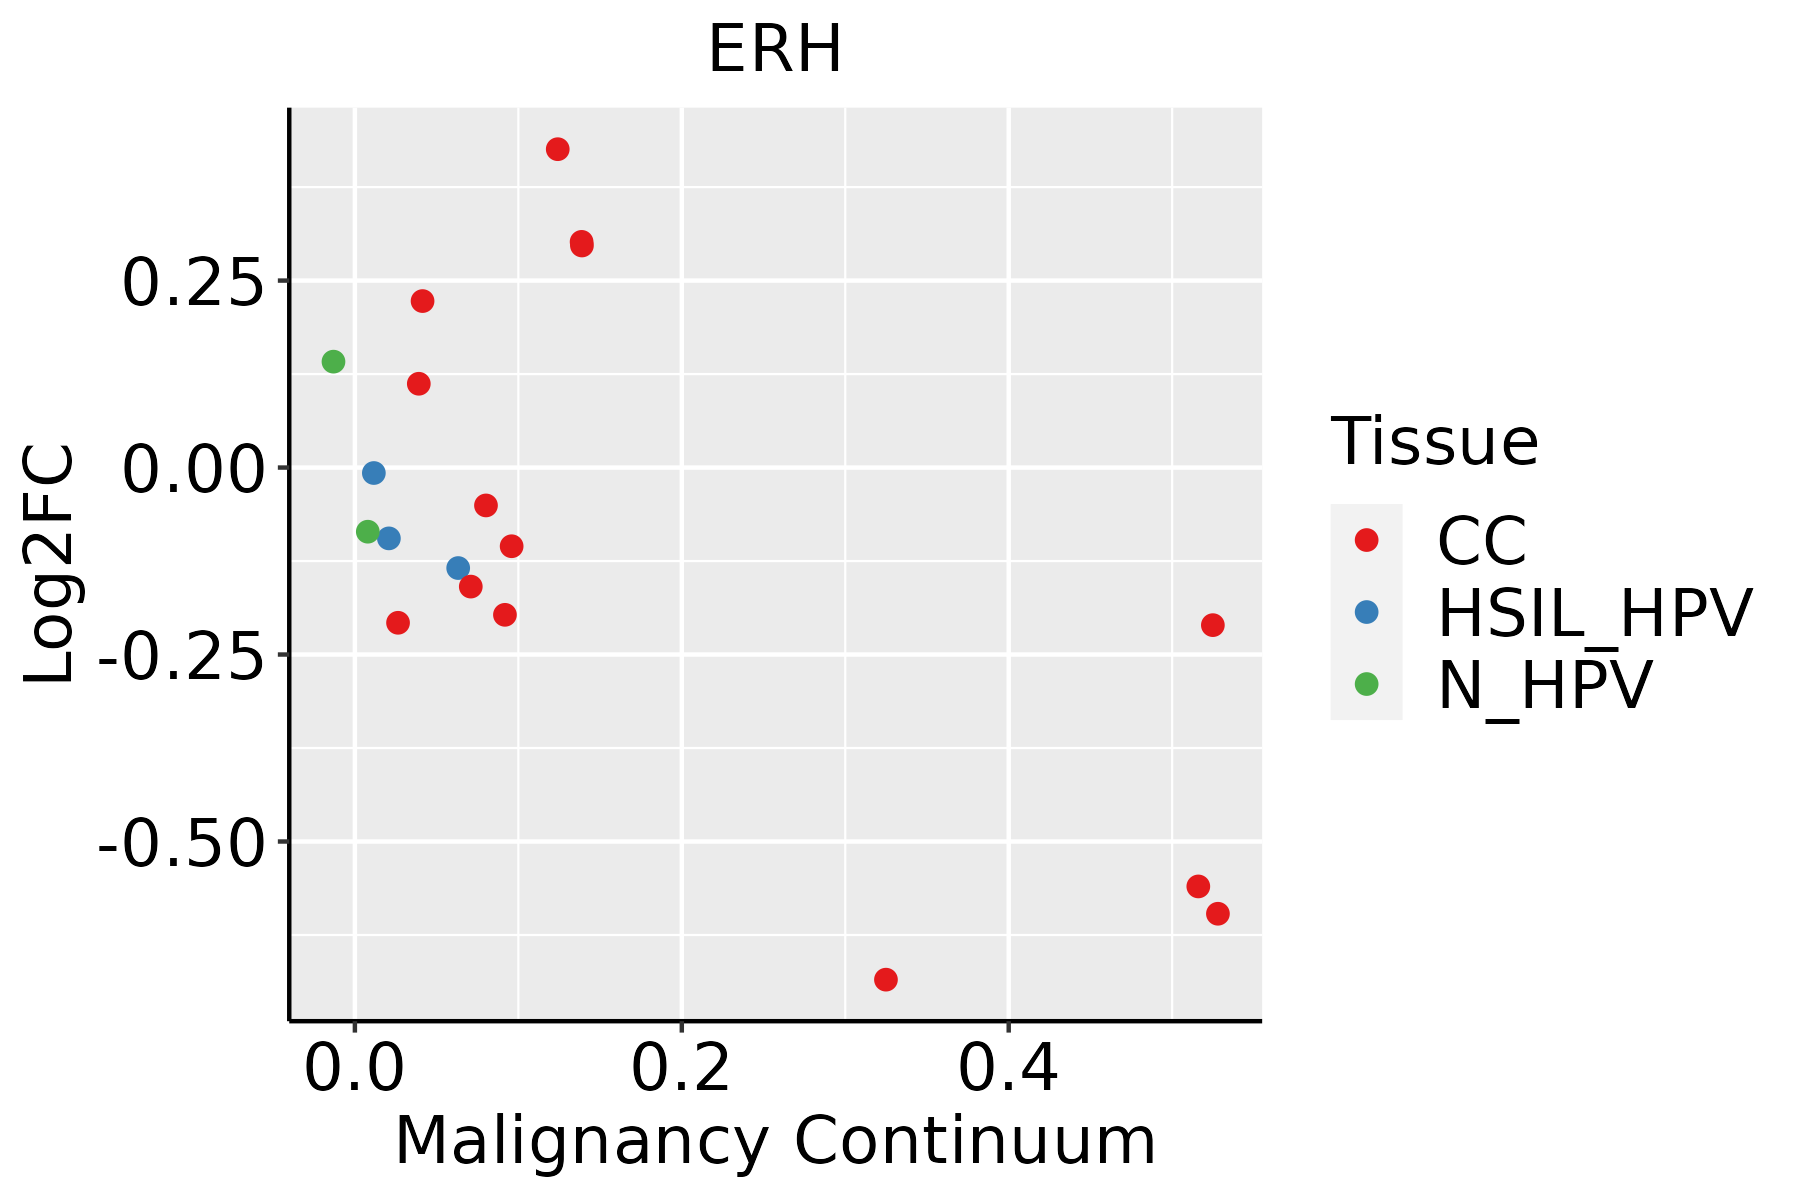 | CC: Cervix cancer |
| HSIL_HPV: HPV-infected high-grade squamous intraepithelial lesions | ||
| N_HPV: HPV-infected normal cervix | ||
| Colorectum (GSE201348) |  | FAP: Familial adenomatous polyposis |
| CRC: Colorectal cancer | ||
| Colorectum (HTA11) |  | AD: Adenomas |
| SER: Sessile serrated lesions | ||
| MSI-H: Microsatellite-high colorectal cancer | ||
| MSS: Microsatellite stable colorectal cancer | ||
| Endometrium | 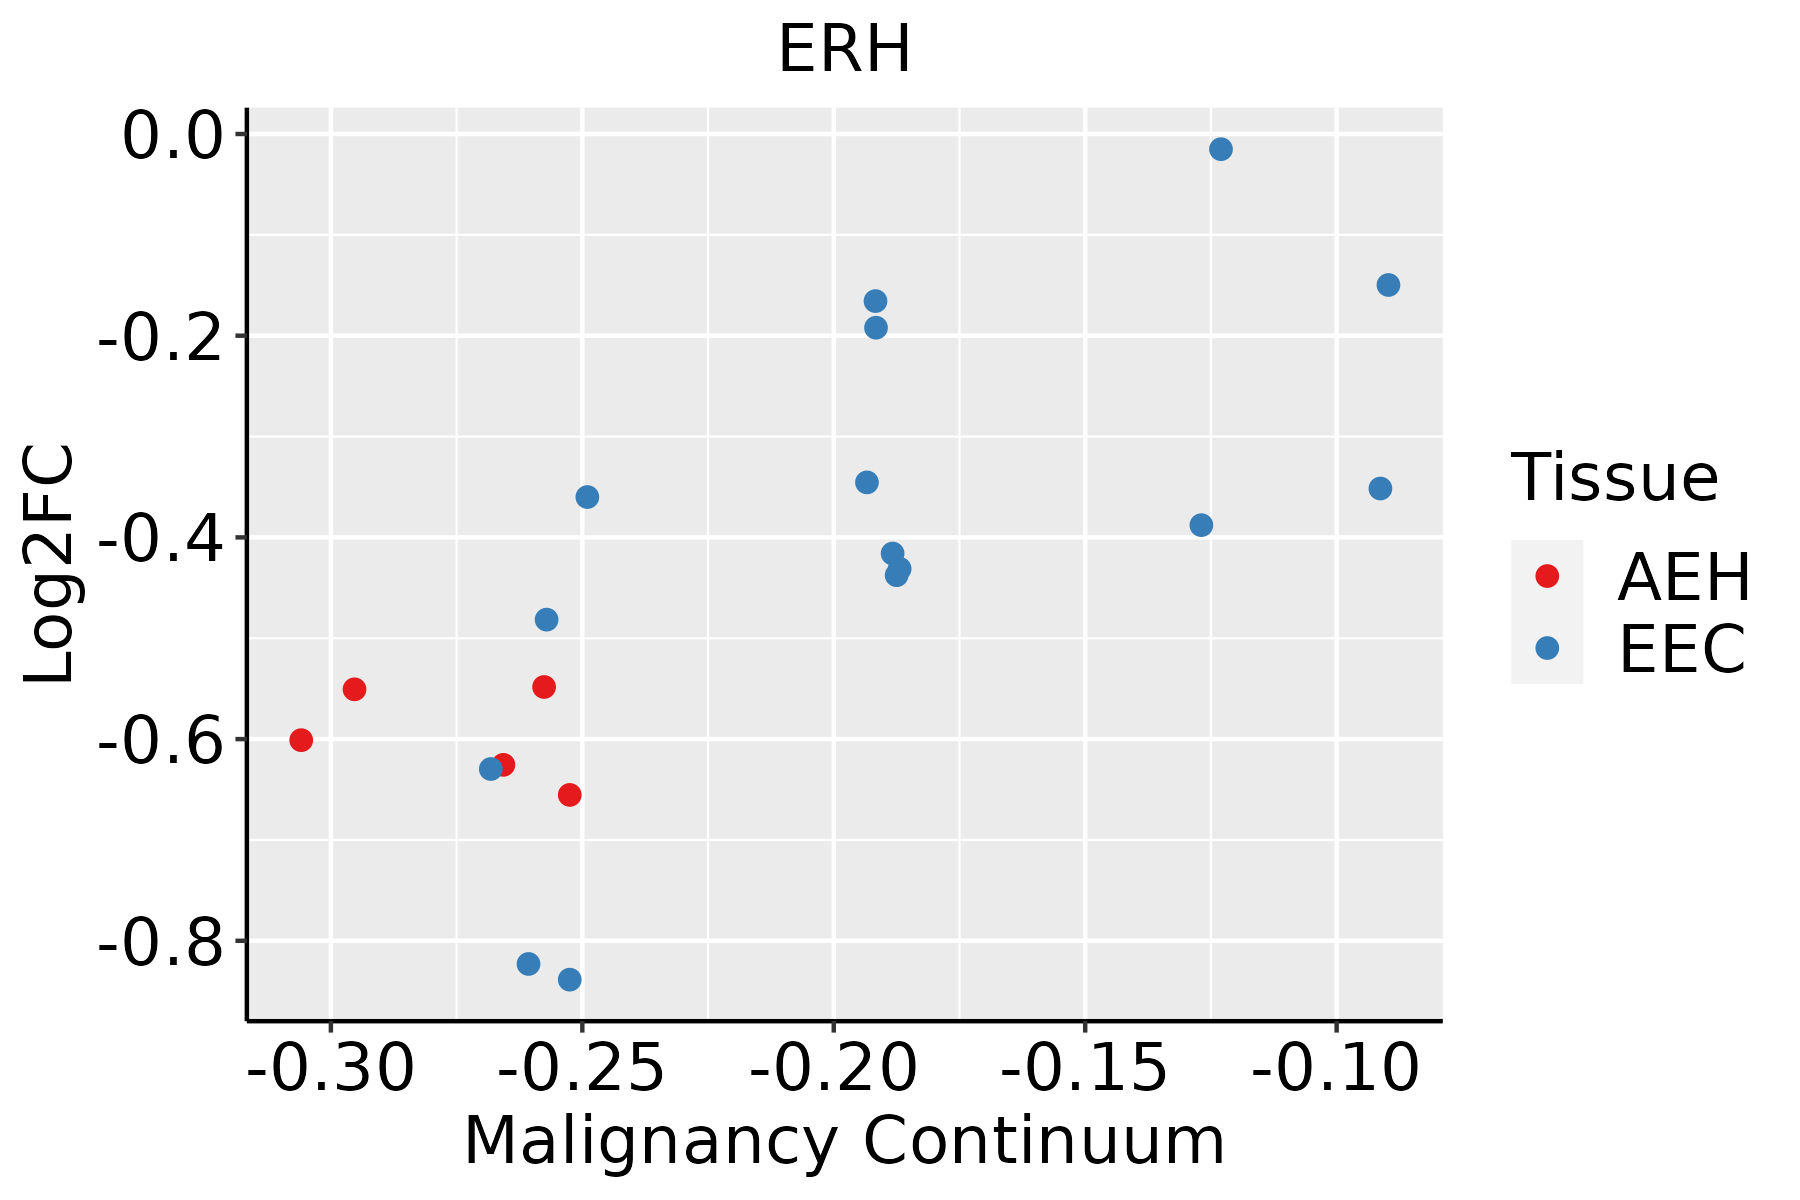 | AEH: Atypical endometrial hyperplasia |
| EEC: Endometrioid Cancer | ||
| Esophagus | 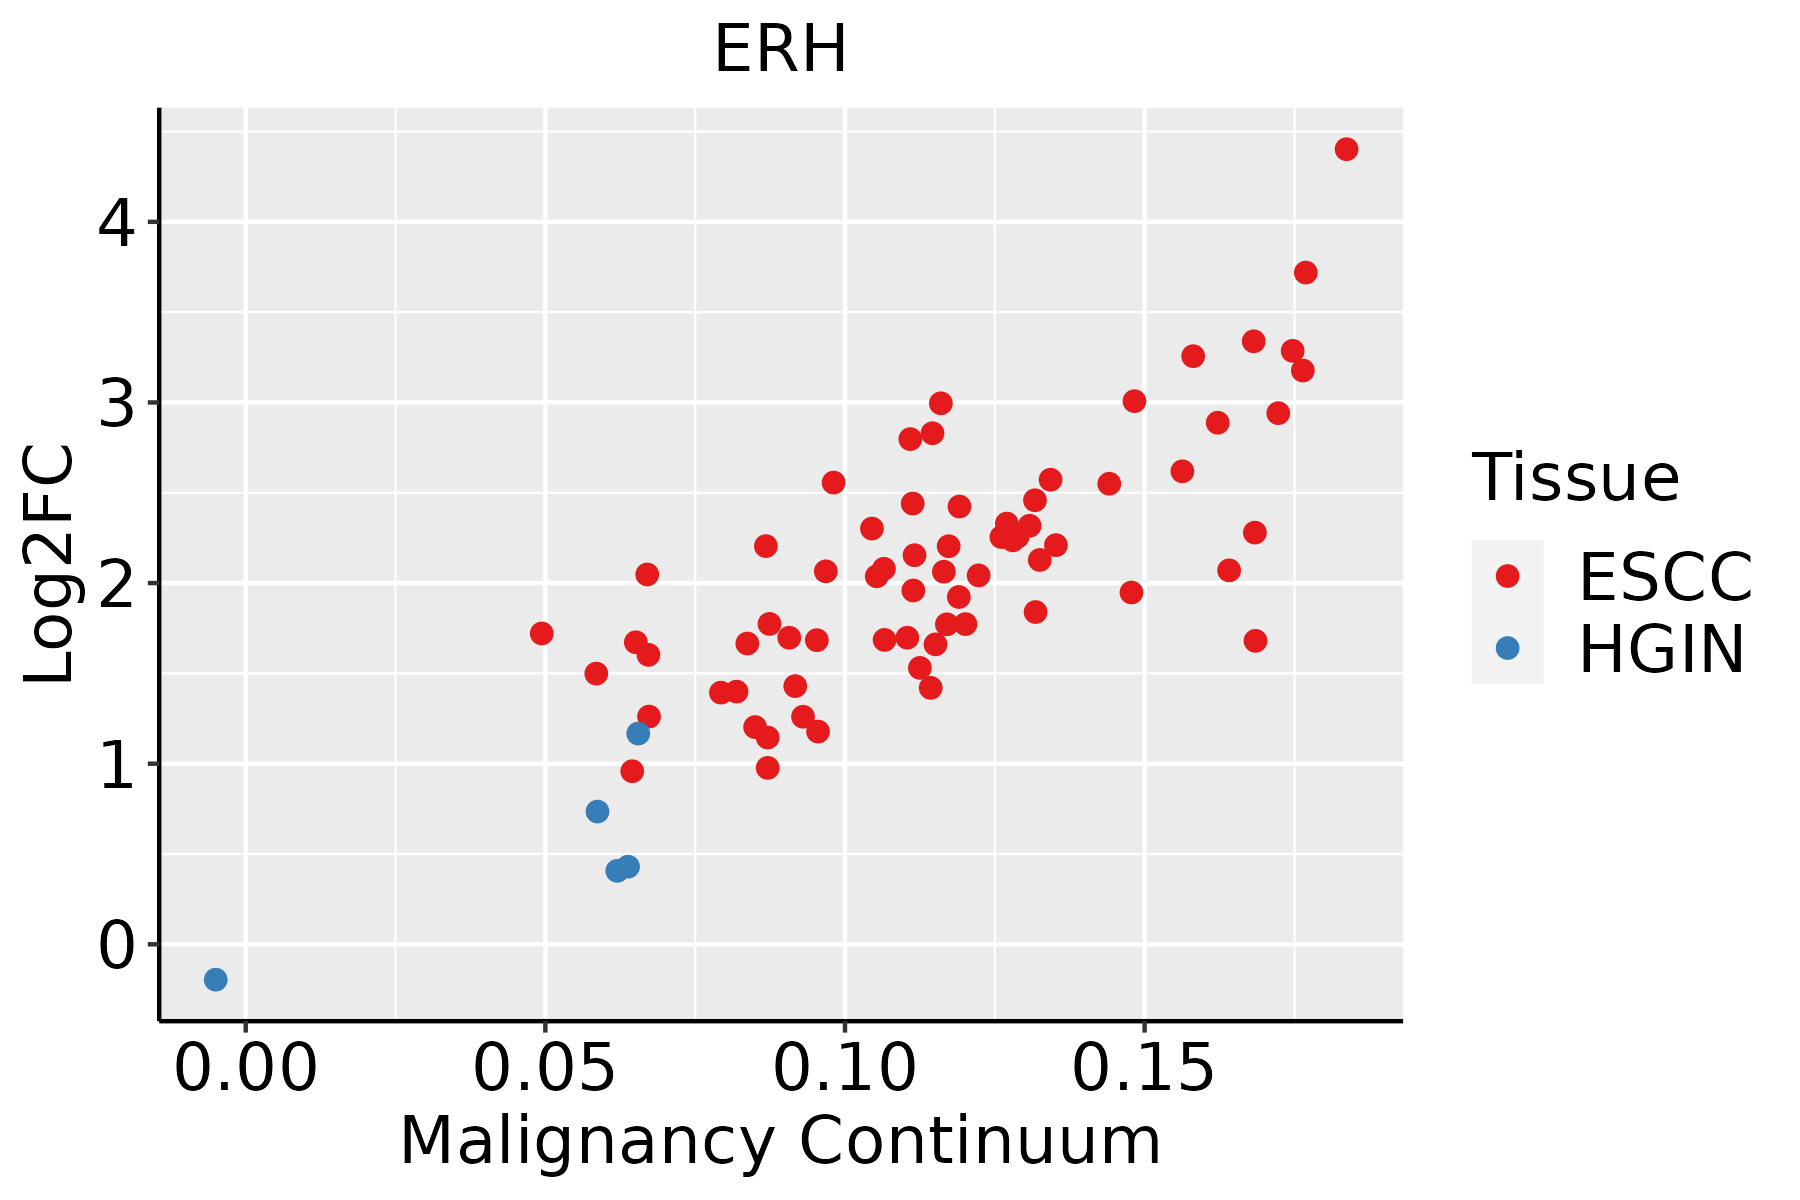 | ESCC: Esophageal squamous cell carcinoma |
| HGIN: High-grade intraepithelial neoplasias | ||
| LGIN: Low-grade intraepithelial neoplasias | ||
| GC |  | CAG: Chronic atrophic gastritis |
| CAG with IM: Chronic atrophic gastritis with intestinal metaplasia | ||
| CSG: Chronic superficial gastritis | ||
| GC: Gastric cancer | ||
| SIM: Severe intestinal metaplasia | ||
| WIM: Wild intestinal metaplasia | ||
| Liver | 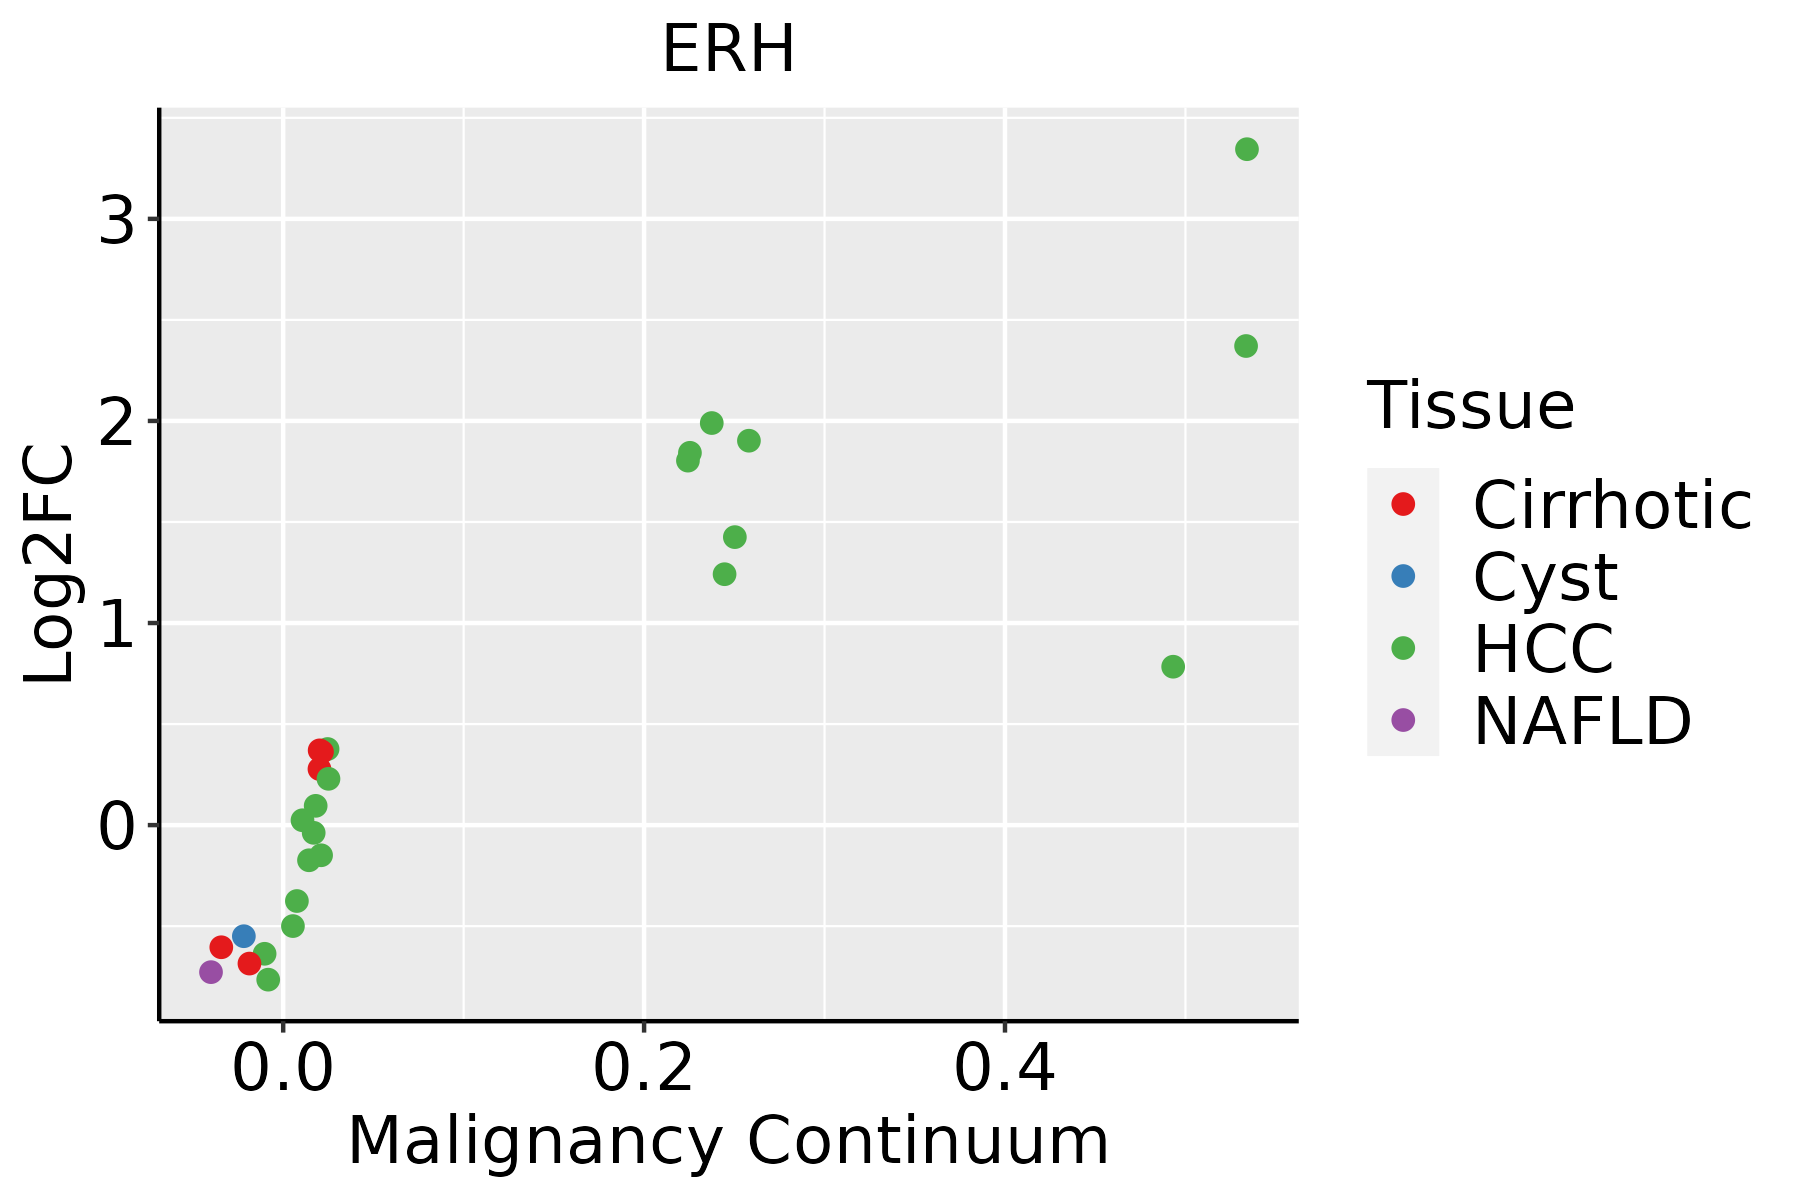 | HCC: Hepatocellular carcinoma |
| NAFLD: Non-alcoholic fatty liver disease | ||
| Oral Cavity |  | EOLP: Erosive Oral lichen planus |
| LP: leukoplakia | ||
| NEOLP: Non-erosive oral lichen planus | ||
| OSCC: Oral squamous cell carcinoma | ||
| Prostate |  | BPH: Benign Prostatic Hyperplasia |
| Skin | 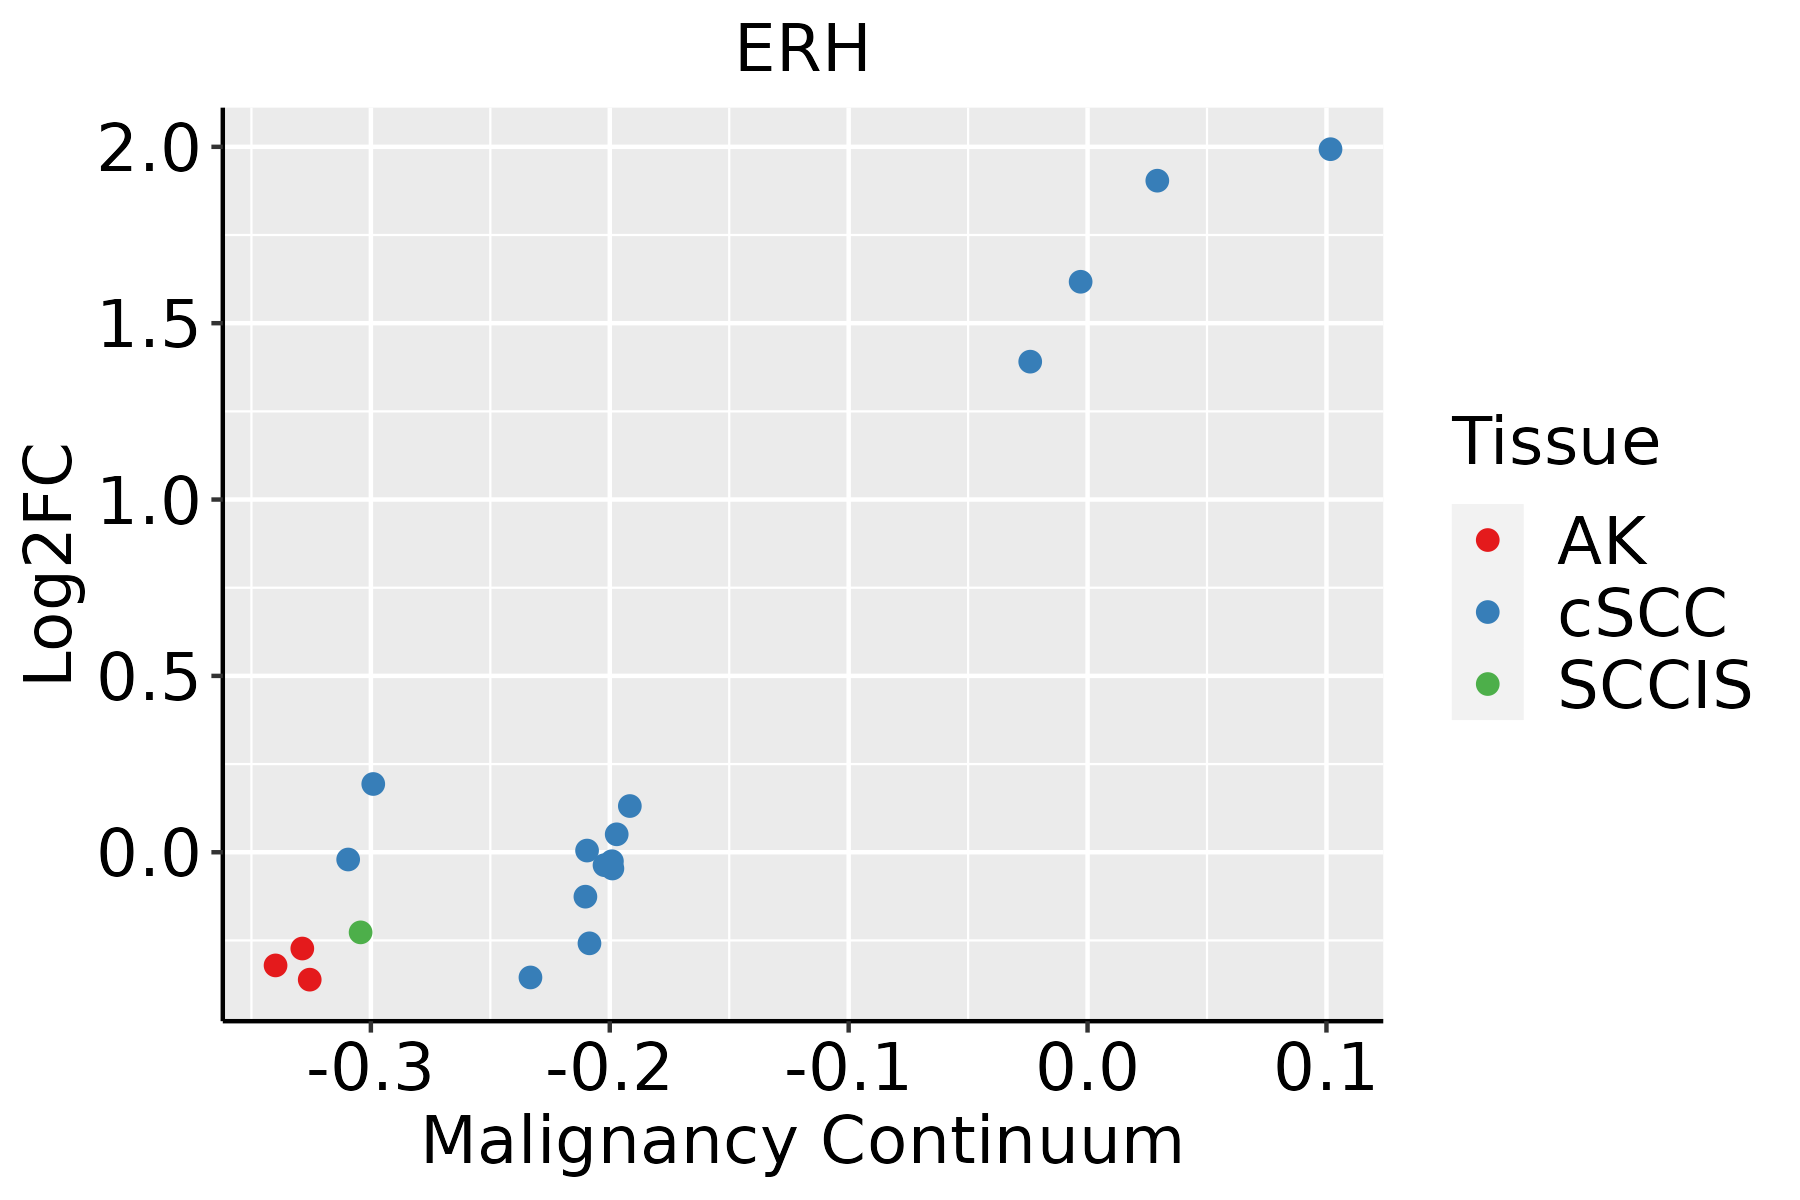 | AK: Actinic keratosis |
| cSCC: Cutaneous squamous cell carcinoma | ||
| SCCIS:squamous cell carcinoma in situ | ||
| Thyroid |  | ATC: Anaplastic thyroid cancer |
| HT: Hashimoto's thyroiditis | ||
| PTC: Papillary thyroid cancer |
| ∗log2FC in expression of this searched gene in stem-like cells from each diseased tissue sample relative to stem-like cells in normal samples in each tissue plotted against the malignancy continuum. Samples are colored based on if they are from different disease stage. |
Top |
Malignant transformation related pathway analysis |
| Find out the enriched GO biological processes and KEGG pathways involved in transition from healthy to precancer to cancer |
| Tissue | Disease Stage | Enriched GO biological Processes |
| Colorectum | AD |  |
| Colorectum | SER |  |
| Colorectum | MSS |  |
| Colorectum | MSI-H |  |
| Colorectum | FAP |  |
| ∗Top 15 enriched GO BP terms are showed in the bar plot of each disease state in each tissue. Each row represents a significant GO biological process which is colored according to the -log10(p.adjust). |
| Page: 1 2 3 4 5 6 7 8 9 |
| GO ID | Tissue | Disease Stage | Description | Gene Ratio | Bg Ratio | pvalue | p.adjust | Count |
| GO:19016574 | Esophagus | ESCC | glycosyl compound metabolic process | 57/8552 | 88/18723 | 2.32e-04 | 1.44e-03 | 57 |
| GO:00725273 | Esophagus | ESCC | pyrimidine-containing compound metabolic process | 52/8552 | 82/18723 | 9.03e-04 | 4.61e-03 | 52 |
| GO:00091163 | Esophagus | ESCC | nucleoside metabolic process | 39/8552 | 62/18723 | 4.68e-03 | 1.82e-02 | 39 |
| GO:19016572 | Liver | Cirrhotic | glycosyl compound metabolic process | 37/4634 | 88/18723 | 2.70e-04 | 2.40e-03 | 37 |
| GO:0009116 | Liver | Cirrhotic | nucleoside metabolic process | 25/4634 | 62/18723 | 4.90e-03 | 2.56e-02 | 25 |
| GO:0072527 | Liver | Cirrhotic | pyrimidine-containing compound metabolic process | 30/4634 | 82/18723 | 1.12e-02 | 4.92e-02 | 30 |
| GO:19016571 | Liver | HCC | glycosyl compound metabolic process | 55/7958 | 88/18723 | 1.20e-04 | 1.01e-03 | 55 |
| GO:00725271 | Liver | HCC | pyrimidine-containing compound metabolic process | 49/7958 | 82/18723 | 1.20e-03 | 6.68e-03 | 49 |
| GO:00091161 | Liver | HCC | nucleoside metabolic process | 37/7958 | 62/18723 | 4.73e-03 | 2.02e-02 | 37 |
| GO:19016573 | Oral cavity | OSCC | glycosyl compound metabolic process | 52/7305 | 88/18723 | 1.06e-04 | 7.84e-04 | 52 |
| GO:00091162 | Oral cavity | OSCC | nucleoside metabolic process | 37/7305 | 62/18723 | 7.79e-04 | 4.23e-03 | 37 |
| GO:00725272 | Oral cavity | OSCC | pyrimidine-containing compound metabolic process | 44/7305 | 82/18723 | 4.95e-03 | 1.94e-02 | 44 |
| GO:190165711 | Oral cavity | LP | glycosyl compound metabolic process | 43/4623 | 88/18723 | 7.80e-07 | 2.05e-05 | 43 |
| GO:000911611 | Oral cavity | LP | nucleoside metabolic process | 31/4623 | 62/18723 | 1.46e-05 | 2.57e-04 | 31 |
| GO:19016575 | Skin | cSCC | glycosyl compound metabolic process | 37/4864 | 88/18723 | 7.39e-04 | 5.15e-03 | 37 |
| GO:00091164 | Skin | cSCC | nucleoside metabolic process | 27/4864 | 62/18723 | 1.99e-03 | 1.19e-02 | 27 |
| GO:1901657 | Stomach | SIM | glycosyl compound metabolic process | 9/708 | 88/18723 | 6.00e-03 | 4.83e-02 | 9 |
| Page: 1 |
| Pathway ID | Tissue | Disease Stage | Description | Gene Ratio | Bg Ratio | pvalue | p.adjust | qvalue | Count |
| Page: 1 |
Top |
Cell-cell communication analysis |
| Identification of potential cell-cell interactions between two cell types and their ligand-receptor pairs for different disease states |
| Ligand | Receptor | LRpair | Pathway | Tissue | Disease Stage |
| Page: 1 |
Top |
Single-cell gene regulatory network inference analysis |
| Find out the significant the regulons (TFs) and the target genes of each regulon across cell types for different disease states |
| TF | Cell Type | Tissue | Disease Stage | Target Gene | RSS | Regulon Activity |
| ∗The dot plots of a searched regulon are shown for all cell subpopulations in each disease state of each tissue based on the regulon specific score inferred using pySCENIC and by calculating the average expression. |
| Page: 1 |
Top |
Somatic mutation of malignant transformation related genes |
| Annotation of somatic variants for genes involved in malignant transformation |
| Hugo Symbol | Variant Class | Variant Classification | dbSNP RS | HGVSc | HGVSp | HGVSp Short | SWISSPROT | BIOTYPE | SIFT | PolyPhen | Tumor Sample Barcode | Tissue | Histology | Sex | Age | Stage | Therapy Types | Drugs | Outcome |
| ERH | SNV | Missense_Mutation | novel | c.286N>T | p.Arg96Cys | p.R96C | P84090 | protein_coding | tolerated(0.06) | benign(0.07) | TCGA-F5-6814-01 | Colorectum | rectum adenocarcinoma | Male | <65 | I/II | Unknown | Unknown | SD |
| ERH | SNV | Missense_Mutation | novel | c.125G>T | p.Arg42Ile | p.R42I | P84090 | protein_coding | tolerated(0.05) | benign(0.139) | TCGA-A5-A2K5-01 | Endometrium | uterine corpus endometrioid carcinoma | Female | >=65 | I/II | Unknown | Unknown | SD |
| ERH | SNV | Missense_Mutation | novel | c.299A>G | p.Gln100Arg | p.Q100R | P84090 | protein_coding | tolerated(0.48) | benign(0.006) | TCGA-AP-A1DK-01 | Endometrium | uterine corpus endometrioid carcinoma | Female | <65 | I/II | Unknown | Unknown | SD |
| ERH | SNV | Missense_Mutation | novel | c.295N>A | p.Ala99Thr | p.A99T | P84090 | protein_coding | deleterious(0.04) | benign(0.149) | TCGA-FI-A2D0-01 | Endometrium | uterine corpus endometrioid carcinoma | Female | <65 | I/II | Unknown | Unknown | SD |
| ERH | SNV | Missense_Mutation | novel | c.40N>T | p.Pro14Ser | p.P14S | P84090 | protein_coding | tolerated(0.09) | benign(0.22) | TCGA-HU-A4GY-01 | Stomach | stomach adenocarcinoma | Female | >=65 | III/IV | Unknown | Unknown | SD |
| ERH | SNV | Missense_Mutation | novel | c.289N>T | p.Arg97Trp | p.R97W | P84090 | protein_coding | tolerated(0.06) | benign(0.036) | TCGA-VQ-A91Z-01 | Stomach | stomach adenocarcinoma | Female | >=65 | III/IV | Chemotherapy | fluorouracil | PD |
| Page: 1 |
Top |
Related drugs of malignant transformation related genes |
| Identification of chemicals and drugs interact with genes involved in malignant transfromation |
| (DGIdb 4.0) |
| Entrez ID | Symbol | Category | Interaction Types | Drug Claim Name | Drug Name | PMIDs |
| Page: 1 |

Copyright 2023-Present -The University of Texas Health Science Center at Houston |