
|
|||||
|
 | |
| |
| |
| |
| |
| |
|
Gene: ERGIC3 |
Gene summary for ERGIC3 |
| Gene information | Species | Human | Gene symbol | ERGIC3 | Gene ID | 51614 |
| Gene name | ERGIC and golgi 3 | |
| Gene Alias | C20orf47 | |
| Cytomap | 20q11.22 | |
| Gene Type | protein-coding | GO ID | GO:0006810 | UniProtAcc | A2TJK5 |
Top |
Malignant transformation analysis |
| Identification of the aberrant gene expression in precancerous and cancerous lesions by comparing the gene expression of stem-like cells in diseased tissues with normal stem cells |
| Entrez ID | Symbol | Replicates | Species | Organ | Tissue | Adj P-value | Log2FC | Malignancy |
| 51614 | ERGIC3 | GSM4909285 | Human | Breast | IDC | 3.85e-02 | 2.33e-01 | 0.21 |
| 51614 | ERGIC3 | GSM4909286 | Human | Breast | IDC | 5.92e-09 | 4.23e-01 | 0.1081 |
| 51614 | ERGIC3 | GSM4909288 | Human | Breast | IDC | 4.65e-05 | -1.49e-01 | 0.0988 |
| 51614 | ERGIC3 | GSM4909294 | Human | Breast | IDC | 1.67e-05 | -2.33e-01 | 0.2022 |
| 51614 | ERGIC3 | GSM4909296 | Human | Breast | IDC | 1.57e-14 | 2.29e-01 | 0.1524 |
| 51614 | ERGIC3 | GSM4909297 | Human | Breast | IDC | 7.12e-22 | 5.49e-02 | 0.1517 |
| 51614 | ERGIC3 | GSM4909298 | Human | Breast | IDC | 3.88e-07 | 4.18e-01 | 0.1551 |
| 51614 | ERGIC3 | GSM4909301 | Human | Breast | IDC | 7.66e-03 | 1.22e-01 | 0.1577 |
| 51614 | ERGIC3 | GSM4909308 | Human | Breast | IDC | 3.87e-12 | 5.29e-01 | 0.158 |
| 51614 | ERGIC3 | GSM4909309 | Human | Breast | IDC | 1.56e-06 | 2.26e-01 | 0.0483 |
| 51614 | ERGIC3 | GSM4909311 | Human | Breast | IDC | 5.67e-47 | 1.29e-02 | 0.1534 |
| 51614 | ERGIC3 | GSM4909312 | Human | Breast | IDC | 1.07e-29 | 5.63e-01 | 0.1552 |
| 51614 | ERGIC3 | GSM4909313 | Human | Breast | IDC | 2.95e-05 | 1.88e-01 | 0.0391 |
| 51614 | ERGIC3 | GSM4909316 | Human | Breast | IDC | 3.11e-03 | -2.62e-01 | 0.21 |
| 51614 | ERGIC3 | GSM4909319 | Human | Breast | IDC | 6.80e-48 | -9.18e-02 | 0.1563 |
| 51614 | ERGIC3 | GSM4909320 | Human | Breast | IDC | 1.19e-12 | 3.67e-01 | 0.1575 |
| 51614 | ERGIC3 | GSM4909321 | Human | Breast | IDC | 3.75e-30 | 4.88e-01 | 0.1559 |
| 51614 | ERGIC3 | M2 | Human | Breast | IDC | 2.58e-02 | -4.00e-01 | 0.21 |
| 51614 | ERGIC3 | NCCBC14 | Human | Breast | DCIS | 1.30e-21 | -2.95e-01 | 0.2021 |
| 51614 | ERGIC3 | NCCBC2 | Human | Breast | DCIS | 1.14e-04 | -9.04e-02 | 0.1554 |
| Page: 1 2 3 4 5 6 7 8 9 10 11 12 |
| Tissue | Expression Dynamics | Abbreviation |
| Breast | 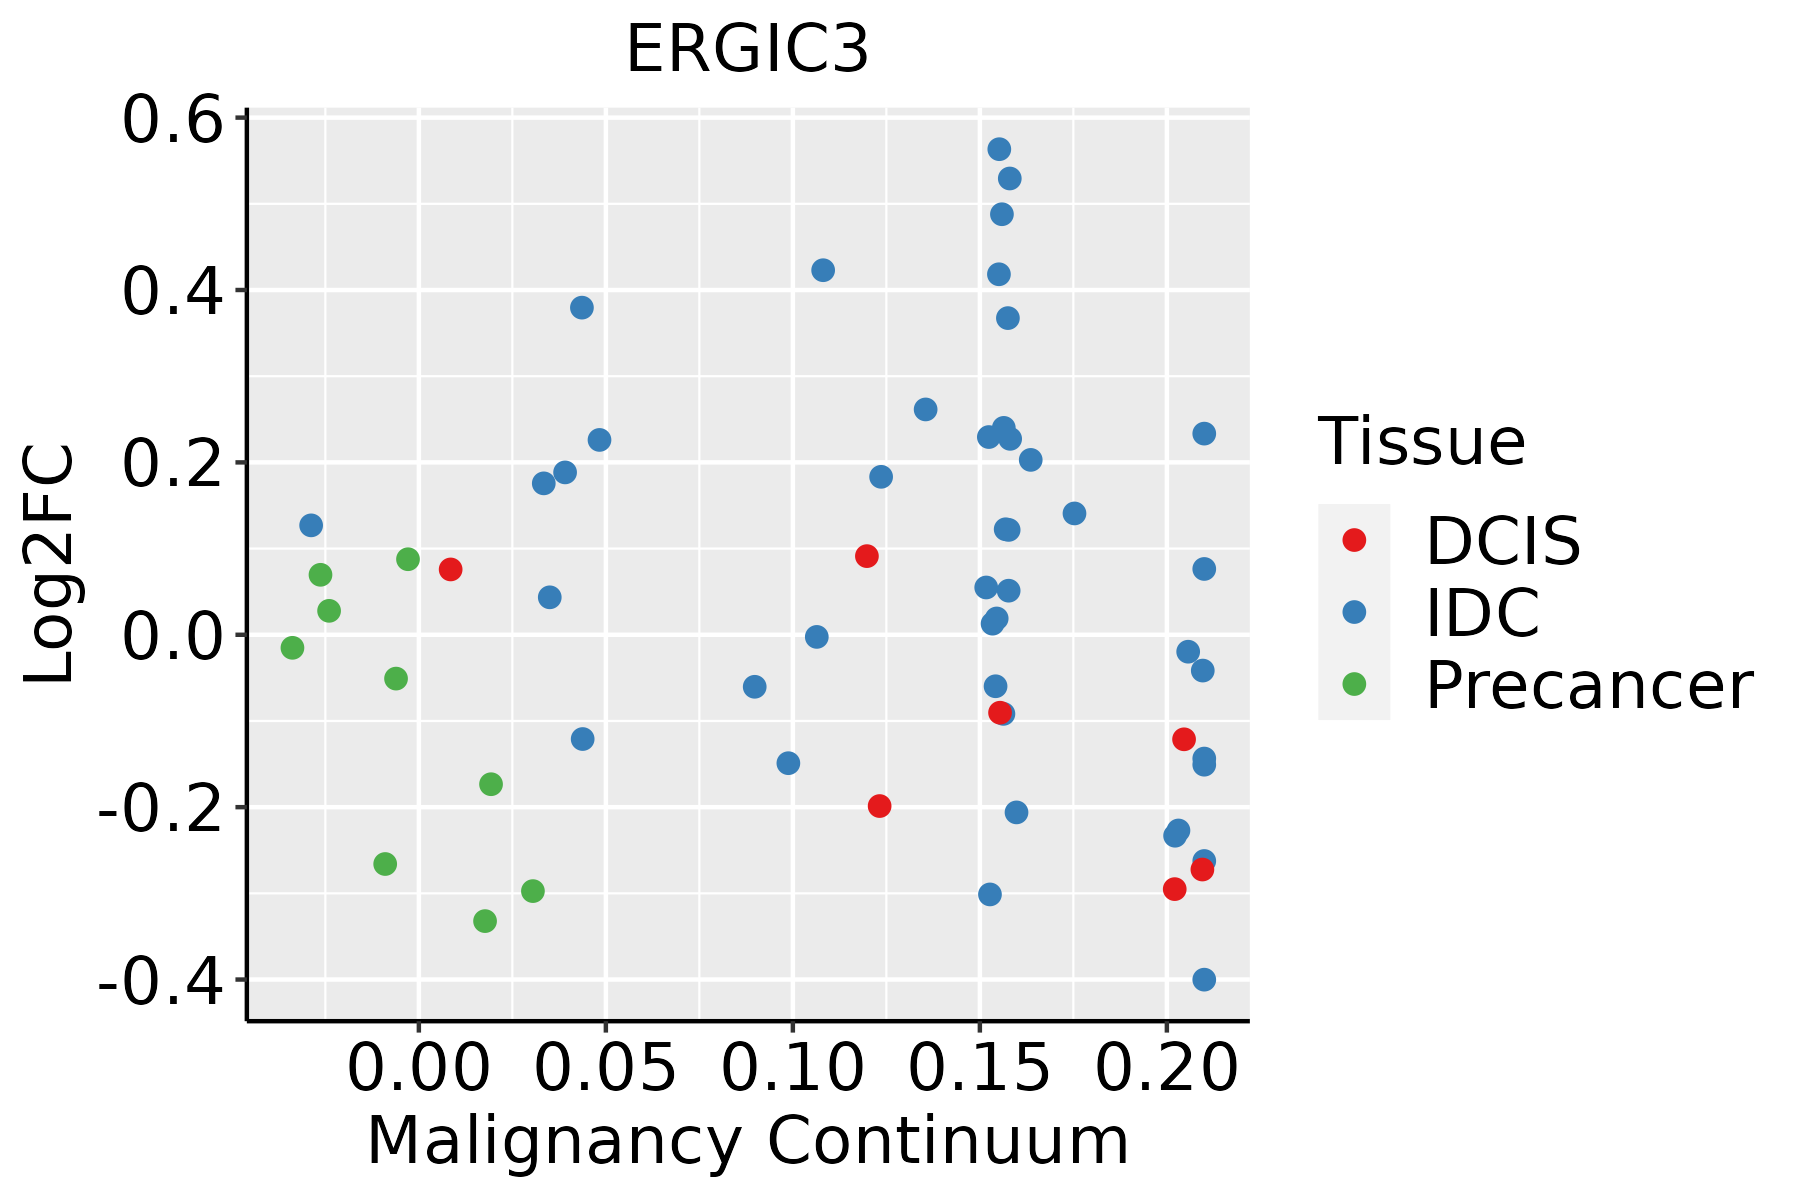 | IDC: Invasive ductal carcinoma |
| DCIS: Ductal carcinoma in situ | ||
| Precancer(BRCA1-mut): Precancerous lesion from BRCA1 mutation carriers | ||
| Colorectum (GSE201348) |  | FAP: Familial adenomatous polyposis |
| CRC: Colorectal cancer | ||
| Colorectum (HTA11) |  | AD: Adenomas |
| SER: Sessile serrated lesions | ||
| MSI-H: Microsatellite-high colorectal cancer | ||
| MSS: Microsatellite stable colorectal cancer | ||
| Endometrium | 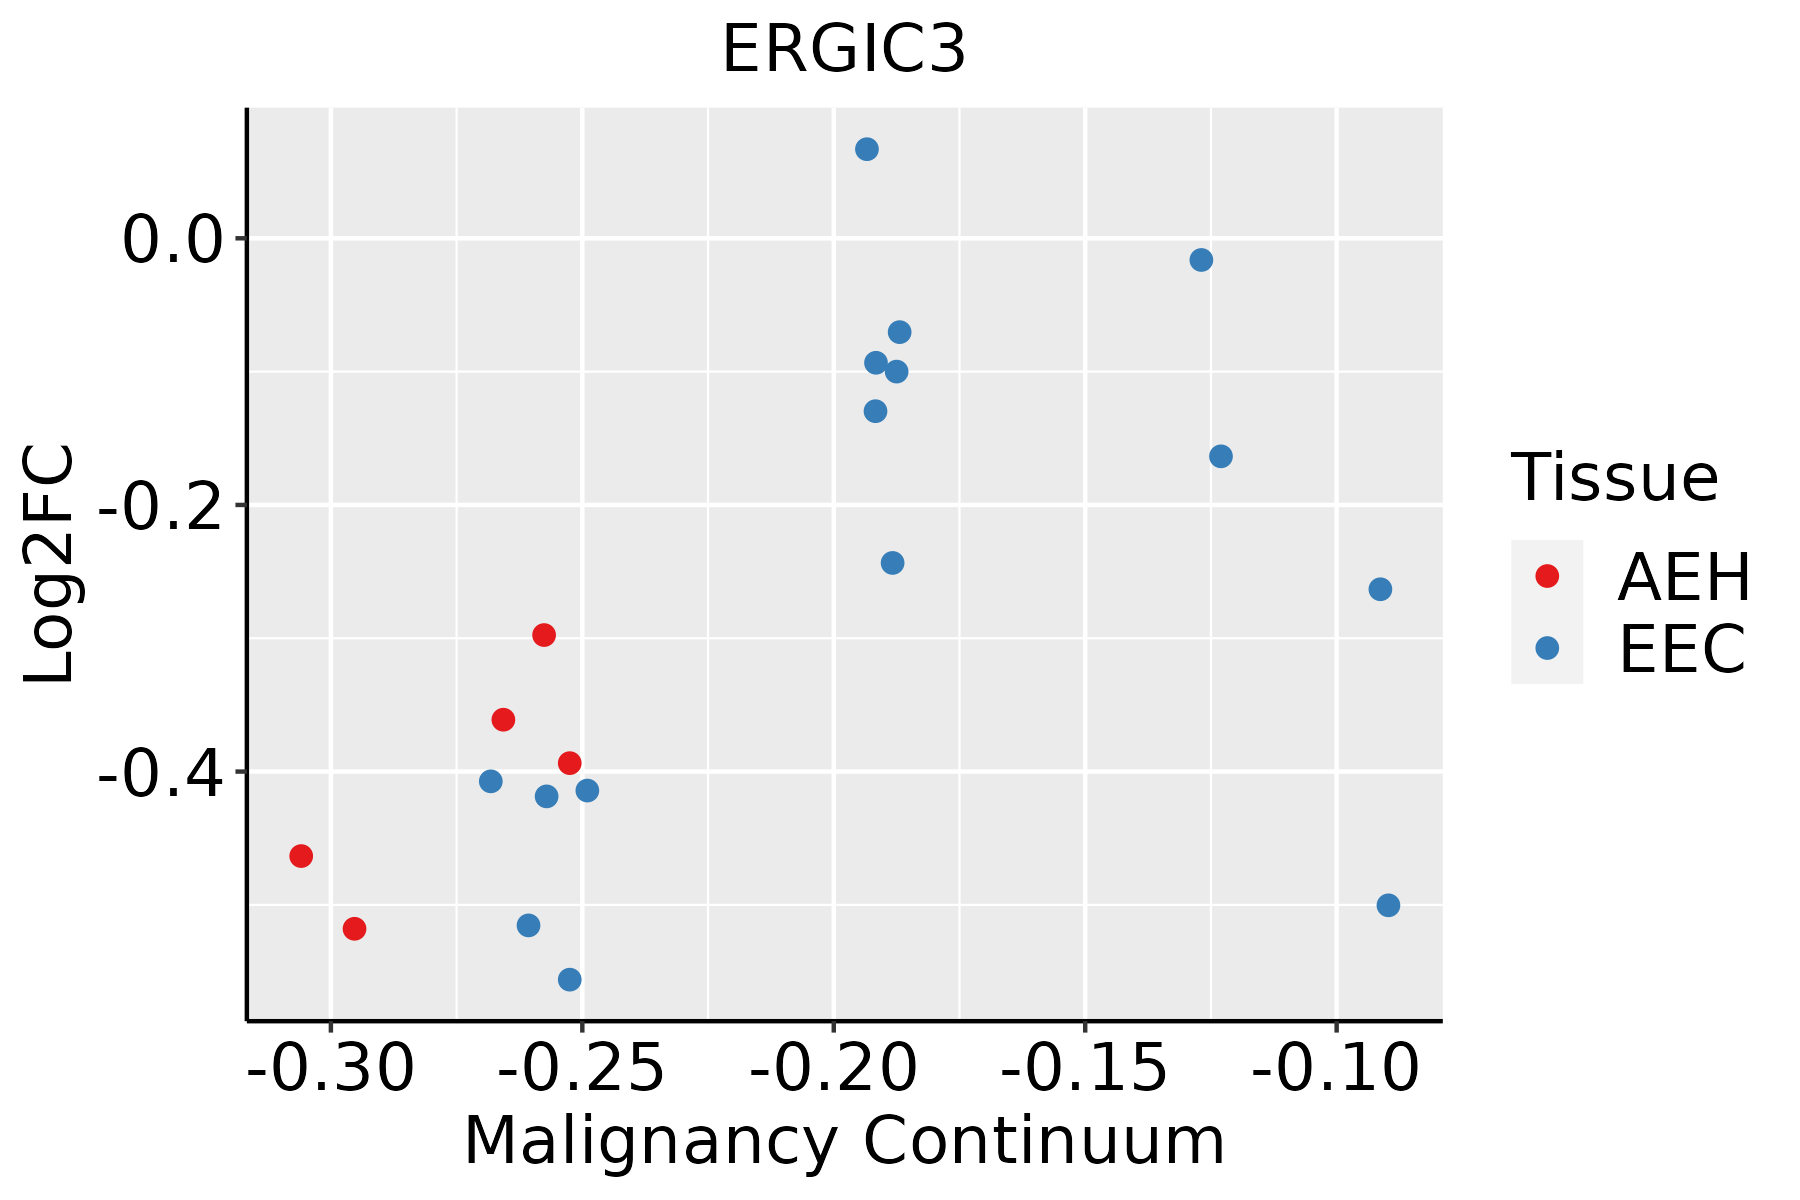 | AEH: Atypical endometrial hyperplasia |
| EEC: Endometrioid Cancer | ||
| Esophagus |  | ESCC: Esophageal squamous cell carcinoma |
| HGIN: High-grade intraepithelial neoplasias | ||
| LGIN: Low-grade intraepithelial neoplasias | ||
| Liver | 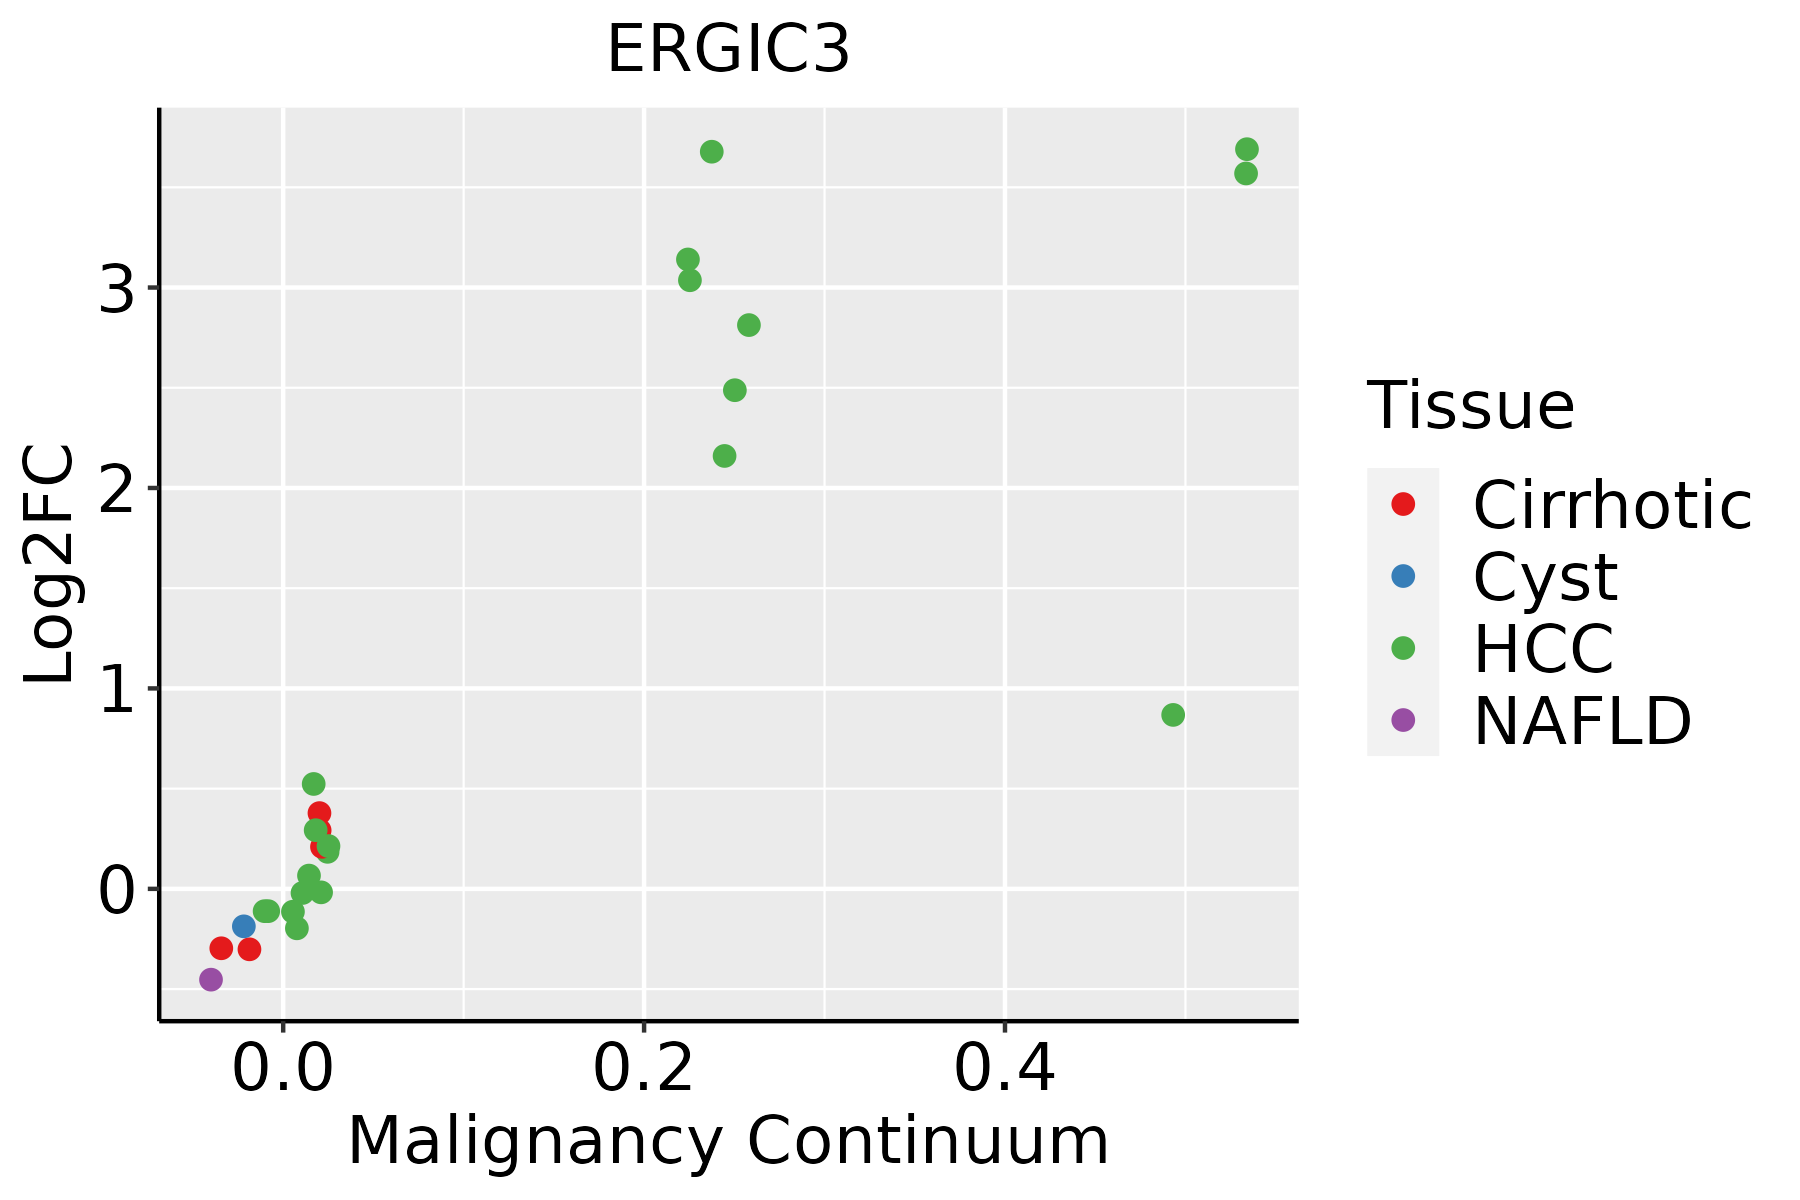 | HCC: Hepatocellular carcinoma |
| NAFLD: Non-alcoholic fatty liver disease | ||
| Oral Cavity | 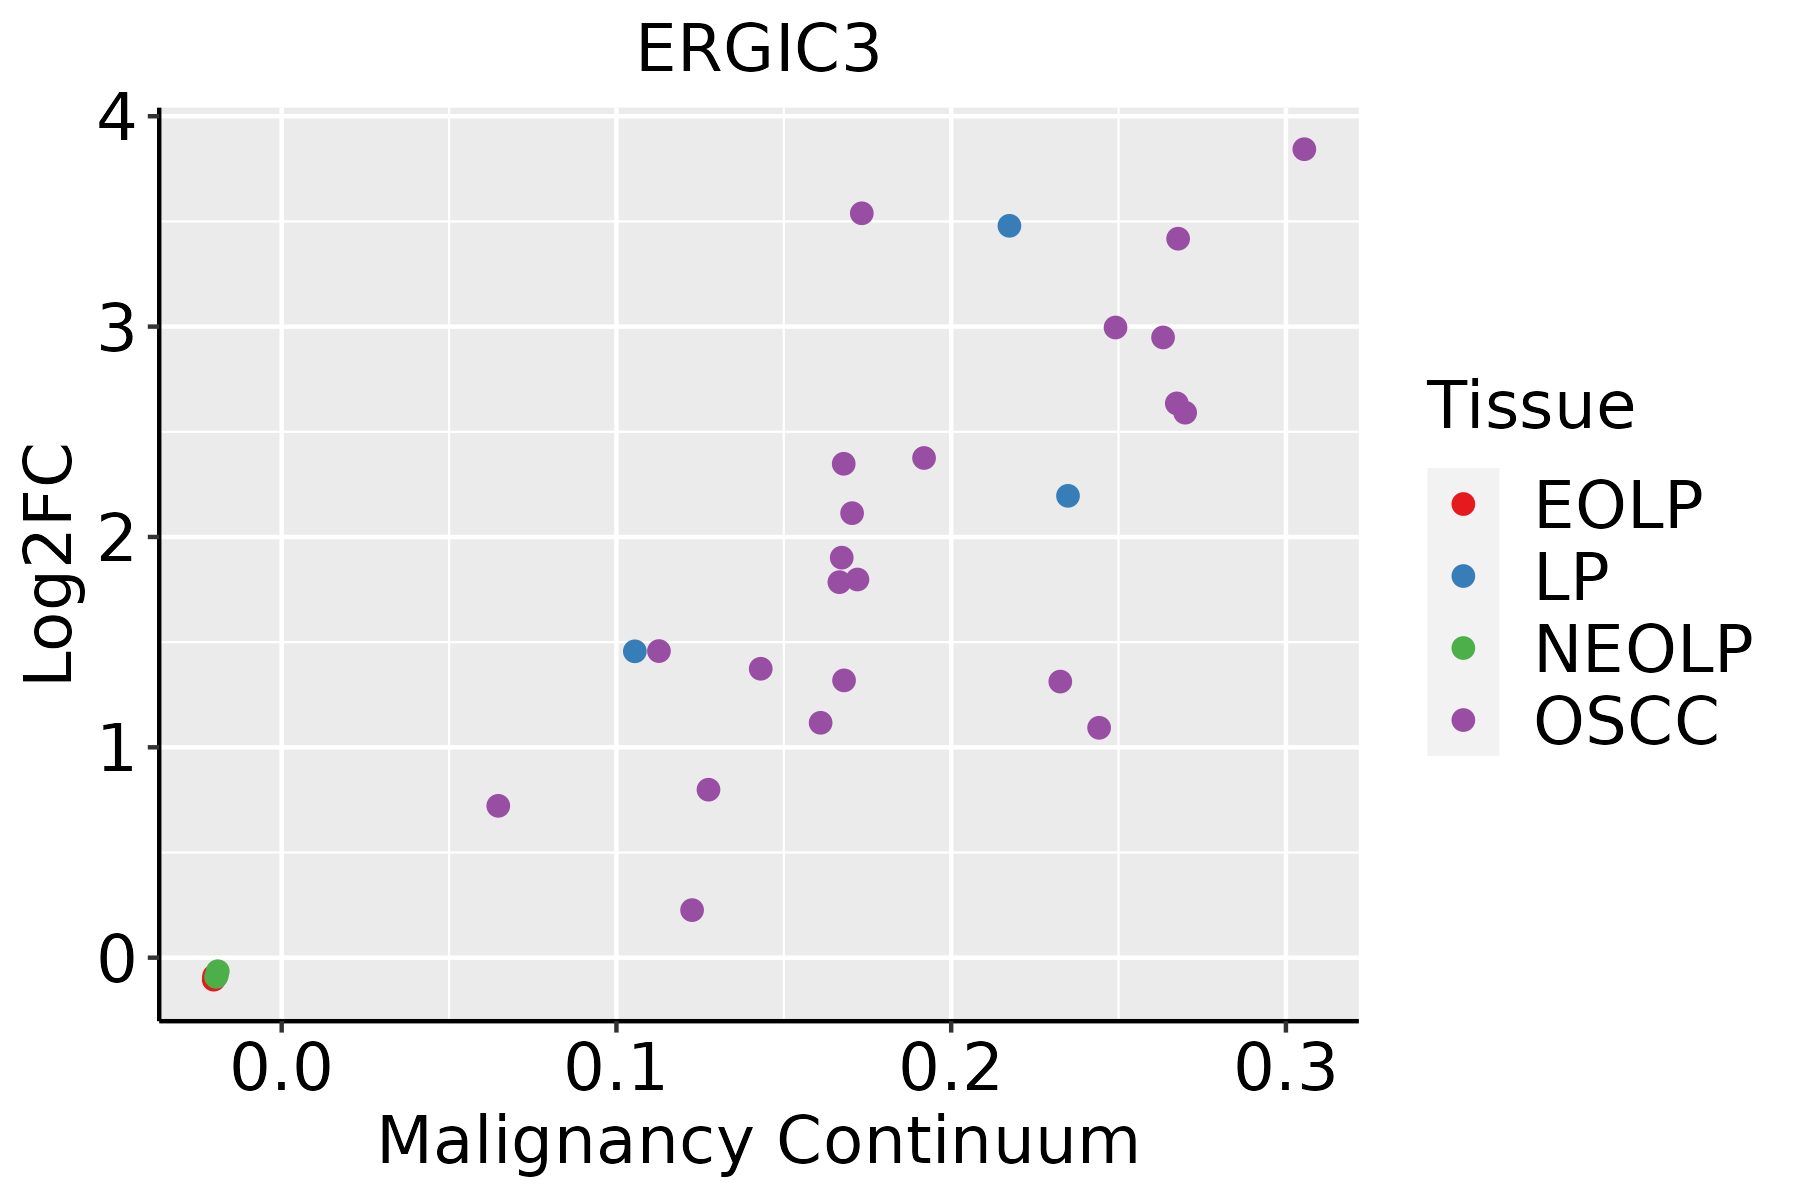 | EOLP: Erosive Oral lichen planus |
| LP: leukoplakia | ||
| NEOLP: Non-erosive oral lichen planus | ||
| OSCC: Oral squamous cell carcinoma | ||
| Prostate |  | BPH: Benign Prostatic Hyperplasia |
| Skin | 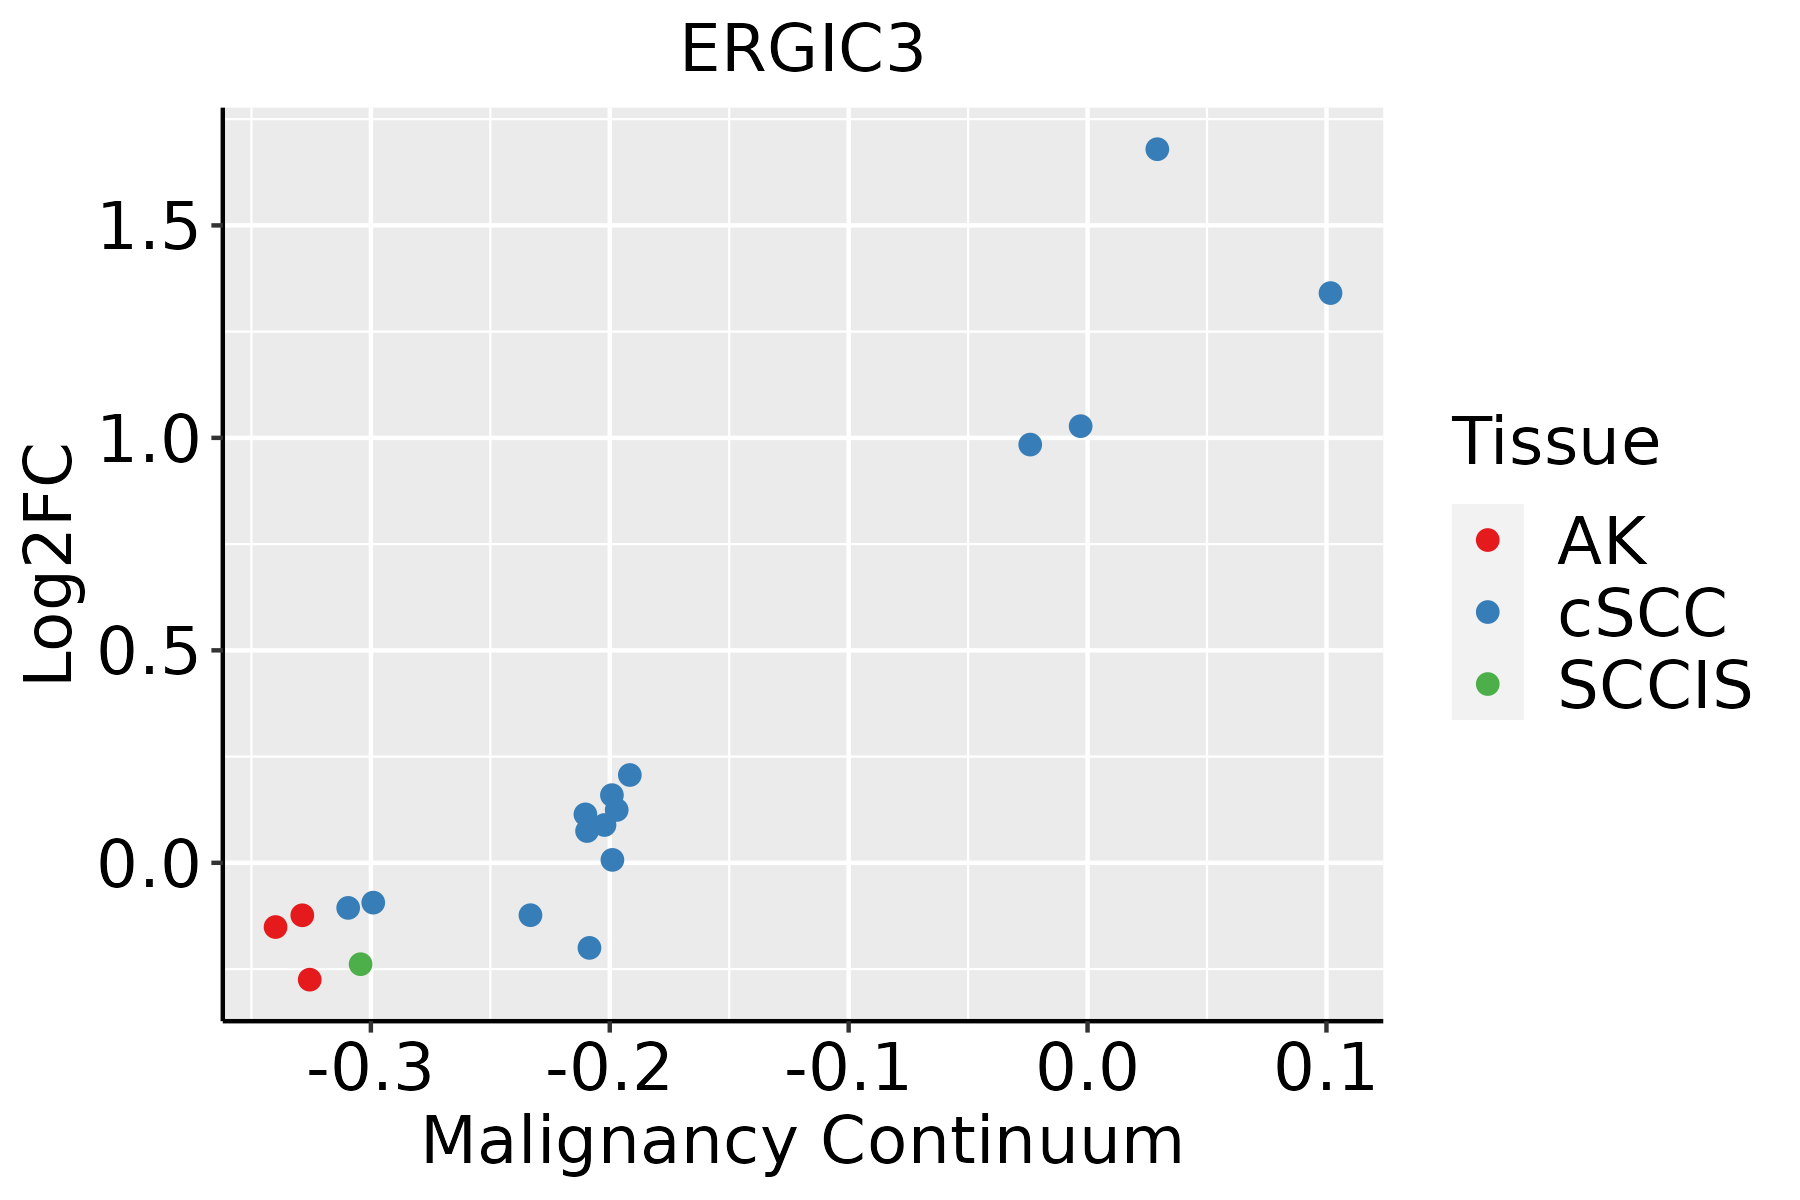 | AK: Actinic keratosis |
| cSCC: Cutaneous squamous cell carcinoma | ||
| SCCIS:squamous cell carcinoma in situ | ||
| Thyroid | 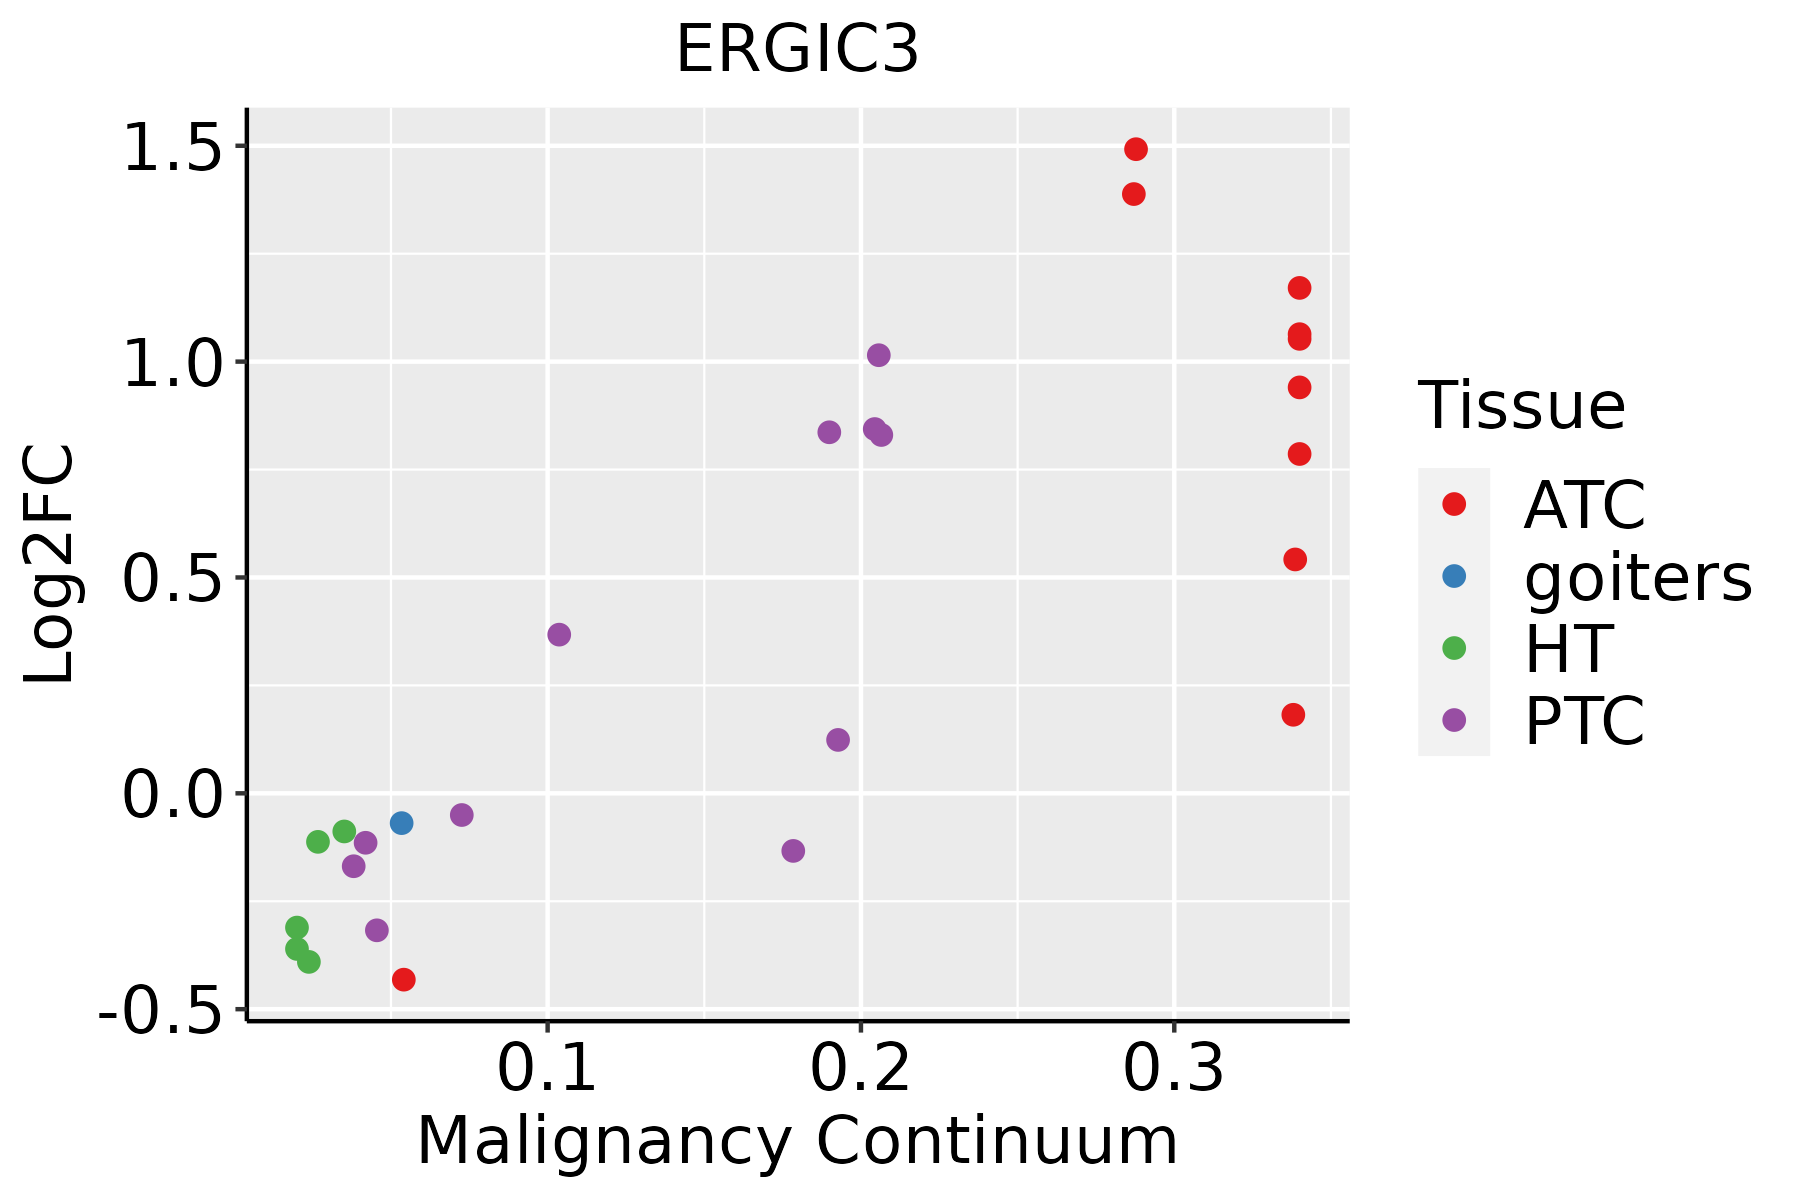 | ATC: Anaplastic thyroid cancer |
| HT: Hashimoto's thyroiditis | ||
| PTC: Papillary thyroid cancer |
| ∗log2FC in expression of this searched gene in stem-like cells from each diseased tissue sample relative to stem-like cells in normal samples in each tissue plotted against the malignancy continuum. Samples are colored based on if they are from different disease stage. |
Top |
Malignant transformation related pathway analysis |
| Find out the enriched GO biological processes and KEGG pathways involved in transition from healthy to precancer to cancer |
| Tissue | Disease Stage | Enriched GO biological Processes |
| Colorectum | AD |  |
| Colorectum | SER |  |
| Colorectum | MSS |  |
| Colorectum | MSI-H |  |
| Colorectum | FAP |  |
| ∗Top 15 enriched GO BP terms are showed in the bar plot of each disease state in each tissue. Each row represents a significant GO biological process which is colored according to the -log10(p.adjust). |
| Page: 1 2 3 4 5 6 7 8 9 |
| GO ID | Tissue | Disease Stage | Description | Gene Ratio | Bg Ratio | pvalue | p.adjust | Count |
| GO:00068906 | Breast | IDC | retrograde vesicle-mediated transport, Golgi to endoplasmic reticulum | 10/1434 | 52/18723 | 5.49e-03 | 4.03e-02 | 10 |
| GO:000689012 | Breast | DCIS | retrograde vesicle-mediated transport, Golgi to endoplasmic reticulum | 10/1390 | 52/18723 | 4.41e-03 | 3.41e-02 | 10 |
| GO:0048193 | Colorectum | AD | Golgi vesicle transport | 109/3918 | 296/18723 | 1.80e-10 | 1.68e-08 | 109 |
| GO:0006890 | Colorectum | AD | retrograde vesicle-mediated transport, Golgi to endoplasmic reticulum | 27/3918 | 52/18723 | 7.67e-07 | 2.70e-05 | 27 |
| GO:0006888 | Colorectum | AD | endoplasmic reticulum to Golgi vesicle-mediated transport | 44/3918 | 130/18723 | 4.13e-04 | 4.68e-03 | 44 |
| GO:00481931 | Colorectum | SER | Golgi vesicle transport | 79/2897 | 296/18723 | 4.20e-07 | 2.15e-05 | 79 |
| GO:00068901 | Colorectum | SER | retrograde vesicle-mediated transport, Golgi to endoplasmic reticulum | 20/2897 | 52/18723 | 4.80e-05 | 1.18e-03 | 20 |
| GO:00068881 | Colorectum | SER | endoplasmic reticulum to Golgi vesicle-mediated transport | 34/2897 | 130/18723 | 1.13e-03 | 1.29e-02 | 34 |
| GO:00481932 | Colorectum | MSS | Golgi vesicle transport | 101/3467 | 296/18723 | 9.09e-11 | 9.77e-09 | 101 |
| GO:00068902 | Colorectum | MSS | retrograde vesicle-mediated transport, Golgi to endoplasmic reticulum | 26/3467 | 52/18723 | 2.66e-07 | 1.10e-05 | 26 |
| GO:00068882 | Colorectum | MSS | endoplasmic reticulum to Golgi vesicle-mediated transport | 44/3467 | 130/18723 | 2.17e-05 | 4.60e-04 | 44 |
| GO:00068903 | Colorectum | MSI-H | retrograde vesicle-mediated transport, Golgi to endoplasmic reticulum | 13/1319 | 52/18723 | 4.72e-05 | 1.69e-03 | 13 |
| GO:00068883 | Colorectum | MSI-H | endoplasmic reticulum to Golgi vesicle-mediated transport | 22/1319 | 130/18723 | 1.05e-04 | 3.24e-03 | 22 |
| GO:00481933 | Colorectum | MSI-H | Golgi vesicle transport | 39/1319 | 296/18723 | 1.17e-04 | 3.51e-03 | 39 |
| GO:00481935 | Colorectum | CRC | Golgi vesicle transport | 59/2078 | 296/18723 | 5.47e-06 | 2.17e-04 | 59 |
| GO:00481939 | Endometrium | AEH | Golgi vesicle transport | 60/2100 | 296/18723 | 3.65e-06 | 9.79e-05 | 60 |
| GO:00068886 | Endometrium | AEH | endoplasmic reticulum to Golgi vesicle-mediated transport | 29/2100 | 130/18723 | 2.11e-04 | 2.59e-03 | 29 |
| GO:00068908 | Endometrium | AEH | retrograde vesicle-mediated transport, Golgi to endoplasmic reticulum | 15/2100 | 52/18723 | 4.20e-04 | 4.46e-03 | 15 |
| GO:004819313 | Endometrium | EEC | Golgi vesicle transport | 60/2168 | 296/18723 | 9.91e-06 | 2.17e-04 | 60 |
| GO:000688812 | Endometrium | EEC | endoplasmic reticulum to Golgi vesicle-mediated transport | 29/2168 | 130/18723 | 3.63e-04 | 3.95e-03 | 29 |
| Page: 1 2 3 |
| Pathway ID | Tissue | Disease Stage | Description | Gene Ratio | Bg Ratio | pvalue | p.adjust | qvalue | Count |
| Page: 1 |
Top |
Cell-cell communication analysis |
| Identification of potential cell-cell interactions between two cell types and their ligand-receptor pairs for different disease states |
| Ligand | Receptor | LRpair | Pathway | Tissue | Disease Stage |
| Page: 1 |
Top |
Single-cell gene regulatory network inference analysis |
| Find out the significant the regulons (TFs) and the target genes of each regulon across cell types for different disease states |
| TF | Cell Type | Tissue | Disease Stage | Target Gene | RSS | Regulon Activity |
| ∗The dot plots of a searched regulon are shown for all cell subpopulations in each disease state of each tissue based on the regulon specific score inferred using pySCENIC and by calculating the average expression. |
| Page: 1 |
Top |
Somatic mutation of malignant transformation related genes |
| Annotation of somatic variants for genes involved in malignant transformation |
| Hugo Symbol | Variant Class | Variant Classification | dbSNP RS | HGVSc | HGVSp | HGVSp Short | SWISSPROT | BIOTYPE | SIFT | PolyPhen | Tumor Sample Barcode | Tissue | Histology | Sex | Age | Stage | Therapy Types | Drugs | Outcome |
| ERGIC3 | insertion | Nonsense_Mutation | novel | c.658_659insCAGCCTGGGCAACATAGCAAGACCCT | p.Lys220ThrfsTer6 | p.K220Tfs*6 | Q9Y282 | protein_coding | TCGA-A2-A0EV-01 | Breast | breast invasive carcinoma | Female | >=65 | I/II | Unknown | Unknown | SD | ||
| ERGIC3 | insertion | Nonsense_Mutation | novel | c.505_506insAAAAAATTTTAAAAATTAAAAAAAGAAAACAGTCCTTCTGCCACT | p.Arg169delinsLysLysIleLeuLysIleLysLysArgLysGlnSerPheCysHisTer | p.R169delinsKKILKIKKRKQSFCH* | Q9Y282 | protein_coding | TCGA-BH-A0B1-01 | Breast | breast invasive carcinoma | Female | >=65 | I/II | Chemotherapy | adriamycin | SD | ||
| ERGIC3 | SNV | Missense_Mutation | c.76N>A | p.Gly26Arg | p.G26R | Q9Y282 | protein_coding | deleterious(0.01) | probably_damaging(0.94) | TCGA-A6-2683-01 | Colorectum | colon adenocarcinoma | Female | <65 | III/IV | Chemotherapy | irinotecan | PD | |
| ERGIC3 | SNV | Missense_Mutation | rs199935905 | c.499N>T | p.Arg167Cys | p.R167C | Q9Y282 | protein_coding | deleterious(0) | probably_damaging(0.934) | TCGA-AA-3950-01 | Colorectum | colon adenocarcinoma | Female | >=65 | I/II | Unknown | Unknown | SD |
| ERGIC3 | SNV | Missense_Mutation | novel | c.331N>T | p.Asp111Tyr | p.D111Y | Q9Y282 | protein_coding | tolerated(0.06) | possibly_damaging(0.521) | TCGA-AZ-4315-01 | Colorectum | colon adenocarcinoma | Male | <65 | I/II | Unknown | Unknown | SD |
| ERGIC3 | SNV | Missense_Mutation | c.941N>T | p.Ala314Val | p.A314V | Q9Y282 | protein_coding | tolerated(0.62) | benign(0.003) | TCGA-AZ-6598-01 | Colorectum | colon adenocarcinoma | Female | >=65 | I/II | Unknown | Unknown | SD | |
| ERGIC3 | SNV | Missense_Mutation | rs201180063 | c.1163N>T | p.Thr388Met | p.T388M | Q9Y282 | protein_coding | deleterious(0) | probably_damaging(0.959) | TCGA-CM-6162-01 | Colorectum | colon adenocarcinoma | Female | <65 | III/IV | Chemotherapy | oxaliplatin | SD |
| ERGIC3 | SNV | Missense_Mutation | rs139314230 | c.503N>A | p.Arg168His | p.R168H | Q9Y282 | protein_coding | tolerated(0.05) | benign(0.033) | TCGA-CM-6166-01 | Colorectum | colon adenocarcinoma | Female | <65 | I/II | Unknown | Unknown | SD |
| ERGIC3 | SNV | Missense_Mutation | c.159G>T | p.Glu53Asp | p.E53D | Q9Y282 | protein_coding | tolerated(0.53) | benign(0.011) | TCGA-AG-A002-01 | Colorectum | rectum adenocarcinoma | Male | <65 | I/II | Unknown | Unknown | SD | |
| ERGIC3 | SNV | Missense_Mutation | rs765811014 | c.982N>A | p.Val328Ile | p.V328I | Q9Y282 | protein_coding | tolerated(0.07) | benign(0.168) | TCGA-A5-A1OF-01 | Endometrium | uterine corpus endometrioid carcinoma | Female | <65 | I/II | Unknown | Unknown | SD |
| Page: 1 2 3 4 5 |
Top |
Related drugs of malignant transformation related genes |
| Identification of chemicals and drugs interact with genes involved in malignant transfromation |
| (DGIdb 4.0) |
| Entrez ID | Symbol | Category | Interaction Types | Drug Claim Name | Drug Name | PMIDs |
| Page: 1 |

Copyright 2023-Present -The University of Texas Health Science Center at Houston |