Schematic overview of the cellular and molecular mechanisms involved in the cancer progression, including the proposed cellular and molecular mechanisms in cancer cells trajectory. AT1: alveolar type 1 cells; AT2: alveolar type 2 cells; AAH: atypical adenomatous hyperplasia; AIS: adenocarcinoma in situ; MIA: minimally invasive adenocarcinoma; IA: invasive adenocarcinoma; EMT: epithelial-mesenchymal transition

Home

Download

Statistics

Help

Contact

Center for Computational Systems Medicine
leaf

Gene summary

leaf

Malignant transformation analysis

leaf

Malignant transformation related pathway analysis

leaf

Cell-cell communication analysis

leaf

Single-cell gene regulatory network inference analysis

leaf

Somatic mutation of malignant transformation related genes

leaf

Related drugs of malignant transformation related genes

Gene: ERGIC2

Gene summary for ERGIC2

check button Gene summary.

Gene informationSpeciesHuman
Gene symbol

ERGIC2

Gene ID

51290

Gene nameERGIC and golgi 2
Gene AliasCDA14
Cytomap12p11.22
Gene Typeprotein-coding
GO ID

GO:0006810

UniProtAcc

A0A024RB08


Top

Malignant transformation analysis

check button Identification of the aberrant gene expression in precancerous and cancerous lesions by comparing the gene expression of stem-like cells in diseased tissues with normal stem cells
check button Malignant transformation involving gene list.
Entrez IDSymbolReplicatesSpeciesOrganTissueAdj P-valueLog2FCMalignancy
51290ERGIC2LZE2THumanEsophagusESCC2.46e-023.49e-010.082
51290ERGIC2LZE4THumanEsophagusESCC2.27e-195.15e-010.0811
51290ERGIC2LZE7THumanEsophagusESCC2.36e-075.96e-010.0667
51290ERGIC2LZE8THumanEsophagusESCC5.81e-229.95e-010.067
51290ERGIC2LZE20THumanEsophagusESCC3.10e-164.68e-010.0662
51290ERGIC2LZE22D1HumanEsophagusHGIN9.57e-051.08e-010.0595
51290ERGIC2LZE22THumanEsophagusESCC2.05e-043.00e-010.068
51290ERGIC2LZE24THumanEsophagusESCC1.83e-317.36e-010.0596
51290ERGIC2LZE22D3HumanEsophagusHGIN4.41e-022.75e-010.0653
51290ERGIC2LZE21THumanEsophagusESCC9.44e-033.62e-010.0655
51290ERGIC2LZE6THumanEsophagusESCC1.76e-082.58e-010.0845
51290ERGIC2P1T-EHumanEsophagusESCC3.31e-095.31e-010.0875
51290ERGIC2P2T-EHumanEsophagusESCC1.12e-641.12e+000.1177
51290ERGIC2P4T-EHumanEsophagusESCC2.82e-461.04e+000.1323
51290ERGIC2P5T-EHumanEsophagusESCC7.19e-286.65e-010.1327
51290ERGIC2P8T-EHumanEsophagusESCC8.73e-491.00e+000.0889
51290ERGIC2P9T-EHumanEsophagusESCC5.70e-173.81e-010.1131
51290ERGIC2P10T-EHumanEsophagusESCC2.94e-489.17e-010.116
51290ERGIC2P11T-EHumanEsophagusESCC3.08e-196.70e-010.1426
51290ERGIC2P12T-EHumanEsophagusESCC1.17e-621.21e+000.1122
Page: 1 2 3 4 5 6 7 

check button Transcriptomic changes along malignancy continuum.
TissueExpression DynamicsAbbreviation
EsophagusThe image shows the transcriptomic changes along malignancy continuum.log2FC in expression of this searched gene in stem-like cells from each diseased tissue sample relative to stem-like cells in normal samples in each tissue plotted against the malignancy continuum. Samples are colored based on if they are from different disease stage.
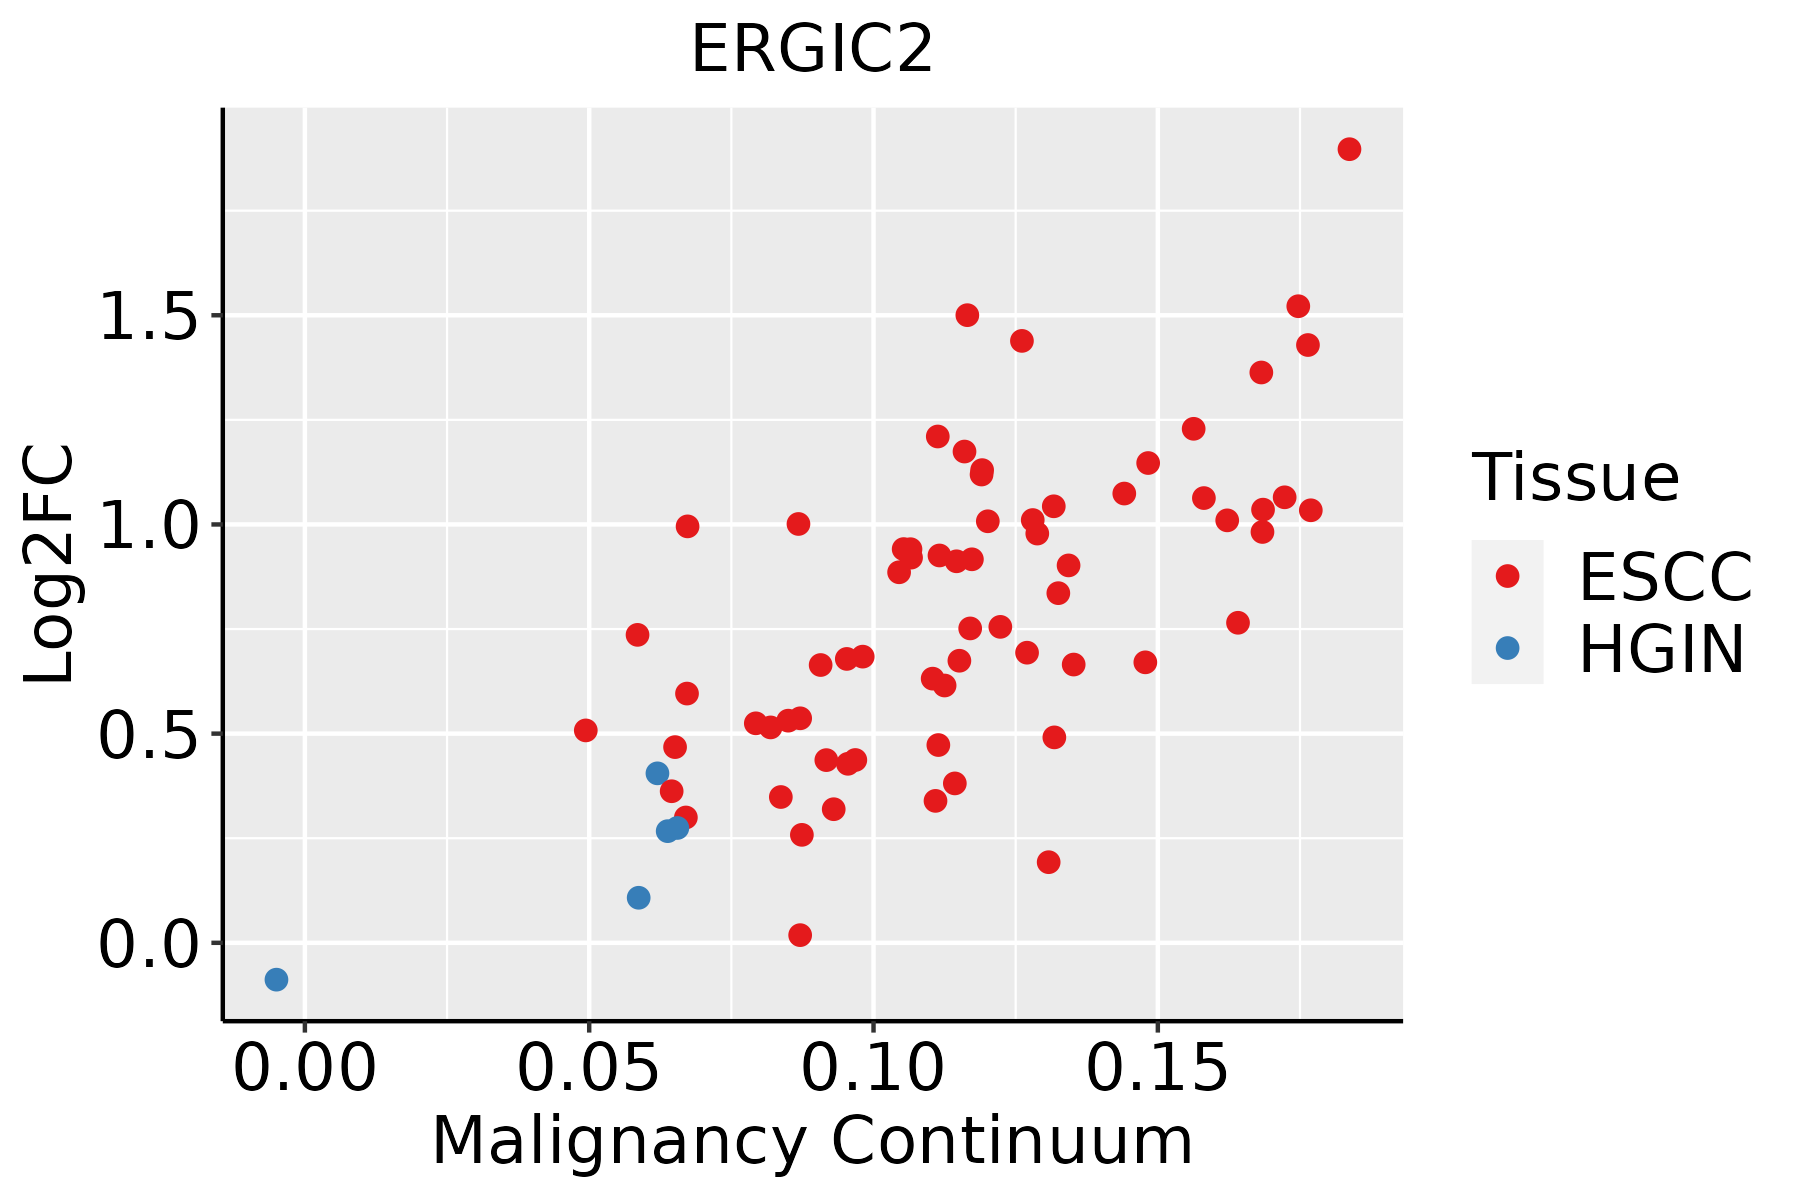
ESCC: Esophageal squamous cell carcinoma
HGIN: High-grade intraepithelial neoplasias
LGIN: Low-grade intraepithelial neoplasias
LiverThe image shows the transcriptomic changes along malignancy continuum.log2FC in expression of this searched gene in stem-like cells from each diseased tissue sample relative to stem-like cells in normal samples in each tissue plotted against the malignancy continuum. Samples are colored based on if they are from different disease stage.
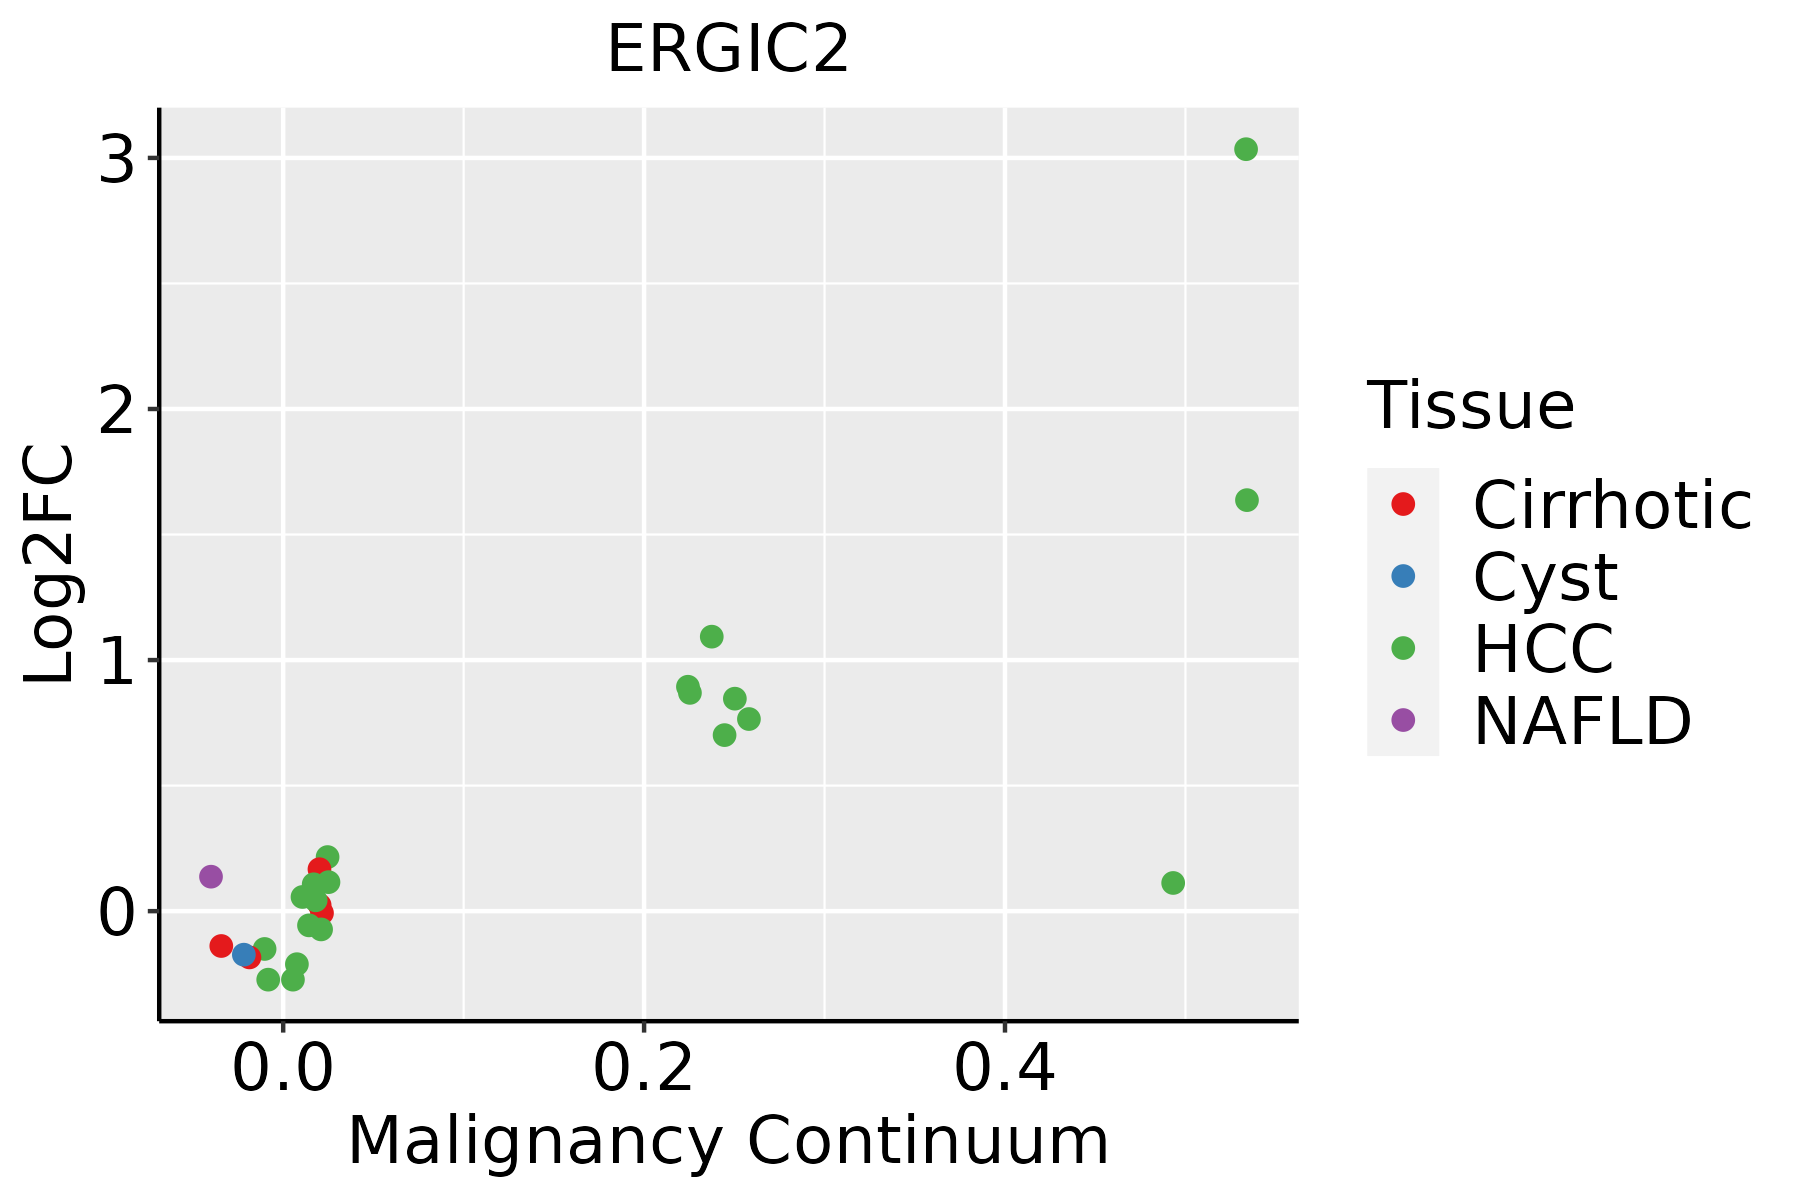
HCC: Hepatocellular carcinoma
NAFLD: Non-alcoholic fatty liver disease
Oral CavityThe image shows the transcriptomic changes along malignancy continuum.log2FC in expression of this searched gene in stem-like cells from each diseased tissue sample relative to stem-like cells in normal samples in each tissue plotted against the malignancy continuum. Samples are colored based on if they are from different disease stage.
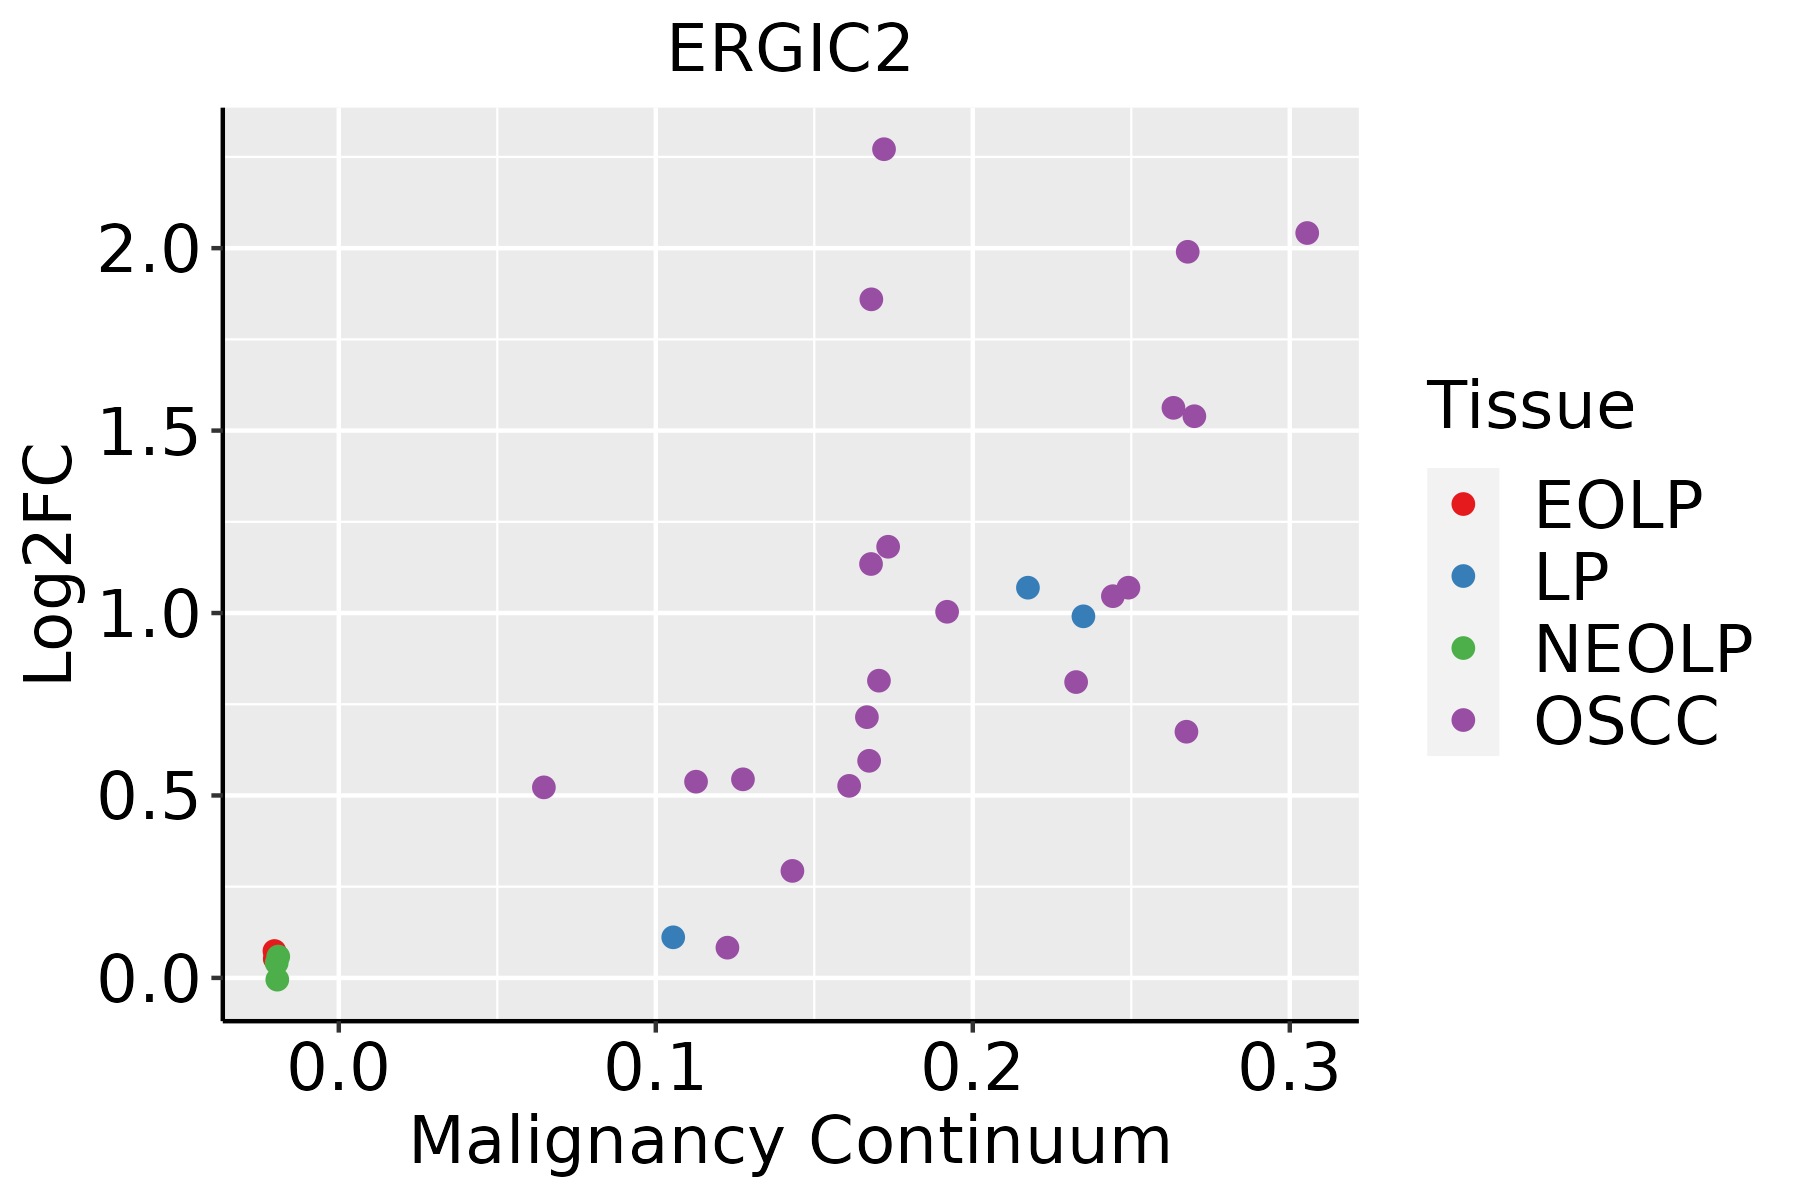
EOLP: Erosive Oral lichen planus
LP: leukoplakia
NEOLP: Non-erosive oral lichen planus
OSCC: Oral squamous cell carcinoma
ProstateThe image shows the transcriptomic changes along malignancy continuum.log2FC in expression of this searched gene in stem-like cells from each diseased tissue sample relative to stem-like cells in normal samples in each tissue plotted against the malignancy continuum. Samples are colored based on if they are from different disease stage.BPH: Benign Prostatic Hyperplasia
SkinThe image shows the transcriptomic changes along malignancy continuum.log2FC in expression of this searched gene in stem-like cells from each diseased tissue sample relative to stem-like cells in normal samples in each tissue plotted against the malignancy continuum. Samples are colored based on if they are from different disease stage.
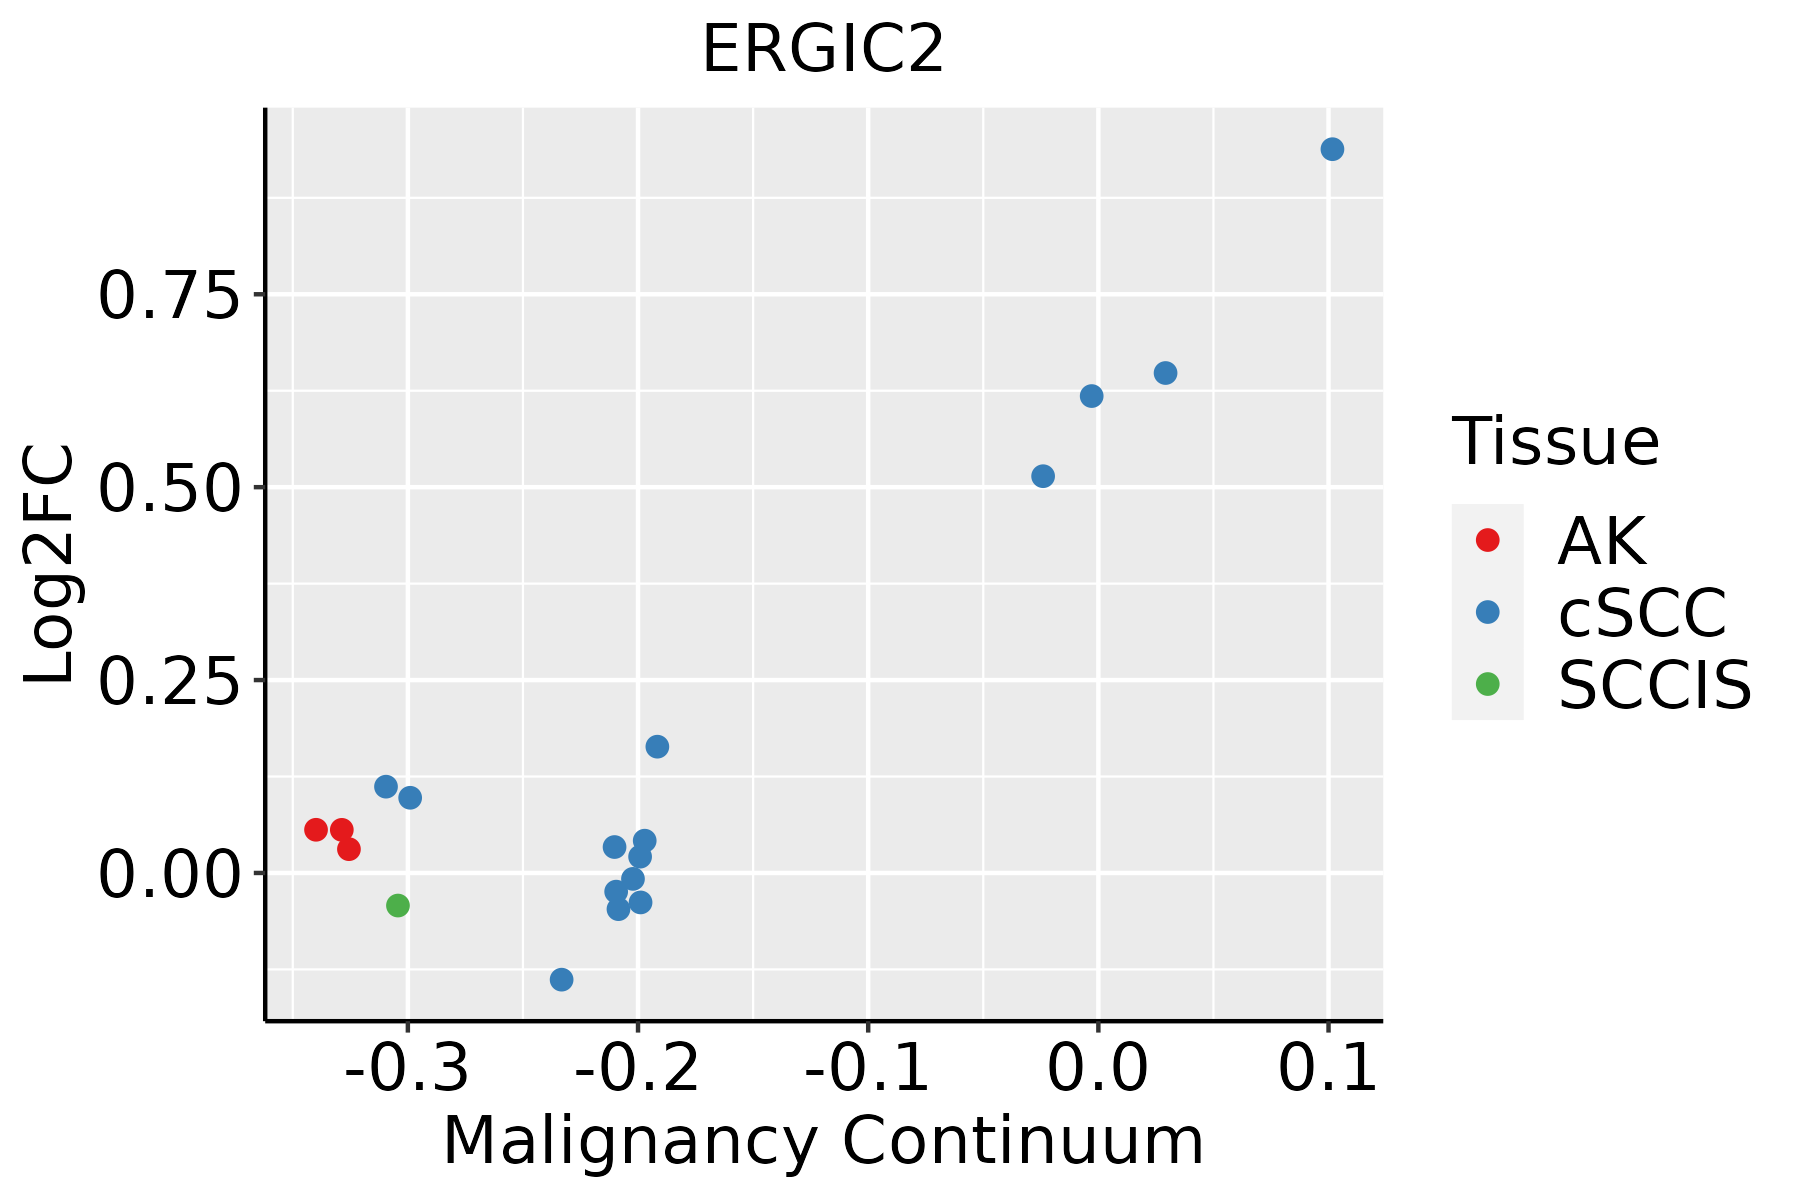
AK: Actinic keratosis
cSCC: Cutaneous squamous cell carcinoma
SCCIS:squamous cell carcinoma in situ
ThyroidThe image shows the transcriptomic changes along malignancy continuum.log2FC in expression of this searched gene in stem-like cells from each diseased tissue sample relative to stem-like cells in normal samples in each tissue plotted against the malignancy continuum. Samples are colored based on if they are from different disease stage.ATC: Anaplastic thyroid cancer
HT: Hashimoto's thyroiditis
PTC: Papillary thyroid cancer
∗log2FC in expression of this searched gene in stem-like cells from each diseased tissue sample relative to stem-like cells in normal samples in each tissue plotted against the malignancy continuum. Samples are colored based on if they are from different disease stage.

Top

Malignant transformation related pathway analysis

check buttonFind out the enriched GO biological processes and KEGG pathways involved in transition from healthy to precancer to cancer
check button Figure of enriched GO biological processes.
TissueDisease StageEnriched GO biological Processes
ColorectumADGO analysis - Figure of enriched GO biological processes: Top 15 enriched GO BP terms are showed in the bar plot of each disease state in each tissue. Each row represents a significant GO biological process which is colored according to the -log10(p.adjust).
ColorectumSERGO analysis - Figure of enriched GO biological processes: Top 15 enriched GO BP terms are showed in the bar plot of each disease state in each tissue. Each row represents a significant GO biological process which is colored according to the -log10(p.adjust).
ColorectumMSSGO analysis - Figure of enriched GO biological processes: Top 15 enriched GO BP terms are showed in the bar plot of each disease state in each tissue. Each row represents a significant GO biological process which is colored according to the -log10(p.adjust).
ColorectumMSI-HGO analysis - Figure of enriched GO biological processes: Top 15 enriched GO BP terms are showed in the bar plot of each disease state in each tissue. Each row represents a significant GO biological process which is colored according to the -log10(p.adjust).
ColorectumFAPGO analysis - Figure of enriched GO biological processes: Top 15 enriched GO BP terms are showed in the bar plot of each disease state in each tissue. Each row represents a significant GO biological process which is colored according to the -log10(p.adjust).
∗Top 15 enriched GO BP terms are showed in the bar plot of each disease state in each tissue. Each row represents a significant GO biological process which is colored according to the -log10(p.adjust).
Page: 1 2 3 4 5 6 7 8 9 

check button Enriched GO biological processes.
GO IDTissueDisease StageDescriptionGene RatioBg Ratiopvaluep.adjustCount
GO:004819317EsophagusHGINGolgi vesicle transport83/2587296/187238.59e-118.89e-0983
GO:00068889EsophagusHGINendoplasmic reticulum to Golgi vesicle-mediated transport40/2587130/187234.67e-072.07e-0540
GO:000689016EsophagusHGINretrograde vesicle-mediated transport, Golgi to endoplasmic reticulum19/258752/187233.44e-058.67e-0419
GO:004819318EsophagusESCCGolgi vesicle transport231/8552296/187231.82e-309.63e-28231
GO:000688815EsophagusESCCendoplasmic reticulum to Golgi vesicle-mediated transport102/8552130/187231.73e-149.22e-13102
GO:000689017EsophagusESCCretrograde vesicle-mediated transport, Golgi to endoplasmic reticulum46/855252/187231.23e-103.66e-0946
GO:004819311LiverCirrhoticGolgi vesicle transport153/4634296/187231.02e-236.43e-21153
GO:000688811LiverCirrhoticendoplasmic reticulum to Golgi vesicle-mediated transport77/4634130/187235.78e-177.56e-1577
GO:00068905LiverCirrhoticretrograde vesicle-mediated transport, Golgi to endoplasmic reticulum29/463452/187231.69e-063.22e-0529
GO:004819321LiverHCCGolgi vesicle transport217/7958296/187232.58e-271.02e-24217
GO:000688821LiverHCCendoplasmic reticulum to Golgi vesicle-mediated transport100/7958130/187231.15e-158.67e-14100
GO:000689011LiverHCCretrograde vesicle-mediated transport, Golgi to endoplasmic reticulum36/795852/187238.79e-057.66e-0436
GO:004819315Oral cavityOSCCGolgi vesicle transport209/7305296/187231.39e-286.30e-26209
GO:00068888Oral cavityOSCCendoplasmic reticulum to Golgi vesicle-mediated transport97/7305130/187231.42e-161.15e-1497
GO:000689010Oral cavityOSCCretrograde vesicle-mediated transport, Golgi to endoplasmic reticulum40/730552/187232.86e-085.50e-0740
GO:004819316Oral cavityLPGolgi vesicle transport141/4623296/187236.11e-181.06e-15141
GO:000688814Oral cavityLPendoplasmic reticulum to Golgi vesicle-mediated transport67/4623130/187233.74e-112.39e-0967
GO:000689015Oral cavityLPretrograde vesicle-mediated transport, Golgi to endoplasmic reticulum29/462352/187231.60e-063.79e-0529
GO:004819310ProstateBPHGolgi vesicle transport102/3107296/187233.90e-144.56e-12102
GO:00068887ProstateBPHendoplasmic reticulum to Golgi vesicle-mediated transport46/3107130/187231.53e-073.53e-0646
Page: 1 2 

check button Enriched KEGG pathways.
Pathway IDTissueDisease StageDescriptionGene RatioBg Ratiopvaluep.adjustqvalueCount
Page: 1 

Top

Cell-cell communication analysis

check buttonIdentification of potential cell-cell interactions between two cell types and their ligand-receptor pairs for different disease states
LigandReceptorLRpairPathwayTissueDisease Stage
Page: 1 

Top

Single-cell gene regulatory network inference analysis

check buttonFind out the significant the regulons (TFs) and the target genes of each regulon across cell types for different disease states
TFCell TypeTissueDisease StageTarget GeneRSSRegulon Activity
∗The dot plots of a searched regulon are shown for all cell subpopulations in each disease state of each tissue based on the regulon specific score inferred using pySCENIC and by calculating the average expression.
Page: 1 

Top

Somatic mutation of malignant transformation related genes

check buttonAnnotation of somatic variants for genes involved in malignant transformation
Hugo SymbolVariant ClassVariant ClassificationdbSNP RSHGVScHGVSpHGVSp ShortSWISSPROTBIOTYPESIFTPolyPhenTumor Sample BarcodeTissueHistologySexAgeStageTherapy TypesDrugsOutcome
ERGIC2SNVMissense_Mutationnovelc.556C>Tp.His186Tyrp.H186YQ96RQ1protein_codingdeleterious(0)probably_damaging(0.99)TCGA-VS-A94X-01Cervixcervical & endocervical cancerFemale<65I/IIChemotherapycisplatinPD
ERGIC2SNVMissense_Mutationnovelc.739N>Cp.Phe247Leup.F247LQ96RQ1protein_codingdeleterious(0.01)possibly_damaging(0.489)TCGA-F5-6814-01Colorectumrectum adenocarcinomaMale<65I/IIUnknownUnknownSD
ERGIC2SNVMissense_Mutationnovelc.677T>Cp.Val226Alap.V226AQ96RQ1protein_codingtolerated(0.4)benign(0.009)TCGA-A5-A0G2-01Endometriumuterine corpus endometrioid carcinomaFemale<65III/IVUnknownUnknownSD
ERGIC2SNVMissense_Mutationnovelc.61N>Cp.Lys21Glnp.K21QQ96RQ1protein_codingdeleterious(0)probably_damaging(1)TCGA-AJ-A3BH-01Endometriumuterine corpus endometrioid carcinomaFemaleUnknownI/IIUnknownUnknownSD
ERGIC2SNVMissense_Mutationc.517C>Ap.His173Asnp.H173NQ96RQ1protein_codingdeleterious(0)probably_damaging(0.948)TCGA-AP-A056-01Endometriumuterine corpus endometrioid carcinomaFemale<65I/IIUnknownUnknownSD
ERGIC2SNVMissense_Mutationc.337G>Ap.Val113Ilep.V113IQ96RQ1protein_codingtolerated(0.41)benign(0)TCGA-AP-A056-01Endometriumuterine corpus endometrioid carcinomaFemale<65I/IIUnknownUnknownSD
ERGIC2SNVMissense_Mutationc.224G>Tp.Arg75Ilep.R75IQ96RQ1protein_codingdeleterious(0)benign(0.206)TCGA-AP-A056-01Endometriumuterine corpus endometrioid carcinomaFemale<65I/IIUnknownUnknownSD
ERGIC2SNVMissense_Mutationnovelc.670G>Ap.Glu224Lysp.E224KQ96RQ1protein_codingtolerated(0.26)benign(0.056)TCGA-AP-A1DV-01Endometriumuterine corpus endometrioid carcinomaFemale<65I/IIUnknownUnknownSD
ERGIC2SNVMissense_Mutationrs761483514c.590N>Ap.Arg197Hisp.R197HQ96RQ1protein_codingdeleterious(0.04)possibly_damaging(0.88)TCGA-AX-A05Z-01Endometriumuterine corpus endometrioid carcinomaFemale<65III/IVChemotherapyadriamycinSD
ERGIC2SNVMissense_Mutationrs375624509c.17N>Ap.Arg6Glnp.R6QQ96RQ1protein_codingtolerated(0.07)benign(0.181)TCGA-AX-A1CE-01Endometriumuterine corpus endometrioid carcinomaFemale<65I/IIUnspecificPaclitaxelSD
Page: 1 2 3 

Top

Related drugs of malignant transformation related genes

check buttonIdentification of chemicals and drugs interact with genes involved in malignant transfromation
(DGIdb 4.0)
Entrez IDSymbolCategoryInteraction TypesDrug Claim NameDrug NamePMIDs
Page: 1