Schematic overview of the cellular and molecular mechanisms involved in the cancer progression, including the proposed cellular and molecular mechanisms in cancer cells trajectory. AT1: alveolar type 1 cells; AT2: alveolar type 2 cells; AAH: atypical adenomatous hyperplasia; AIS: adenocarcinoma in situ; MIA: minimally invasive adenocarcinoma; IA: invasive adenocarcinoma; EMT: epithelial-mesenchymal transition

Home

Download

Statistics

Help

Contact

Center for Computational Systems Medicine
leaf

Gene summary

leaf

Malignant transformation analysis

leaf

Malignant transformation related pathway analysis

leaf

Cell-cell communication analysis

leaf

Single-cell gene regulatory network inference analysis

leaf

Somatic mutation of malignant transformation related genes

leaf

Related drugs of malignant transformation related genes

Gene: ERGIC1

Gene summary for ERGIC1

check button Gene summary.

Gene informationSpeciesHuman
Gene symbol

ERGIC1

Gene ID

57222

Gene nameendoplasmic reticulum-golgi intermediate compartment 1
Gene AliasAMC2
Cytomap5q35.1
Gene Typeprotein-coding
GO ID

GO:0006810

UniProtAcc

Q969X5


Top

Malignant transformation analysis

check button Identification of the aberrant gene expression in precancerous and cancerous lesions by comparing the gene expression of stem-like cells in diseased tissues with normal stem cells
check button Malignant transformation involving gene list.
Entrez IDSymbolReplicatesSpeciesOrganTissueAdj P-valueLog2FCMalignancy
57222ERGIC1GSM4909290HumanBreastIDC4.57e-022.02e-010.2096
57222ERGIC1GSM4909291HumanBreastIDC1.12e-073.74e-010.1753
57222ERGIC1GSM4909292HumanBreastIDC6.36e-056.16e-010.1236
57222ERGIC1GSM4909293HumanBreastIDC4.06e-376.27e-010.1581
57222ERGIC1GSM4909297HumanBreastIDC7.59e-034.13e-020.1517
57222ERGIC1GSM4909298HumanBreastIDC1.06e-326.43e-010.1551
57222ERGIC1GSM4909304HumanBreastIDC4.29e-072.72e-010.1636
57222ERGIC1GSM4909308HumanBreastIDC4.45e-113.52e-010.158
57222ERGIC1GSM4909311HumanBreastIDC1.13e-102.18e-020.1534
57222ERGIC1GSM4909312HumanBreastIDC5.41e-052.13e-010.1552
57222ERGIC1GSM4909317HumanBreastIDC4.67e-083.30e-010.1355
57222ERGIC1GSM4909319HumanBreastIDC3.26e-15-2.93e-020.1563
57222ERGIC1GSM4909321HumanBreastIDC4.99e-051.84e-010.1559
57222ERGIC1M1HumanBreastIDC7.65e-114.43e-010.1577
57222ERGIC1NCCBC14HumanBreastDCIS4.88e-031.18e-010.2021
57222ERGIC1P1HumanBreastIDC1.09e-031.47e-010.1527
57222ERGIC1DCIS2HumanBreastDCIS7.46e-391.22e-010.0085
57222ERGIC1HTA11_2487_2000001011HumanColorectumSER8.65e-147.93e-01-0.1808
57222ERGIC1HTA11_1938_2000001011HumanColorectumAD7.57e-126.99e-01-0.0811
57222ERGIC1HTA11_78_2000001011HumanColorectumAD2.51e-211.07e+00-0.1088
Page: 1 2 3 4 5 6 7 8 9 10 

check button Transcriptomic changes along malignancy continuum.
TissueExpression DynamicsAbbreviation
BreastThe image shows the transcriptomic changes along malignancy continuum.log2FC in expression of this searched gene in stem-like cells from each diseased tissue sample relative to stem-like cells in normal samples in each tissue plotted against the malignancy continuum. Samples are colored based on if they are from different disease stage.IDC: Invasive ductal carcinoma
DCIS: Ductal carcinoma in situ
Precancer(BRCA1-mut): Precancerous lesion from BRCA1 mutation carriers
Colorectum (GSE201348)The image shows the transcriptomic changes along malignancy continuum.log2FC in expression of this searched gene in stem-like cells from each diseased tissue sample relative to stem-like cells in normal samples in each tissue plotted against the malignancy continuum. Samples are colored based on if they are from different disease stage.FAP: Familial adenomatous polyposis
CRC: Colorectal cancer
Colorectum (HTA11)The image shows the transcriptomic changes along malignancy continuum.log2FC in expression of this searched gene in stem-like cells from each diseased tissue sample relative to stem-like cells in normal samples in each tissue plotted against the malignancy continuum. Samples are colored based on if they are from different disease stage.AD: Adenomas
SER: Sessile serrated lesions
MSI-H: Microsatellite-high colorectal cancer
MSS: Microsatellite stable colorectal cancer
EsophagusThe image shows the transcriptomic changes along malignancy continuum.log2FC in expression of this searched gene in stem-like cells from each diseased tissue sample relative to stem-like cells in normal samples in each tissue plotted against the malignancy continuum. Samples are colored based on if they are from different disease stage.
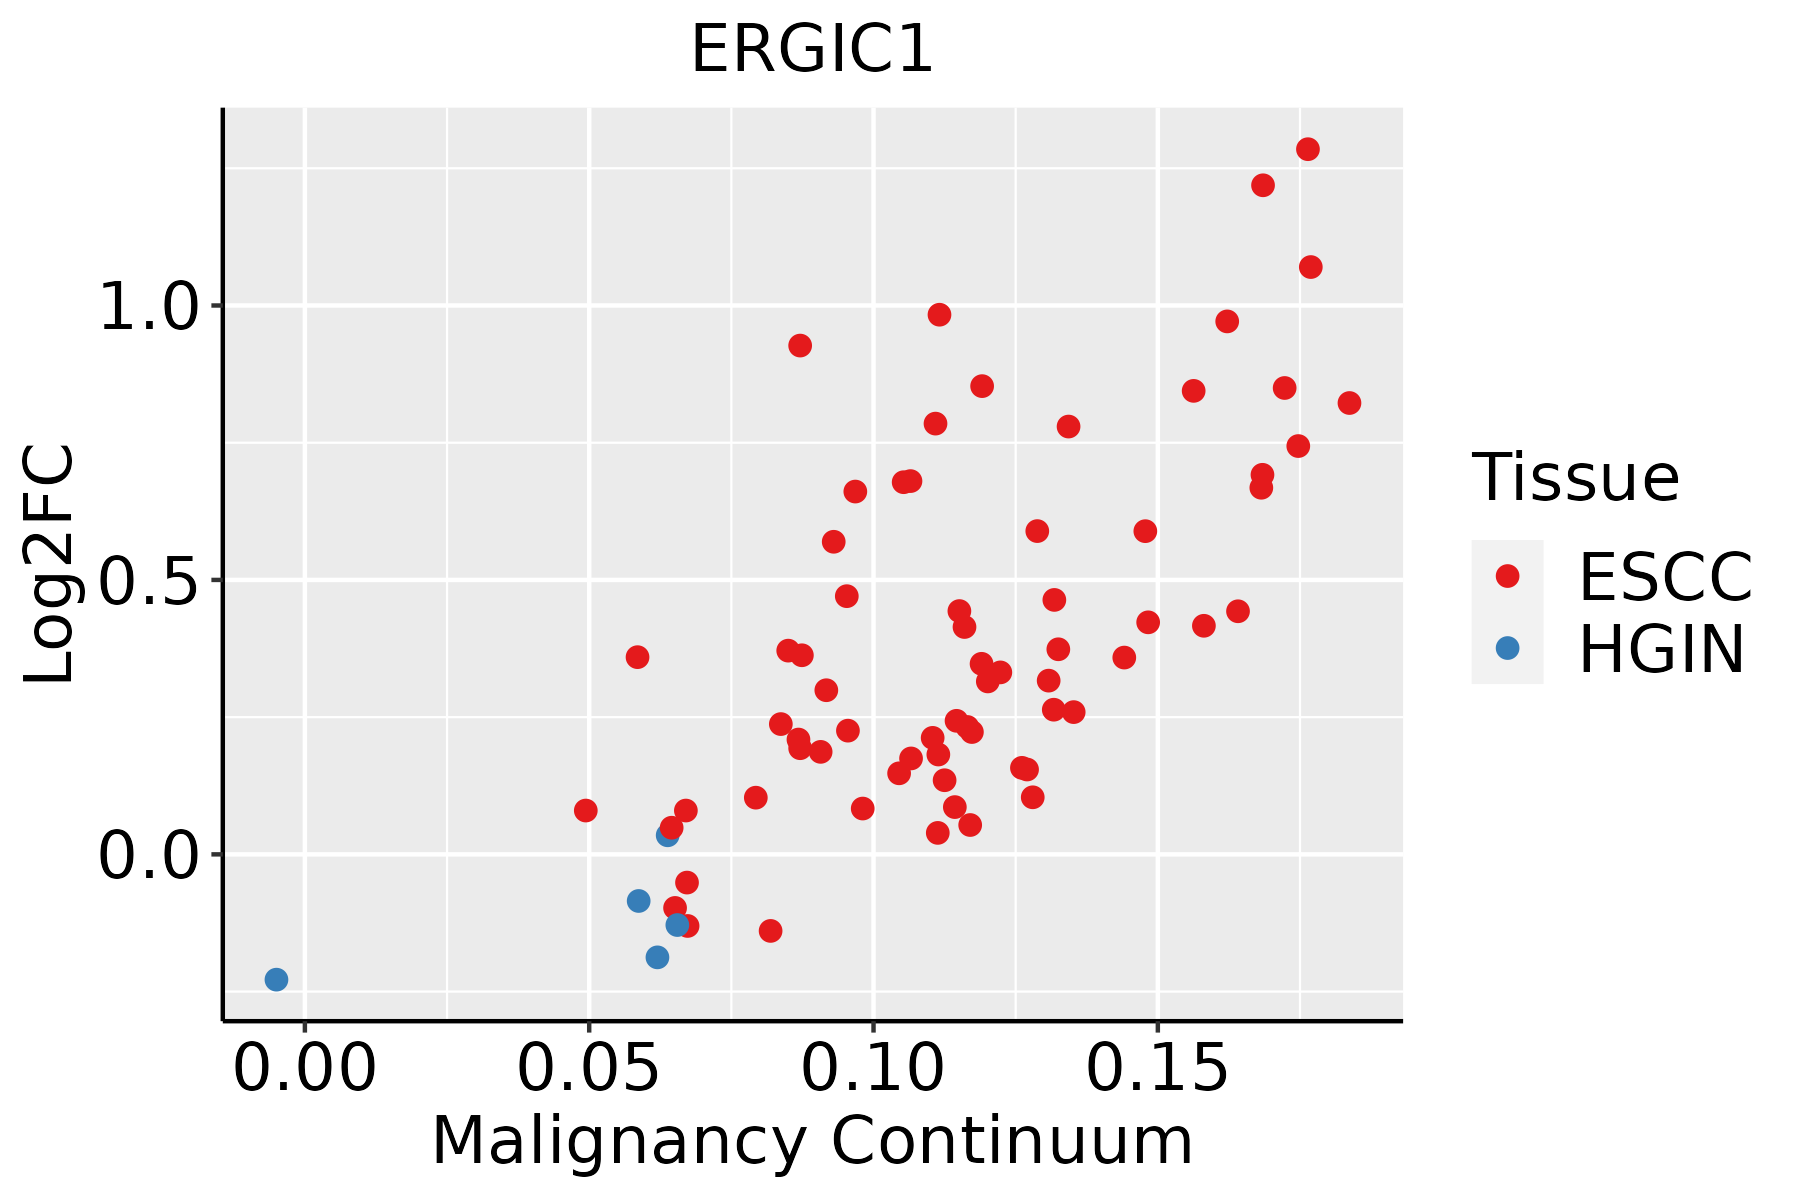
ESCC: Esophageal squamous cell carcinoma
HGIN: High-grade intraepithelial neoplasias
LGIN: Low-grade intraepithelial neoplasias
LiverThe image shows the transcriptomic changes along malignancy continuum.log2FC in expression of this searched gene in stem-like cells from each diseased tissue sample relative to stem-like cells in normal samples in each tissue plotted against the malignancy continuum. Samples are colored based on if they are from different disease stage.
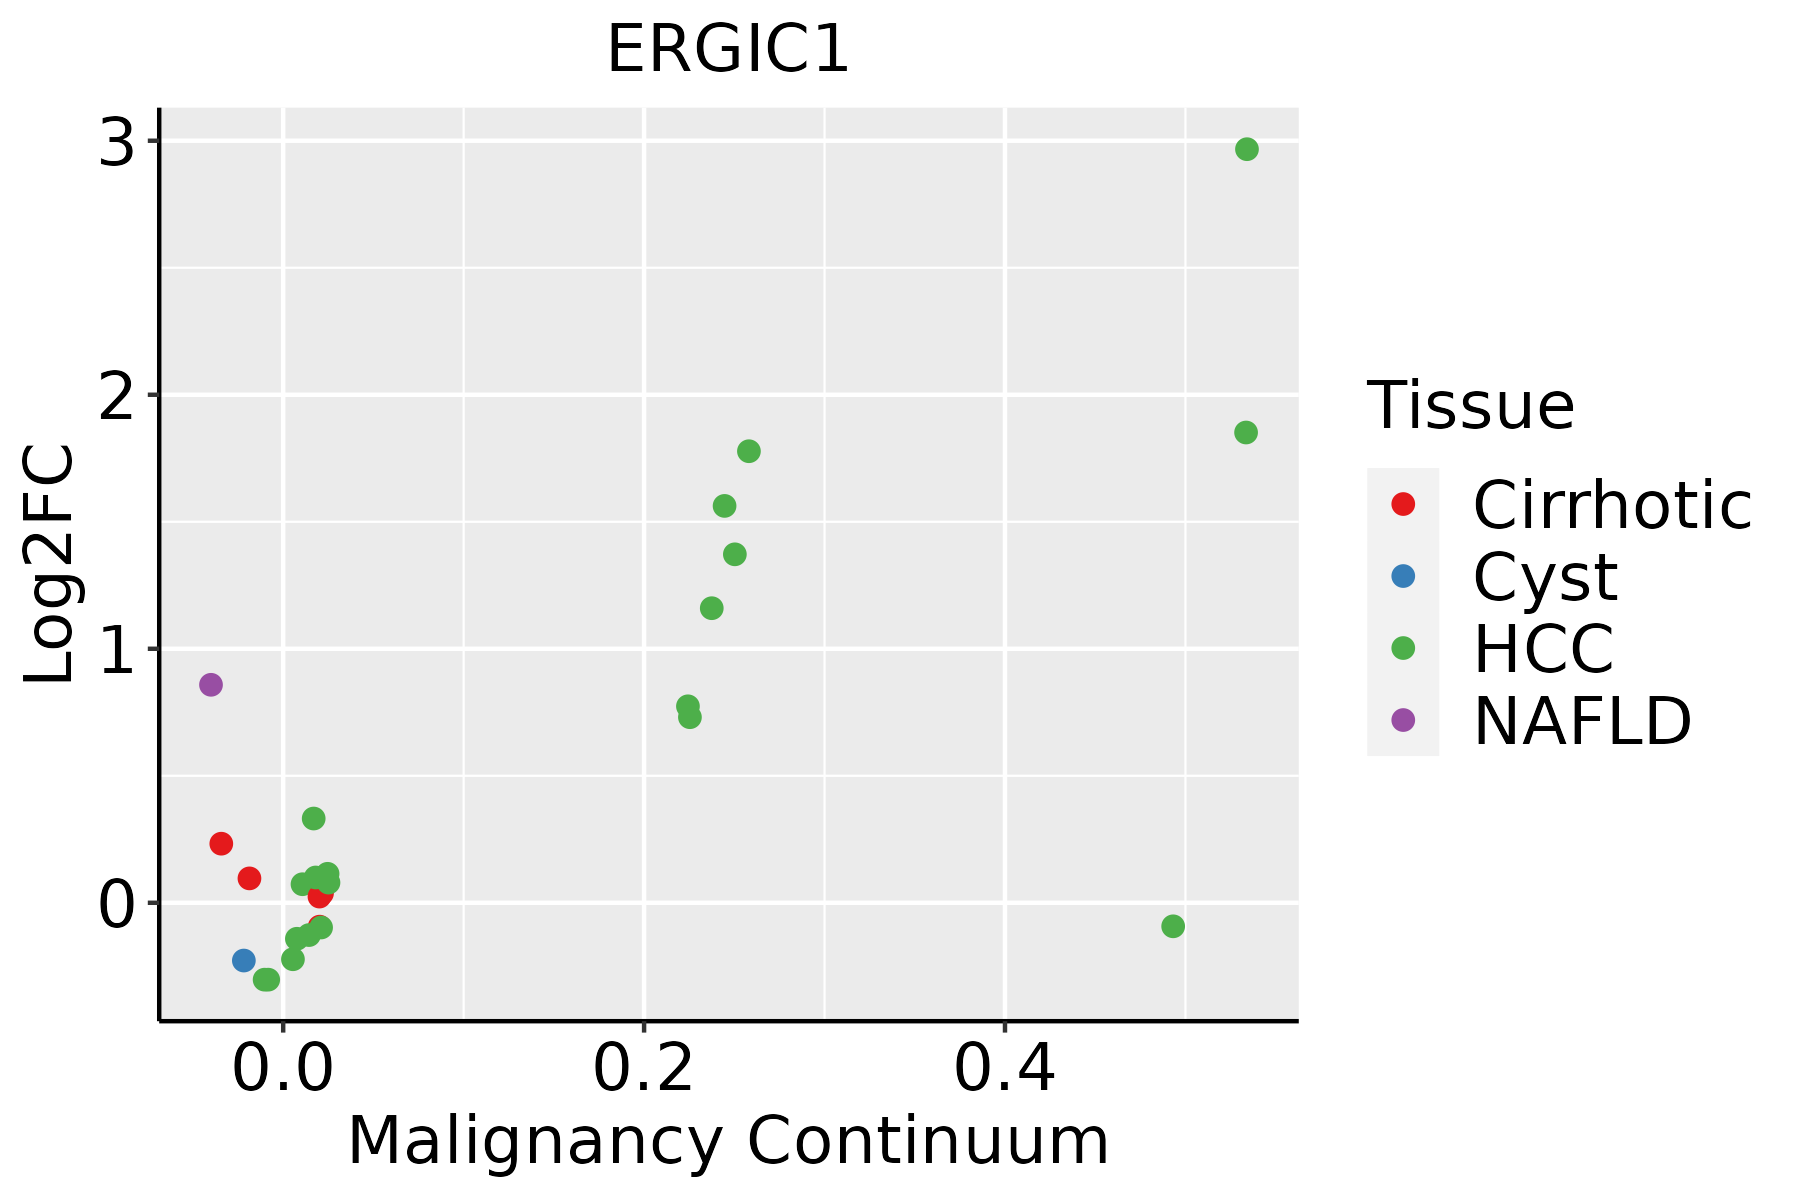
HCC: Hepatocellular carcinoma
NAFLD: Non-alcoholic fatty liver disease
Oral CavityThe image shows the transcriptomic changes along malignancy continuum.log2FC in expression of this searched gene in stem-like cells from each diseased tissue sample relative to stem-like cells in normal samples in each tissue plotted against the malignancy continuum. Samples are colored based on if they are from different disease stage.
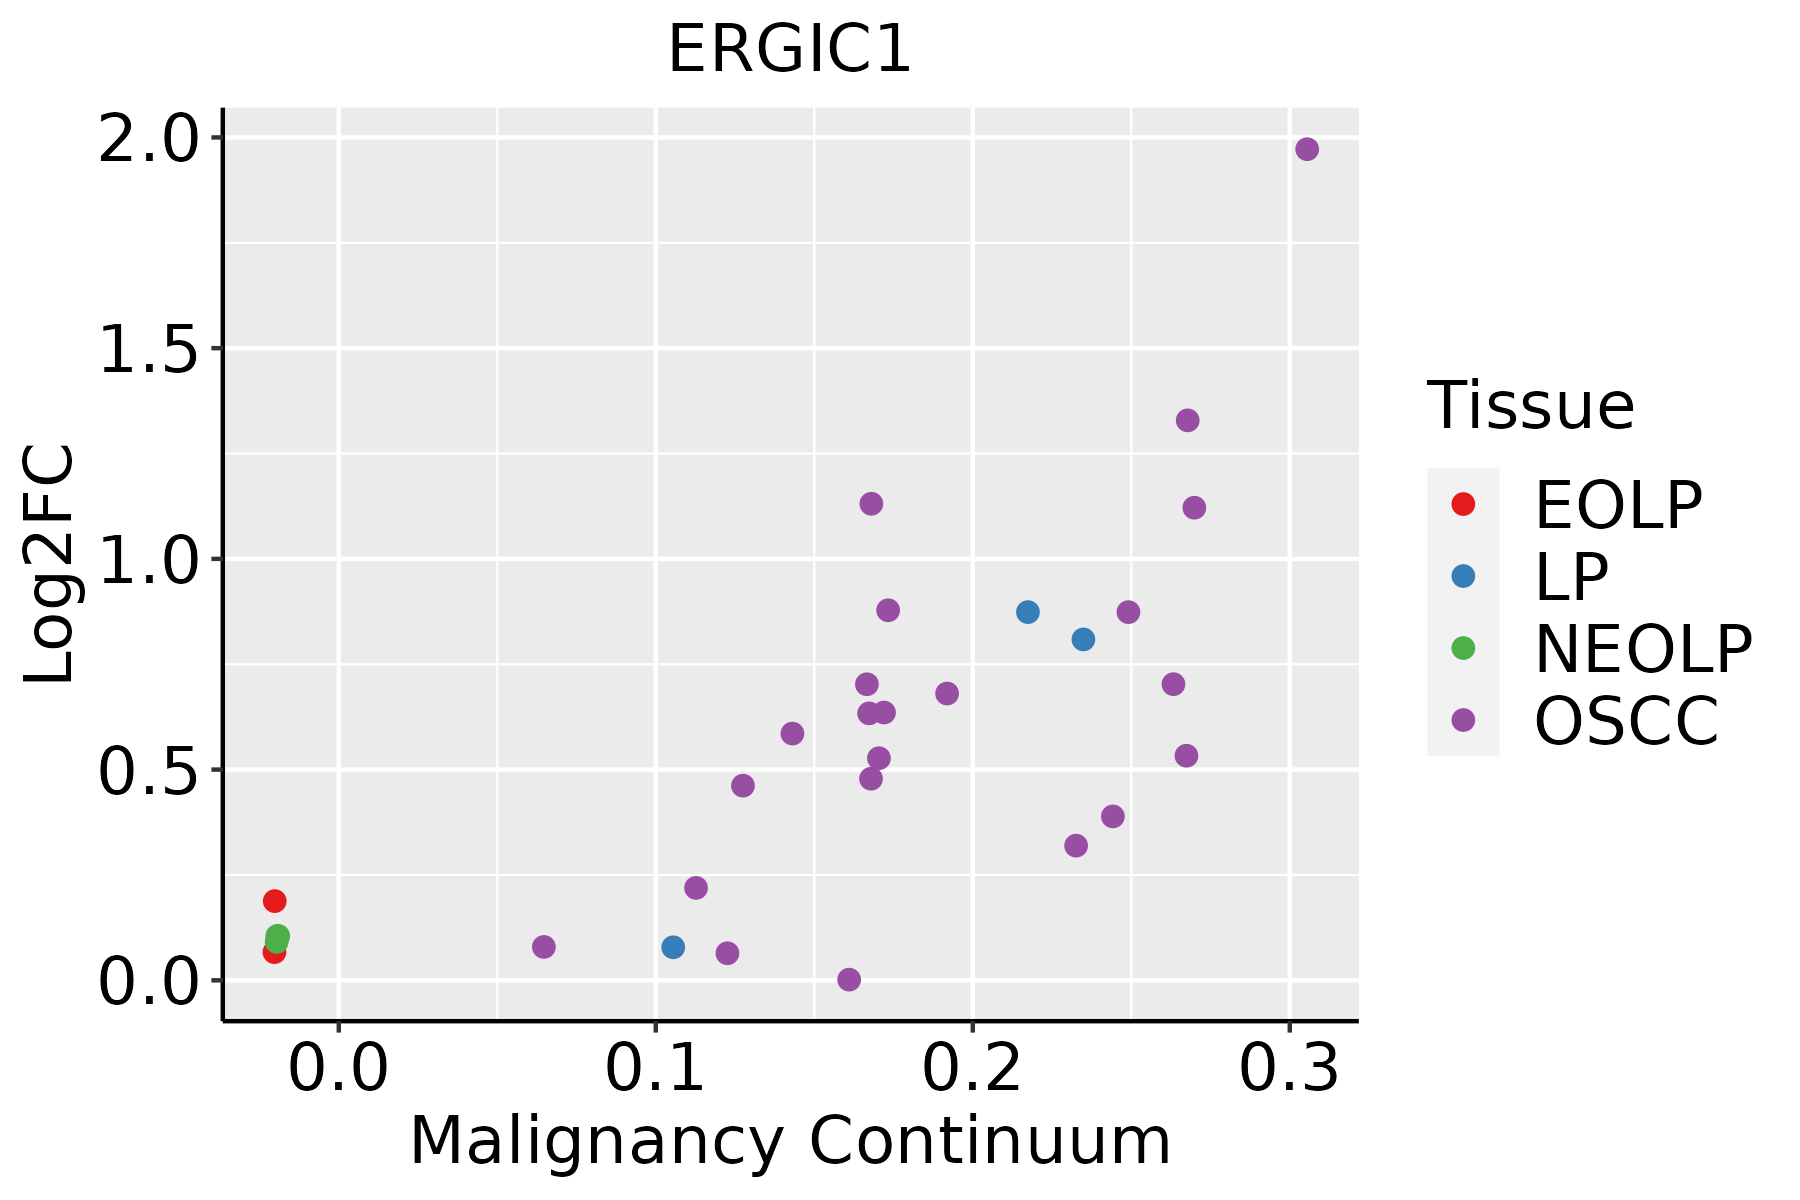
EOLP: Erosive Oral lichen planus
LP: leukoplakia
NEOLP: Non-erosive oral lichen planus
OSCC: Oral squamous cell carcinoma
ProstateThe image shows the transcriptomic changes along malignancy continuum.log2FC in expression of this searched gene in stem-like cells from each diseased tissue sample relative to stem-like cells in normal samples in each tissue plotted against the malignancy continuum. Samples are colored based on if they are from different disease stage.
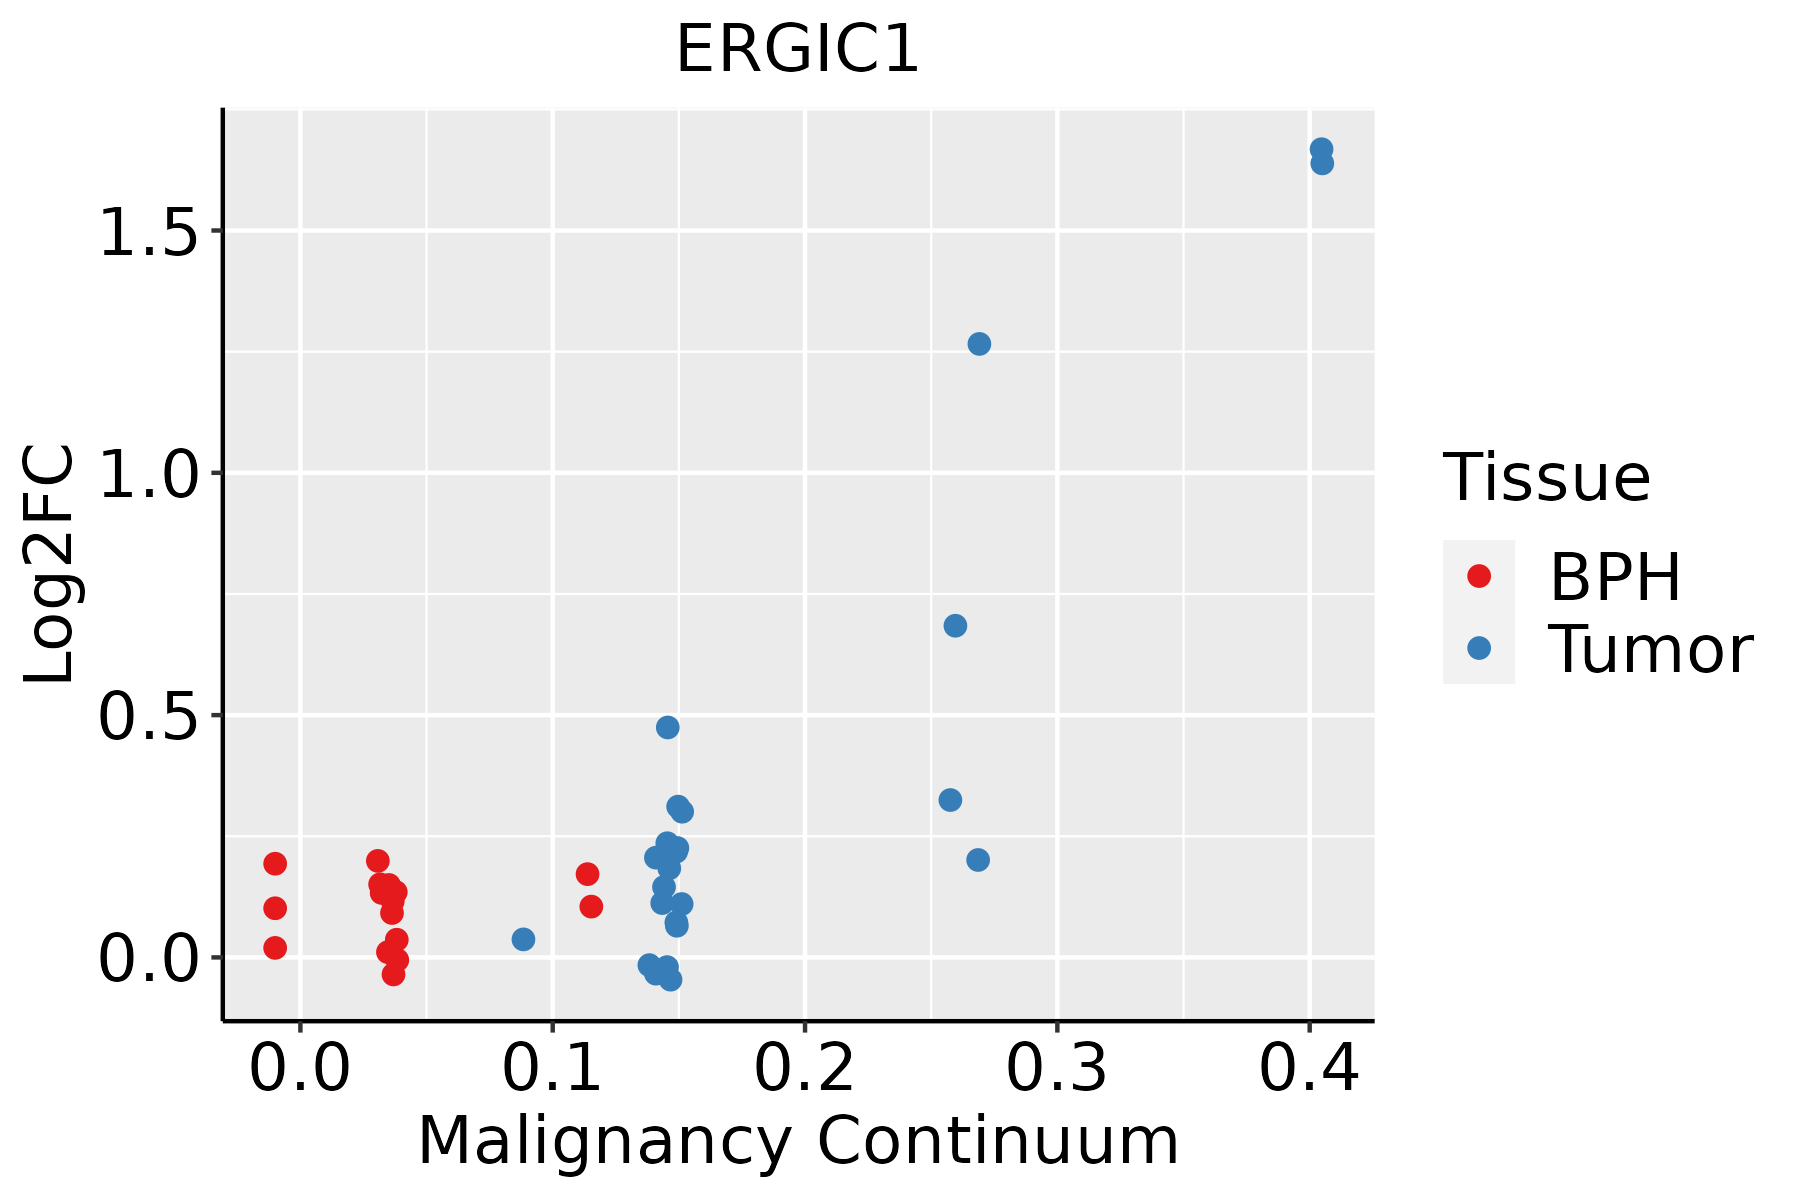
BPH: Benign Prostatic Hyperplasia
ThyroidThe image shows the transcriptomic changes along malignancy continuum.log2FC in expression of this searched gene in stem-like cells from each diseased tissue sample relative to stem-like cells in normal samples in each tissue plotted against the malignancy continuum. Samples are colored based on if they are from different disease stage.
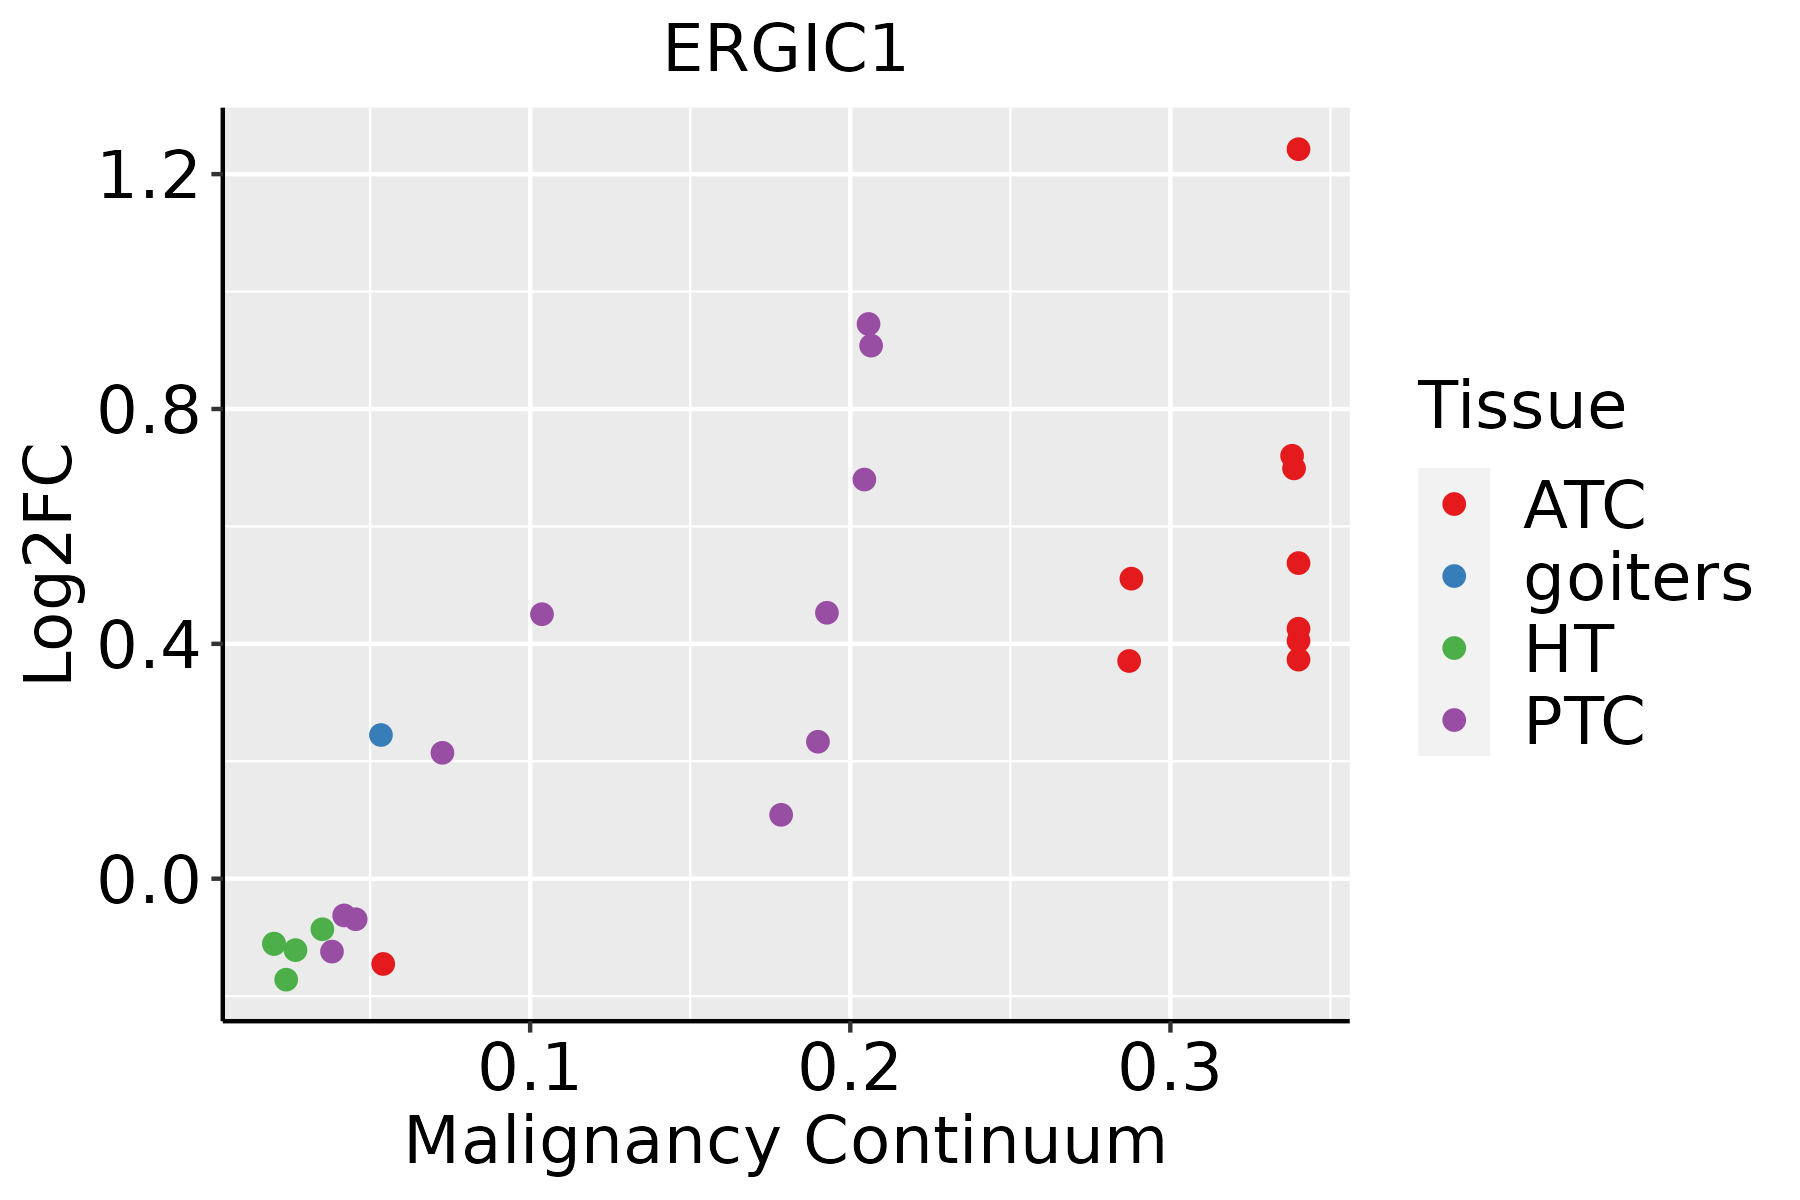
ATC: Anaplastic thyroid cancer
HT: Hashimoto's thyroiditis
PTC: Papillary thyroid cancer
∗log2FC in expression of this searched gene in stem-like cells from each diseased tissue sample relative to stem-like cells in normal samples in each tissue plotted against the malignancy continuum. Samples are colored based on if they are from different disease stage.

Top

Malignant transformation related pathway analysis

check buttonFind out the enriched GO biological processes and KEGG pathways involved in transition from healthy to precancer to cancer
check button Figure of enriched GO biological processes.
TissueDisease StageEnriched GO biological Processes
ColorectumADGO analysis - Figure of enriched GO biological processes: Top 15 enriched GO BP terms are showed in the bar plot of each disease state in each tissue. Each row represents a significant GO biological process which is colored according to the -log10(p.adjust).
ColorectumSERGO analysis - Figure of enriched GO biological processes: Top 15 enriched GO BP terms are showed in the bar plot of each disease state in each tissue. Each row represents a significant GO biological process which is colored according to the -log10(p.adjust).
ColorectumMSSGO analysis - Figure of enriched GO biological processes: Top 15 enriched GO BP terms are showed in the bar plot of each disease state in each tissue. Each row represents a significant GO biological process which is colored according to the -log10(p.adjust).
ColorectumMSI-HGO analysis - Figure of enriched GO biological processes: Top 15 enriched GO BP terms are showed in the bar plot of each disease state in each tissue. Each row represents a significant GO biological process which is colored according to the -log10(p.adjust).
ColorectumFAPGO analysis - Figure of enriched GO biological processes: Top 15 enriched GO BP terms are showed in the bar plot of each disease state in each tissue. Each row represents a significant GO biological process which is colored according to the -log10(p.adjust).
∗Top 15 enriched GO BP terms are showed in the bar plot of each disease state in each tissue. Each row represents a significant GO biological process which is colored according to the -log10(p.adjust).
Page: 1 2 3 4 5 6 7 8 9 

check button Enriched GO biological processes.
GO IDTissueDisease StageDescriptionGene RatioBg Ratiopvaluep.adjustCount
GO:00068906BreastIDCretrograde vesicle-mediated transport, Golgi to endoplasmic reticulum10/143452/187235.49e-034.03e-0210
GO:000689012BreastDCISretrograde vesicle-mediated transport, Golgi to endoplasmic reticulum10/139052/187234.41e-033.41e-0210
GO:0048193ColorectumADGolgi vesicle transport109/3918296/187231.80e-101.68e-08109
GO:0006890ColorectumADretrograde vesicle-mediated transport, Golgi to endoplasmic reticulum27/391852/187237.67e-072.70e-0527
GO:0006888ColorectumADendoplasmic reticulum to Golgi vesicle-mediated transport44/3918130/187234.13e-044.68e-0344
GO:00481931ColorectumSERGolgi vesicle transport79/2897296/187234.20e-072.15e-0579
GO:00068901ColorectumSERretrograde vesicle-mediated transport, Golgi to endoplasmic reticulum20/289752/187234.80e-051.18e-0320
GO:00068881ColorectumSERendoplasmic reticulum to Golgi vesicle-mediated transport34/2897130/187231.13e-031.29e-0234
GO:00481932ColorectumMSSGolgi vesicle transport101/3467296/187239.09e-119.77e-09101
GO:00068902ColorectumMSSretrograde vesicle-mediated transport, Golgi to endoplasmic reticulum26/346752/187232.66e-071.10e-0526
GO:00068882ColorectumMSSendoplasmic reticulum to Golgi vesicle-mediated transport44/3467130/187232.17e-054.60e-0444
GO:00068903ColorectumMSI-Hretrograde vesicle-mediated transport, Golgi to endoplasmic reticulum13/131952/187234.72e-051.69e-0313
GO:00068883ColorectumMSI-Hendoplasmic reticulum to Golgi vesicle-mediated transport22/1319130/187231.05e-043.24e-0322
GO:00481933ColorectumMSI-HGolgi vesicle transport39/1319296/187231.17e-043.51e-0339
GO:00481934ColorectumFAPGolgi vesicle transport77/2622296/187232.86e-082.62e-0677
GO:00068904ColorectumFAPretrograde vesicle-mediated transport, Golgi to endoplasmic reticulum18/262252/187231.48e-042.29e-0318
GO:00068884ColorectumFAPendoplasmic reticulum to Golgi vesicle-mediated transport30/2622130/187233.51e-032.53e-0230
GO:00481935ColorectumCRCGolgi vesicle transport59/2078296/187235.47e-062.17e-0459
GO:004819318EsophagusESCCGolgi vesicle transport231/8552296/187231.82e-309.63e-28231
GO:000688815EsophagusESCCendoplasmic reticulum to Golgi vesicle-mediated transport102/8552130/187231.73e-149.22e-13102
Page: 1 2 3 

check button Enriched KEGG pathways.
Pathway IDTissueDisease StageDescriptionGene RatioBg Ratiopvaluep.adjustqvalueCount
Page: 1 

Top

Cell-cell communication analysis

check buttonIdentification of potential cell-cell interactions between two cell types and their ligand-receptor pairs for different disease states
LigandReceptorLRpairPathwayTissueDisease Stage
Page: 1 

Top

Single-cell gene regulatory network inference analysis

check buttonFind out the significant the regulons (TFs) and the target genes of each regulon across cell types for different disease states
TFCell TypeTissueDisease StageTarget GeneRSSRegulon Activity
∗The dot plots of a searched regulon are shown for all cell subpopulations in each disease state of each tissue based on the regulon specific score inferred using pySCENIC and by calculating the average expression.
Page: 1 

Top

Somatic mutation of malignant transformation related genes

check buttonAnnotation of somatic variants for genes involved in malignant transformation
Hugo SymbolVariant ClassVariant ClassificationdbSNP RSHGVScHGVSpHGVSp ShortSWISSPROTBIOTYPESIFTPolyPhenTumor Sample BarcodeTissueHistologySexAgeStageTherapy TypesDrugsOutcome
ERGIC1SNVMissense_Mutationnovelc.854A>Tp.Gln285Leup.Q285LQ969X5protein_codingdeleterious(0.03)benign(0.138)TCGA-BH-A0B1-01Breastbreast invasive carcinomaFemale>=65I/IIChemotherapyadriamycinSD
ERGIC1SNVMissense_Mutationnovelc.605N>Tp.Lys202Metp.K202MQ969X5protein_codingdeleterious(0.03)possibly_damaging(0.575)TCGA-BH-A0EE-01Breastbreast invasive carcinomaFemale>=65I/IIChemotherapydocetaxelSD
ERGIC1insertionFrame_Shift_Insnovelc.649_650insAGGGAGGGAGGGGCp.Val217GlufsTer125p.V217Efs*125Q969X5protein_codingTCGA-A2-A0EU-01Breastbreast invasive carcinomaFemale>=65I/IIUnknownUnknownSD
ERGIC1insertionFrame_Shift_Insnovelc.855_856insGGGCTGCTAATGTCCTCTGGGGCCACACAACTGTTTATTTCTTp.Leu286GlyfsTer26p.L286Gfs*26Q969X5protein_codingTCGA-BH-A0B1-01Breastbreast invasive carcinomaFemale>=65I/IIChemotherapyadriamycinSD
ERGIC1insertionFrame_Shift_Insnovelc.604_605insCTp.Lys202ThrfsTer136p.K202Tfs*136Q969X5protein_codingTCGA-BH-A0EE-01Breastbreast invasive carcinomaFemale>=65I/IIChemotherapydocetaxelSD
ERGIC1insertionFrame_Shift_Insnovelc.839_840insTCTGTCCTTTGTAGCACTTGCCTTGGp.Trp281LeufsTer65p.W281Lfs*65Q969X5protein_codingTCGA-BH-A0HB-01Breastbreast invasive carcinomaFemale<65I/IIChemotherapydocetaxelSD
ERGIC1SNVMissense_Mutationc.577N>Tp.Pro193Serp.P193SQ969X5protein_codingdeleterious(0.01)probably_damaging(1)TCGA-FU-A3HZ-01Cervixcervical & endocervical cancerFemale<65I/IIChemotherapycisplatinCR
ERGIC1SNVMissense_Mutationnovelc.320N>Cp.Ile107Thrp.I107TQ969X5protein_codingtolerated(0.42)benign(0.005)TCGA-EI-6507-01Colorectumrectum adenocarcinomaMale<65I/IIUnknownUnknownSD
ERGIC1SNVMissense_Mutationnovelc.433N>Tp.Asp145Tyrp.D145YQ969X5protein_codingdeleterious(0)probably_damaging(0.995)TCGA-A5-A0G2-01Endometriumuterine corpus endometrioid carcinomaFemale<65III/IVUnknownUnknownSD
ERGIC1SNVMissense_Mutationrs376307473c.695N>Ap.Arg232Hisp.R232HQ969X5protein_codingdeleterious(0.05)probably_damaging(0.988)TCGA-AJ-A3NE-01Endometriumuterine corpus endometrioid carcinomaFemale<65I/IIUnknownUnknownSD
Page: 1 2 3 4 

Top

Related drugs of malignant transformation related genes

check buttonIdentification of chemicals and drugs interact with genes involved in malignant transfromation
(DGIdb 4.0)
Entrez IDSymbolCategoryInteraction TypesDrug Claim NameDrug NamePMIDs
Page: 1