| GO ID | Tissue | Disease Stage | Description | Gene Ratio | Bg Ratio | pvalue | p.adjust | Count |
| GO:00068906 | Breast | IDC | retrograde vesicle-mediated transport, Golgi to endoplasmic reticulum | 10/1434 | 52/18723 | 5.49e-03 | 4.03e-02 | 10 |
| GO:000689012 | Breast | DCIS | retrograde vesicle-mediated transport, Golgi to endoplasmic reticulum | 10/1390 | 52/18723 | 4.41e-03 | 3.41e-02 | 10 |
| GO:000838010 | Cervix | CC | RNA splicing | 76/2311 | 434/18723 | 9.79e-04 | 8.19e-03 | 76 |
| GO:00063684 | Cervix | CC | transcription elongation from RNA polymerase II promoter | 17/2311 | 69/18723 | 3.65e-03 | 2.33e-02 | 17 |
| GO:00063545 | Cervix | CC | DNA-templated transcription, elongation | 20/2311 | 91/18723 | 6.88e-03 | 3.74e-02 | 20 |
| GO:0008380 | Colorectum | AD | RNA splicing | 169/3918 | 434/18723 | 3.59e-18 | 2.04e-15 | 169 |
| GO:0048193 | Colorectum | AD | Golgi vesicle transport | 109/3918 | 296/18723 | 1.80e-10 | 1.68e-08 | 109 |
| GO:0006890 | Colorectum | AD | retrograde vesicle-mediated transport, Golgi to endoplasmic reticulum | 27/3918 | 52/18723 | 7.67e-07 | 2.70e-05 | 27 |
| GO:0006888 | Colorectum | AD | endoplasmic reticulum to Golgi vesicle-mediated transport | 44/3918 | 130/18723 | 4.13e-04 | 4.68e-03 | 44 |
| GO:0032786 | Colorectum | AD | positive regulation of DNA-templated transcription, elongation | 13/3918 | 27/18723 | 1.47e-03 | 1.25e-02 | 13 |
| GO:0006354 | Colorectum | AD | DNA-templated transcription, elongation | 31/3918 | 91/18723 | 2.46e-03 | 1.90e-02 | 31 |
| GO:0006368 | Colorectum | AD | transcription elongation from RNA polymerase II promoter | 24/3918 | 69/18723 | 5.35e-03 | 3.52e-02 | 24 |
| GO:0008202 | Colorectum | AD | steroid metabolic process | 85/3918 | 319/18723 | 8.07e-03 | 4.75e-02 | 85 |
| GO:00083801 | Colorectum | SER | RNA splicing | 123/2897 | 434/18723 | 3.84e-12 | 8.41e-10 | 123 |
| GO:00481931 | Colorectum | SER | Golgi vesicle transport | 79/2897 | 296/18723 | 4.20e-07 | 2.15e-05 | 79 |
| GO:00068901 | Colorectum | SER | retrograde vesicle-mediated transport, Golgi to endoplasmic reticulum | 20/2897 | 52/18723 | 4.80e-05 | 1.18e-03 | 20 |
| GO:00068881 | Colorectum | SER | endoplasmic reticulum to Golgi vesicle-mediated transport | 34/2897 | 130/18723 | 1.13e-03 | 1.29e-02 | 34 |
| GO:00083802 | Colorectum | MSS | RNA splicing | 159/3467 | 434/18723 | 1.75e-19 | 1.22e-16 | 159 |
| GO:00481932 | Colorectum | MSS | Golgi vesicle transport | 101/3467 | 296/18723 | 9.09e-11 | 9.77e-09 | 101 |
| GO:00068902 | Colorectum | MSS | retrograde vesicle-mediated transport, Golgi to endoplasmic reticulum | 26/3467 | 52/18723 | 2.66e-07 | 1.10e-05 | 26 |
| TF | Cell Type | Tissue | Disease Stage | Target Gene | RSS | Regulon Activity |
| ERG | MYOEPI | Breast | ADJ | AL590617.2,ITGA2,DST, etc. | 6.58e-01 |  |
| ERG | MYOEPI | Breast | Healthy | ITGB1,LIMA1,NRP2, etc. | 4.72e-01 |  |
| ERG | MYOEPI | Breast | Precancer | AL590617.2,ITGA2,DST, etc. | 6.16e-01 |  |
| ERG | STM | Cervix | Healthy | CYSLTR1,TPST2,DOP1B, etc. | 3.44e-01 |  |
| ERG | SPI | Oral cavity | NEOLP | PROX1,ST6GALNAC3,STOX2, etc. | 1.83e-01 |  |
| ERG | MAST | Pancreas | ADJ | KCNG2,EPB41L1,KIT, etc. | 1.87e-01 |  |
| ERG | MAST | Pancreas | Healthy | KCNG2,EPB41L1,KIT, etc. | 2.65e-01 |  |
| ERG | MAST | Pancreas | PanIN | KCNG2,EPB41L1,KIT, etc. | 4.60e-01 |  |
| ERG | MAST | Pancreas | PDAC | KCNG2,EPB41L1,KIT, etc. | 3.19e-01 |  |
| ERG | NKT | Pancreas | PDAC | KCNG2,EPB41L1,KIT, etc. | 9.03e-02 |  |
| Hugo Symbol | Variant Class | Variant Classification | dbSNP RS | HGVSc | HGVSp | HGVSp Short | SWISSPROT | BIOTYPE | SIFT | PolyPhen | Tumor Sample Barcode | Tissue | Histology | Sex | Age | Stage | Therapy Types | Drugs | Outcome |
| ERG | SNV | Missense_Mutation | | c.465N>T | p.Lys155Asn | p.K155N | P11308 | protein_coding | deleterious(0.04) | probably_damaging(0.966) | TCGA-A1-A0SO-01 | Breast | breast invasive carcinoma | Female | >=65 | I/II | Chemotherapy | | SD |
| ERG | SNV | Missense_Mutation | novel | c.976N>A | p.Glu326Lys | p.E326K | P11308 | protein_coding | deleterious(0) | probably_damaging(0.999) | TCGA-A2-A04Q-01 | Breast | breast invasive carcinoma | Female | <65 | I/II | Chemotherapy | adriamycin | SD |
| ERG | SNV | Missense_Mutation | | c.1267C>A | p.Pro423Thr | p.P423T | P11308 | protein_coding | tolerated(0.32) | benign(0.003) | TCGA-A2-A1FX-01 | Breast | breast invasive carcinoma | Female | <65 | III/IV | Chemotherapy | taxotere | SD |
| ERG | SNV | Missense_Mutation | novel | c.29N>T | p.Ala10Val | p.A10V | P11308 | protein_coding | tolerated_low_confidence(0.4) | benign(0) | TCGA-AN-A046-01 | Breast | breast invasive carcinoma | Female | >=65 | I/II | Unknown | Unknown | SD |
| ERG | SNV | Missense_Mutation | | c.120N>A | p.Met40Ile | p.M40I | P11308 | protein_coding | deleterious(0.05) | benign(0.358) | TCGA-E2-A159-01 | Breast | breast invasive carcinoma | Female | <65 | I/II | Chemotherapy | cyclophosphamide | SD |
| ERG | SNV | Missense_Mutation | | c.401T>A | p.Val134Glu | p.V134E | P11308 | protein_coding | deleterious(0) | probably_damaging(0.987) | TCGA-GM-A2DF-01 | Breast | breast invasive carcinoma | Female | <65 | I/II | Chemotherapy | taxol | CR |
| ERG | insertion | Frame_Shift_Ins | novel | c.1309_1310insCA | p.Phe437SerfsTer12 | p.F437Sfs*12 | P11308 | protein_coding | | | TCGA-AN-A046-01 | Breast | breast invasive carcinoma | Female | >=65 | I/II | Unknown | Unknown | SD |
| ERG | insertion | Nonsense_Mutation | novel | c.1307_1308insACAATCTGGAGATGTTACAAGTTTATGACTCATGA | p.Asn436LysfsTer10 | p.N436Kfs*10 | P11308 | protein_coding | | | TCGA-AN-A046-01 | Breast | breast invasive carcinoma | Female | >=65 | I/II | Unknown | Unknown | SD |
| ERG | SNV | Missense_Mutation | | c.1123N>A | p.Ala375Thr | p.A375T | P11308 | protein_coding | deleterious(0) | probably_damaging(1) | TCGA-EA-A410-01 | Cervix | cervical & endocervical cancer | Female | <65 | I/II | Unknown | Unknown | SD |
| ERG | SNV | Missense_Mutation | | c.749G>T | p.Arg250Ile | p.R250I | P11308 | protein_coding | deleterious(0.02) | possibly_damaging(0.866) | TCGA-FU-A3HZ-01 | Cervix | cervical & endocervical cancer | Female | <65 | I/II | Chemotherapy | cisplatin | CR |
| Entrez ID | Symbol | Category | Interaction Types | Drug Claim Name | Drug Name | PMIDs |
| 2078 | ERG | DRUGGABLE GENOME, CLINICALLY ACTIONABLE | | MMV009085 | CHEMBL581225 | |
| 2078 | ERG | DRUGGABLE GENOME, CLINICALLY ACTIONABLE | | MEDROXYPROGESTERONE ACETATE | MEDROXYPROGESTERONE ACETATE | |
| 2078 | ERG | DRUGGABLE GENOME, CLINICALLY ACTIONABLE | blocker | CHEMBL473 | DOFETILIDE | |
| 2078 | ERG | DRUGGABLE GENOME, CLINICALLY ACTIONABLE | | HOMIDIUM BROMIDE | HOMIDIUM BROMIDE | |
| 2078 | ERG | DRUGGABLE GENOME, CLINICALLY ACTIONABLE | blocker | CHEMBL1700 | SOTALOL HYDROCHLORIDE | |
| 2078 | ERG | DRUGGABLE GENOME, CLINICALLY ACTIONABLE | blocker | CHEMBL3545169 | AZD1305 | |
| 2078 | ERG | DRUGGABLE GENOME, CLINICALLY ACTIONABLE | | GNF-PF-1947 | CHEMBL585591 | |
| 2078 | ERG | DRUGGABLE GENOME, CLINICALLY ACTIONABLE | blocker | CHEMBL2107762 | NERISPIRDINE | |
| 2078 | ERG | DRUGGABLE GENOME, CLINICALLY ACTIONABLE | | ACRIDIN-1-YLAMINE | CHEMBL146525 | |
| 2078 | ERG | DRUGGABLE GENOME, CLINICALLY ACTIONABLE | | IDARUBICIN HYDROCHLORIDE | IDARUBICIN HYDROCHLORIDE | |


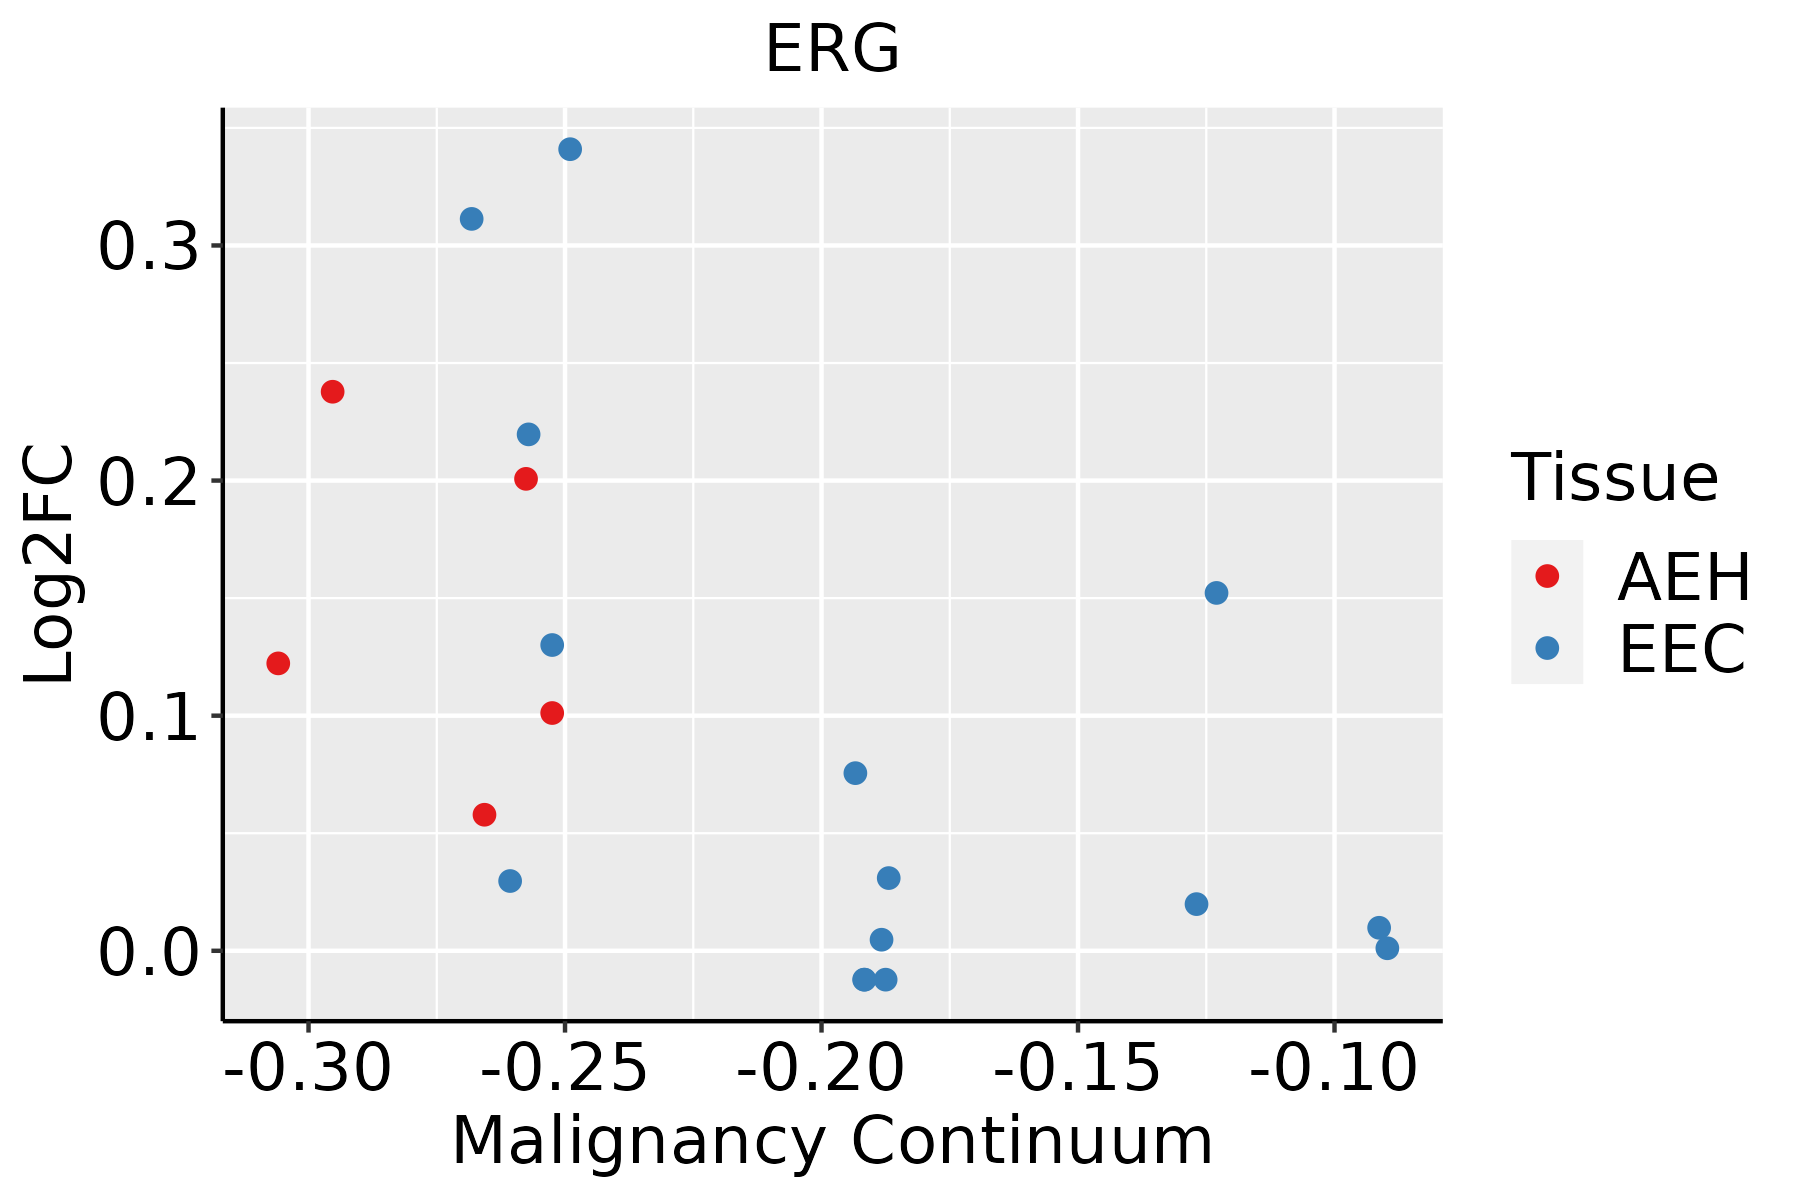
 Identification of the aberrant gene expression in precancerous and cancerous lesions by comparing the gene expression of stem-like cells in diseased tissues with normal stem cells
 Find out the enriched GO biological processes and KEGG pathways involved in transition from healthy to precancer to cancer


 Identification of potential cell-cell interactions between two cell types and their ligand-receptor pairs for different disease states
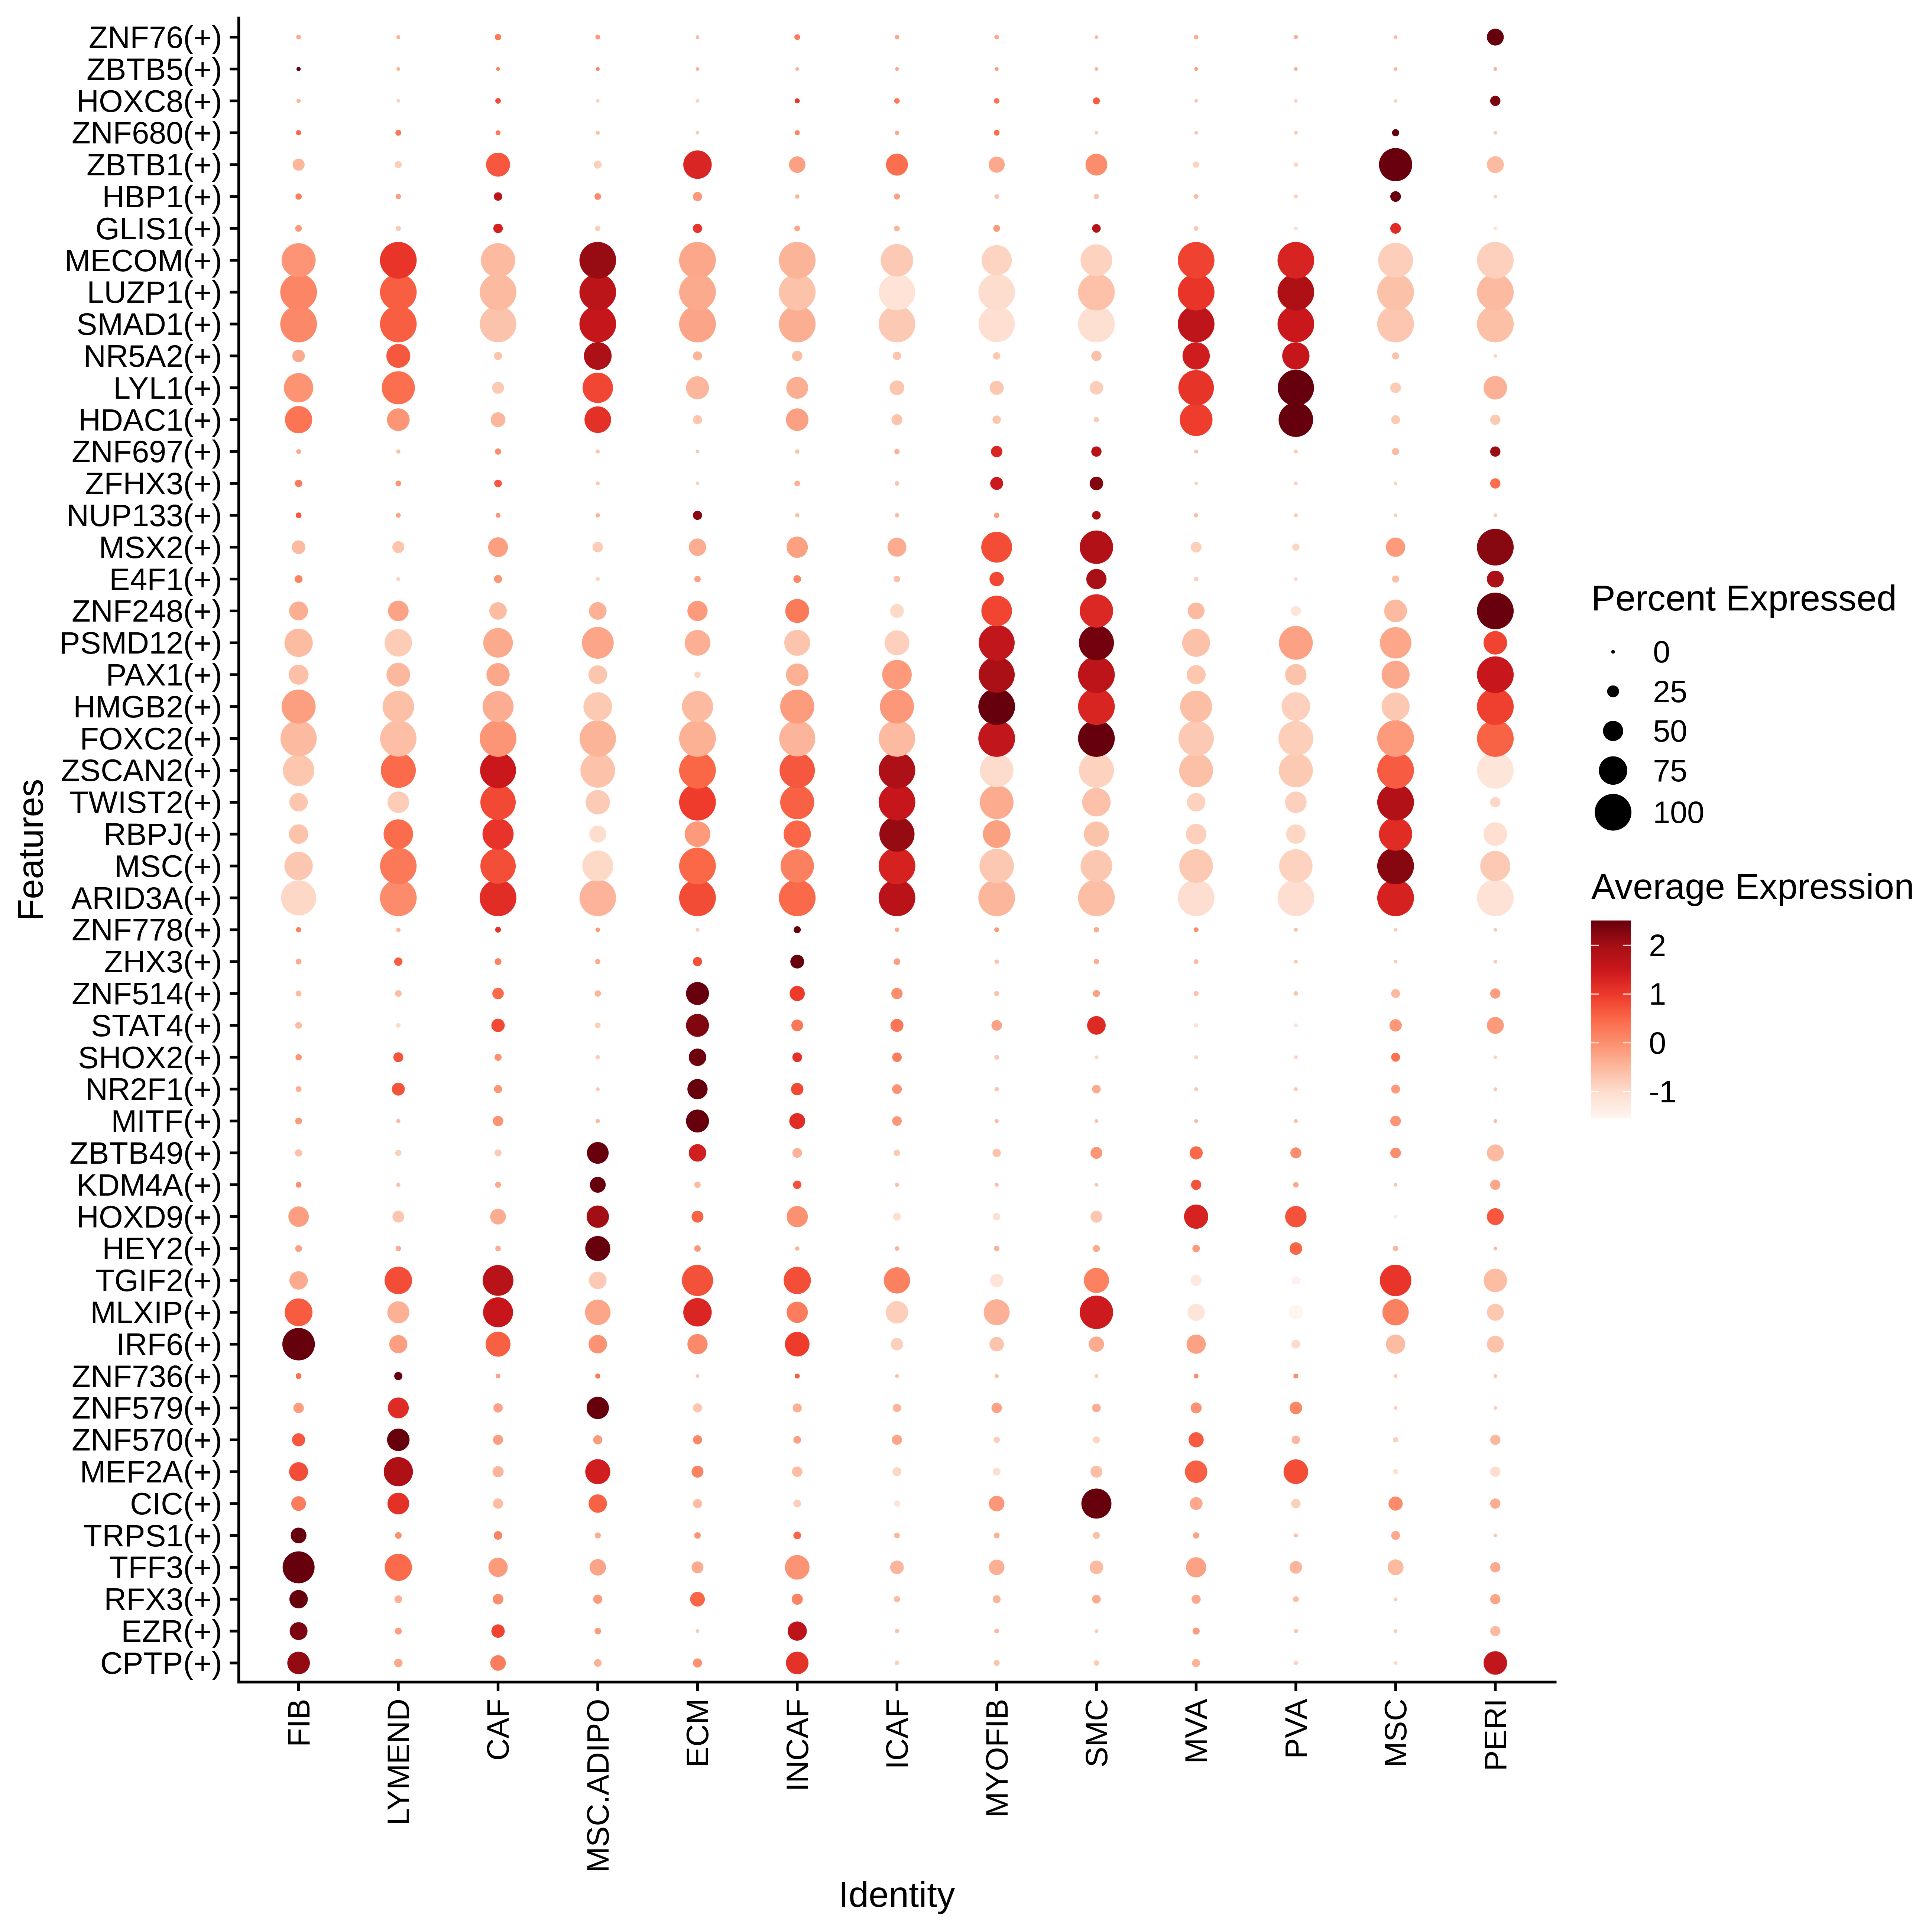
 Find out the significant the regulons (TFs) and the target genes of each regulon across cell types for different disease states
 Annotation of somatic variants for genes involved in malignant transformation
 Identification of chemicals and drugs interact with genes involved in malignant transfromation


