
|
|||||
|
 | |
| |
| |
| |
| |
| |
|
Gene: ERCC5 |
Gene summary for ERCC5 |
| Gene information | Species | Human | Gene symbol | ERCC5 | Gene ID | 2073 |
| Gene name | ERCC excision repair 5, endonuclease | |
| Gene Alias | COFS3 | |
| Cytomap | 13q33.1 | |
| Gene Type | protein-coding | GO ID | GO:0000724 | UniProtAcc | P28715 |
Top |
Malignant transformation analysis |
| Identification of the aberrant gene expression in precancerous and cancerous lesions by comparing the gene expression of stem-like cells in diseased tissues with normal stem cells |
| Entrez ID | Symbol | Replicates | Species | Organ | Tissue | Adj P-value | Log2FC | Malignancy |
| 2073 | ERCC5 | HTA11_3410_2000001011 | Human | Colorectum | AD | 7.98e-03 | 1.08e-01 | 0.0155 |
| 2073 | ERCC5 | HTA11_2487_2000001011 | Human | Colorectum | SER | 7.90e-11 | 2.91e-01 | -0.1808 |
| 2073 | ERCC5 | HTA11_1938_2000001011 | Human | Colorectum | AD | 1.83e-13 | 4.89e-01 | -0.0811 |
| 2073 | ERCC5 | HTA11_78_2000001011 | Human | Colorectum | AD | 2.07e-15 | 3.79e-01 | -0.1088 |
| 2073 | ERCC5 | HTA11_347_2000001011 | Human | Colorectum | AD | 1.17e-33 | 5.82e-01 | -0.1954 |
| 2073 | ERCC5 | HTA11_2112_2000001011 | Human | Colorectum | SER | 1.71e-03 | 2.44e-01 | -0.2196 |
| 2073 | ERCC5 | HTA11_83_2000001011 | Human | Colorectum | SER | 2.92e-07 | 2.45e-01 | -0.1526 |
| 2073 | ERCC5 | HTA11_696_2000001011 | Human | Colorectum | AD | 1.58e-13 | 2.62e-01 | -0.1464 |
| 2073 | ERCC5 | HTA11_866_2000001011 | Human | Colorectum | AD | 4.08e-11 | 2.59e-01 | -0.1001 |
| 2073 | ERCC5 | HTA11_1391_2000001011 | Human | Colorectum | AD | 6.14e-20 | 4.68e-01 | -0.059 |
| 2073 | ERCC5 | HTA11_5212_2000001011 | Human | Colorectum | AD | 5.12e-05 | 2.80e-01 | -0.2061 |
| 2073 | ERCC5 | HTA11_546_2000001011 | Human | Colorectum | AD | 2.76e-07 | 3.04e-01 | -0.0842 |
| 2073 | ERCC5 | HTA11_7862_2000001011 | Human | Colorectum | AD | 5.15e-10 | 3.88e-01 | -0.0179 |
| 2073 | ERCC5 | HTA11_866_3004761011 | Human | Colorectum | AD | 3.51e-07 | 1.89e-01 | 0.096 |
| 2073 | ERCC5 | HTA11_8622_2000001021 | Human | Colorectum | SER | 1.13e-05 | 2.87e-01 | 0.0528 |
| 2073 | ERCC5 | HTA11_7663_2000001011 | Human | Colorectum | SER | 7.76e-07 | 3.34e-01 | 0.0131 |
| 2073 | ERCC5 | HTA11_10623_2000001011 | Human | Colorectum | AD | 2.44e-10 | 3.87e-01 | -0.0177 |
| 2073 | ERCC5 | HTA11_6801_2000001011 | Human | Colorectum | SER | 1.64e-05 | 3.29e-01 | 0.0171 |
| 2073 | ERCC5 | HTA11_10711_2000001011 | Human | Colorectum | AD | 1.67e-03 | 1.54e-01 | 0.0338 |
| 2073 | ERCC5 | HTA11_7696_3000711011 | Human | Colorectum | AD | 8.94e-11 | 2.41e-01 | 0.0674 |
| Page: 1 2 3 4 5 |
| Tissue | Expression Dynamics | Abbreviation |
| Colorectum (GSE201348) |  | FAP: Familial adenomatous polyposis |
| CRC: Colorectal cancer | ||
| Colorectum (HTA11) | 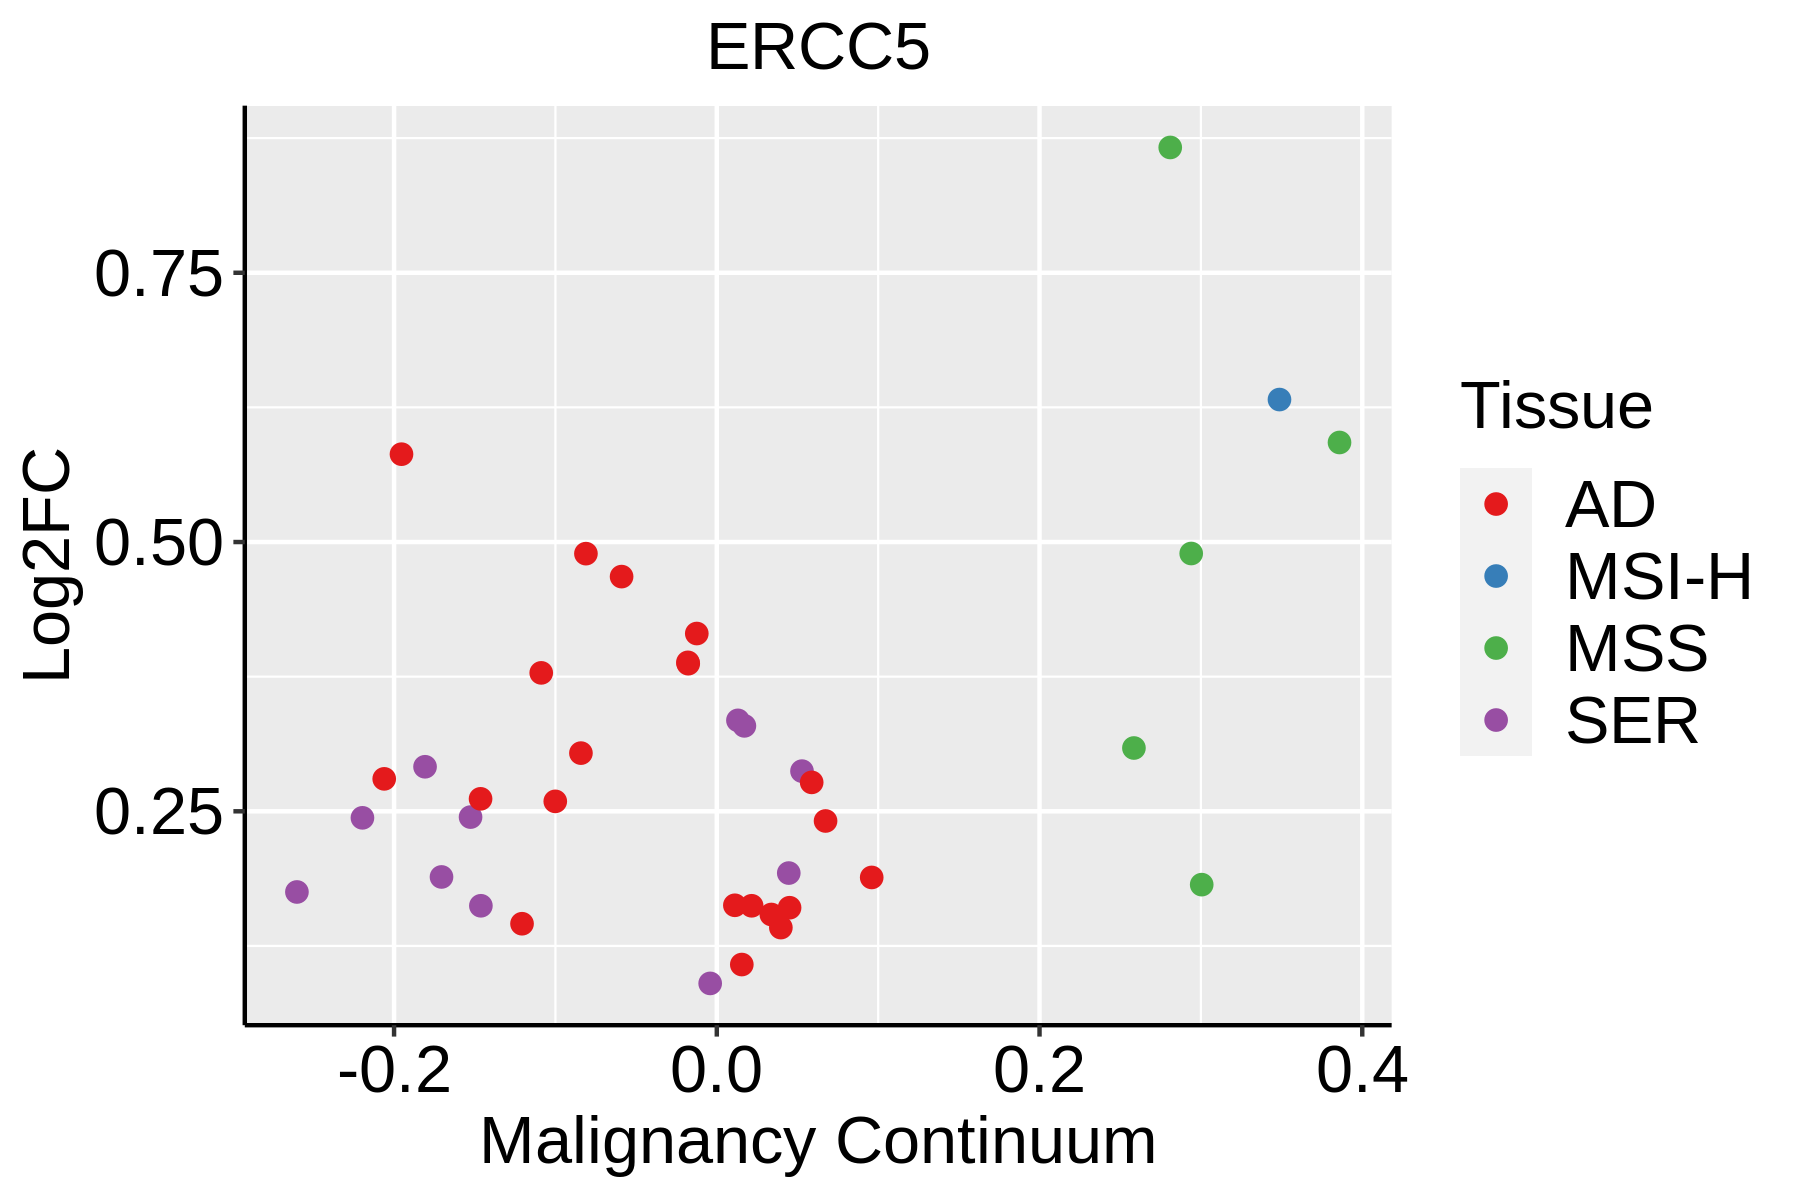 | AD: Adenomas |
| SER: Sessile serrated lesions | ||
| MSI-H: Microsatellite-high colorectal cancer | ||
| MSS: Microsatellite stable colorectal cancer | ||
| Esophagus |  | ESCC: Esophageal squamous cell carcinoma |
| HGIN: High-grade intraepithelial neoplasias | ||
| LGIN: Low-grade intraepithelial neoplasias |
| ∗log2FC in expression of this searched gene in stem-like cells from each diseased tissue sample relative to stem-like cells in normal samples in each tissue plotted against the malignancy continuum. Samples are colored based on if they are from different disease stage. |
Top |
Malignant transformation related pathway analysis |
| Find out the enriched GO biological processes and KEGG pathways involved in transition from healthy to precancer to cancer |
| Tissue | Disease Stage | Enriched GO biological Processes |
| Colorectum | AD |  |
| Colorectum | SER |  |
| Colorectum | MSS |  |
| Colorectum | MSI-H |  |
| Colorectum | FAP |  |
| ∗Top 15 enriched GO BP terms are showed in the bar plot of each disease state in each tissue. Each row represents a significant GO biological process which is colored according to the -log10(p.adjust). |
| Page: 1 2 3 4 5 6 7 8 9 |
| GO ID | Tissue | Disease Stage | Description | Gene Ratio | Bg Ratio | pvalue | p.adjust | Count |
| GO:0006302 | Colorectum | MSS | double-strand break repair | 64/3467 | 251/18723 | 3.58e-03 | 2.65e-02 | 64 |
| GO:000931418 | Esophagus | HGIN | response to radiation | 88/2587 | 456/18723 | 6.26e-04 | 8.65e-03 | 88 |
| GO:00094115 | Esophagus | HGIN | response to UV | 35/2587 | 149/18723 | 9.71e-04 | 1.22e-02 | 35 |
| GO:0006285 | Esophagus | HGIN | base-excision repair, AP site formation | 6/2587 | 12/18723 | 3.03e-03 | 2.88e-02 | 6 |
| GO:00094165 | Esophagus | HGIN | response to light stimulus | 61/2587 | 320/18723 | 5.20e-03 | 4.30e-02 | 61 |
| GO:00062892 | Esophagus | HGIN | nucleotide-excision repair | 16/2587 | 60/18723 | 6.22e-03 | 4.95e-02 | 16 |
| GO:000941113 | Esophagus | ESCC | response to UV | 115/8552 | 149/18723 | 3.29e-15 | 1.93e-13 | 115 |
| GO:000931419 | Esophagus | ESCC | response to radiation | 277/8552 | 456/18723 | 4.42e-11 | 1.43e-09 | 277 |
| GO:00903053 | Esophagus | ESCC | nucleic acid phosphodiester bond hydrolysis | 163/8552 | 261/18723 | 3.07e-08 | 5.73e-07 | 163 |
| GO:00063024 | Esophagus | ESCC | double-strand break repair | 152/8552 | 251/18723 | 1.33e-06 | 1.62e-05 | 152 |
| GO:000941611 | Esophagus | ESCC | response to light stimulus | 183/8552 | 320/18723 | 2.03e-05 | 1.76e-04 | 183 |
| GO:00062843 | Esophagus | ESCC | base-excision repair | 33/8552 | 43/18723 | 3.25e-05 | 2.69e-04 | 33 |
| GO:00062891 | Esophagus | ESCC | nucleotide-excision repair | 42/8552 | 60/18723 | 1.18e-04 | 8.14e-04 | 42 |
| GO:00063101 | Esophagus | ESCC | DNA recombination | 168/8552 | 305/18723 | 5.58e-04 | 3.05e-03 | 168 |
| GO:0009650 | Esophagus | ESCC | UV protection | 12/8552 | 13/18723 | 6.18e-04 | 3.32e-03 | 12 |
| GO:00007241 | Esophagus | ESCC | double-strand break repair via homologous recombination | 79/8552 | 138/18723 | 4.05e-03 | 1.62e-02 | 79 |
| GO:00007251 | Esophagus | ESCC | recombinational repair | 80/8552 | 140/18723 | 4.10e-03 | 1.63e-02 | 80 |
| Page: 1 |
| Pathway ID | Tissue | Disease Stage | Description | Gene Ratio | Bg Ratio | pvalue | p.adjust | qvalue | Count |
| hsa034205 | Esophagus | HGIN | Nucleotide excision repair | 29/1383 | 63/8465 | 2.96e-08 | 5.36e-07 | 4.26e-07 | 29 |
| hsa0342012 | Esophagus | HGIN | Nucleotide excision repair | 29/1383 | 63/8465 | 2.96e-08 | 5.36e-07 | 4.26e-07 | 29 |
| hsa0342022 | Esophagus | ESCC | Nucleotide excision repair | 54/4205 | 63/8465 | 2.01e-09 | 2.17e-08 | 1.11e-08 | 54 |
| hsa0342032 | Esophagus | ESCC | Nucleotide excision repair | 54/4205 | 63/8465 | 2.01e-09 | 2.17e-08 | 1.11e-08 | 54 |
| Page: 1 |
Top |
Cell-cell communication analysis |
| Identification of potential cell-cell interactions between two cell types and their ligand-receptor pairs for different disease states |
| Ligand | Receptor | LRpair | Pathway | Tissue | Disease Stage |
| Page: 1 |
Top |
Single-cell gene regulatory network inference analysis |
| Find out the significant the regulons (TFs) and the target genes of each regulon across cell types for different disease states |
| TF | Cell Type | Tissue | Disease Stage | Target Gene | RSS | Regulon Activity |
| ∗The dot plots of a searched regulon are shown for all cell subpopulations in each disease state of each tissue based on the regulon specific score inferred using pySCENIC and by calculating the average expression. |
| Page: 1 |
Top |
Somatic mutation of malignant transformation related genes |
| Annotation of somatic variants for genes involved in malignant transformation |
| Hugo Symbol | Variant Class | Variant Classification | dbSNP RS | HGVSc | HGVSp | HGVSp Short | SWISSPROT | BIOTYPE | SIFT | PolyPhen | Tumor Sample Barcode | Tissue | Histology | Sex | Age | Stage | Therapy Types | Drugs | Outcome |
| ERCC5 | SNV | Missense_Mutation | novel | c.3227N>T | p.Ser1076Leu | p.S1076L | P28715 | protein_coding | tolerated(0.13) | possibly_damaging(0.524) | TCGA-3C-AALI-01 | Breast | breast invasive carcinoma | Female | <65 | I/II | Unspecific | Poly E | Complete Response |
| ERCC5 | SNV | Missense_Mutation | rs4150315 | c.1195N>A | p.Glu399Lys | p.E399K | P28715 | protein_coding | tolerated(0.07) | benign(0.267) | TCGA-A2-A0YD-01 | Breast | breast invasive carcinoma | Female | <65 | I/II | Chemotherapy | cytoxan | SD |
| ERCC5 | SNV | Missense_Mutation | rs775996769 | c.1537G>A | p.Ala513Thr | p.A513T | P28715 | protein_coding | tolerated(0.17) | benign(0.001) | TCGA-AN-A0AK-01 | Breast | breast invasive carcinoma | Female | >=65 | I/II | Unknown | Unknown | SD |
| ERCC5 | SNV | Missense_Mutation | c.1301N>C | p.Val434Ala | p.V434A | P28715 | protein_coding | tolerated(0.12) | benign(0) | TCGA-AO-A03T-01 | Breast | breast invasive carcinoma | Female | <65 | I/II | Chemotherapy | cyclophosphamide | SD | |
| ERCC5 | SNV | Missense_Mutation | novel | c.347N>C | p.Arg116Thr | p.R116T | P28715 | protein_coding | deleterious(0) | probably_damaging(0.998) | TCGA-AR-A256-01 | Breast | breast invasive carcinoma | Female | <65 | I/II | Chemotherapy | doxorubicin | PD |
| ERCC5 | SNV | Missense_Mutation | novel | c.674N>T | p.Glu225Val | p.E225V | P28715 | protein_coding | deleterious(0) | benign(0.397) | TCGA-B6-A0I9-01 | Breast | breast invasive carcinoma | Female | <65 | III/IV | Unknown | Unknown | PD |
| ERCC5 | SNV | Missense_Mutation | c.424N>C | p.Asp142His | p.D142H | P28715 | protein_coding | deleterious(0) | probably_damaging(0.996) | TCGA-B6-A0RE-01 | Breast | breast invasive carcinoma | Female | <65 | I/II | Unknown | Unknown | SD | |
| ERCC5 | SNV | Missense_Mutation | rs771389207 | c.180T>G | p.His60Gln | p.H60Q | P28715 | protein_coding | deleterious(0) | probably_damaging(0.953) | TCGA-BH-A0HX-01 | Breast | breast invasive carcinoma | Female | <65 | I/II | Chemotherapy | adrimycin | SD |
| ERCC5 | SNV | Missense_Mutation | rs570775554 | c.1595N>T | p.Ser532Phe | p.S532F | P28715 | protein_coding | tolerated(0.17) | benign(0.007) | TCGA-BH-A18G-01 | Breast | breast invasive carcinoma | Female | >=65 | I/II | Unknown | Unknown | SD |
| ERCC5 | SNV | Missense_Mutation | c.1985G>T | p.Ser662Ile | p.S662I | P28715 | protein_coding | deleterious(0) | probably_damaging(0.963) | TCGA-E2-A150-01 | Breast | breast invasive carcinoma | Female | <65 | I/II | Chemotherapy | doxorubicin | SD |
| Page: 1 2 3 4 5 6 7 8 9 10 11 12 13 14 15 16 17 |
Top |
Related drugs of malignant transformation related genes |
| Identification of chemicals and drugs interact with genes involved in malignant transfromation |
| (DGIdb 4.0) |
| Entrez ID | Symbol | Category | Interaction Types | Drug Claim Name | Drug Name | PMIDs |
| 2073 | ERCC5 | DRUGGABLE GENOME, CLINICALLY ACTIONABLE | platinum | PLATINUM | 22158331 |
| Page: 1 |

Copyright 2023-Present -The University of Texas Health Science Center at Houston |