
|
|||||
|
 | |
| |
| |
| |
| |
| |
|
Gene: ERC1 |
Gene summary for ERC1 |
| Gene information | Species | Human | Gene symbol | ERC1 | Gene ID | 23085 |
| Gene name | ELKS/RAB6-interacting/CAST family member 1 | |
| Gene Alias | Cast2 | |
| Cytomap | 12p13.33 | |
| Gene Type | protein-coding | GO ID | GO:0006139 | UniProtAcc | G8JLD3 |
Top |
Malignant transformation analysis |
| Identification of the aberrant gene expression in precancerous and cancerous lesions by comparing the gene expression of stem-like cells in diseased tissues with normal stem cells |
| Entrez ID | Symbol | Replicates | Species | Organ | Tissue | Adj P-value | Log2FC | Malignancy |
| 23085 | ERC1 | CCI_1 | Human | Cervix | CC | 3.20e-17 | 1.36e+00 | 0.528 |
| 23085 | ERC1 | CCI_2 | Human | Cervix | CC | 1.93e-17 | 1.53e+00 | 0.5249 |
| 23085 | ERC1 | CCI_3 | Human | Cervix | CC | 5.13e-41 | 2.35e+00 | 0.516 |
| 23085 | ERC1 | HTA11_3410_2000001011 | Human | Colorectum | AD | 6.78e-20 | -5.49e-01 | 0.0155 |
| 23085 | ERC1 | HTA11_3361_2000001011 | Human | Colorectum | AD | 4.23e-02 | -4.18e-01 | -0.1207 |
| 23085 | ERC1 | HTA11_5216_2000001011 | Human | Colorectum | SER | 4.67e-02 | -6.68e-01 | -0.1462 |
| 23085 | ERC1 | HTA11_7862_2000001011 | Human | Colorectum | AD | 2.07e-05 | -6.69e-01 | -0.0179 |
| 23085 | ERC1 | HTA11_8622_2000001021 | Human | Colorectum | SER | 8.72e-04 | -5.82e-01 | 0.0528 |
| 23085 | ERC1 | HTA11_99999970781_79442 | Human | Colorectum | MSS | 2.07e-11 | -5.03e-01 | 0.294 |
| 23085 | ERC1 | HTA11_99999974143_84620 | Human | Colorectum | MSS | 3.65e-08 | -4.10e-01 | 0.3005 |
| 23085 | ERC1 | A015-C-203 | Human | Colorectum | FAP | 1.11e-33 | -4.19e-01 | -0.1294 |
| 23085 | ERC1 | A015-C-204 | Human | Colorectum | FAP | 3.38e-07 | -3.34e-01 | -0.0228 |
| 23085 | ERC1 | A014-C-040 | Human | Colorectum | FAP | 3.18e-05 | -3.55e-01 | -0.1184 |
| 23085 | ERC1 | A002-C-201 | Human | Colorectum | FAP | 1.08e-14 | -3.53e-01 | 0.0324 |
| 23085 | ERC1 | A002-C-203 | Human | Colorectum | FAP | 3.09e-04 | -1.36e-01 | 0.2786 |
| 23085 | ERC1 | A001-C-119 | Human | Colorectum | FAP | 5.67e-04 | -1.66e-01 | -0.1557 |
| 23085 | ERC1 | A001-C-108 | Human | Colorectum | FAP | 1.71e-15 | -2.37e-01 | -0.0272 |
| 23085 | ERC1 | A002-C-205 | Human | Colorectum | FAP | 5.29e-24 | -2.30e-01 | -0.1236 |
| 23085 | ERC1 | A015-C-006 | Human | Colorectum | FAP | 9.68e-18 | -2.26e-01 | -0.0994 |
| 23085 | ERC1 | A015-C-106 | Human | Colorectum | FAP | 7.22e-09 | -1.44e-01 | -0.0511 |
| Page: 1 2 3 4 5 6 7 8 9 10 11 |
| Tissue | Expression Dynamics | Abbreviation |
| Cervix |  | CC: Cervix cancer |
| HSIL_HPV: HPV-infected high-grade squamous intraepithelial lesions | ||
| N_HPV: HPV-infected normal cervix | ||
| Colorectum (GSE201348) |  | FAP: Familial adenomatous polyposis |
| CRC: Colorectal cancer | ||
| Colorectum (HTA11) |  | AD: Adenomas |
| SER: Sessile serrated lesions | ||
| MSI-H: Microsatellite-high colorectal cancer | ||
| MSS: Microsatellite stable colorectal cancer | ||
| Endometrium |  | AEH: Atypical endometrial hyperplasia |
| EEC: Endometrioid Cancer | ||
| Esophagus |  | ESCC: Esophageal squamous cell carcinoma |
| HGIN: High-grade intraepithelial neoplasias | ||
| LGIN: Low-grade intraepithelial neoplasias | ||
| Liver |  | HCC: Hepatocellular carcinoma |
| NAFLD: Non-alcoholic fatty liver disease | ||
| Lung |  | AAH: Atypical adenomatous hyperplasia |
| AIS: Adenocarcinoma in situ | ||
| IAC: Invasive lung adenocarcinoma | ||
| MIA: Minimally invasive adenocarcinoma | ||
| Oral Cavity |  | EOLP: Erosive Oral lichen planus |
| LP: leukoplakia | ||
| NEOLP: Non-erosive oral lichen planus | ||
| OSCC: Oral squamous cell carcinoma | ||
| Prostate | 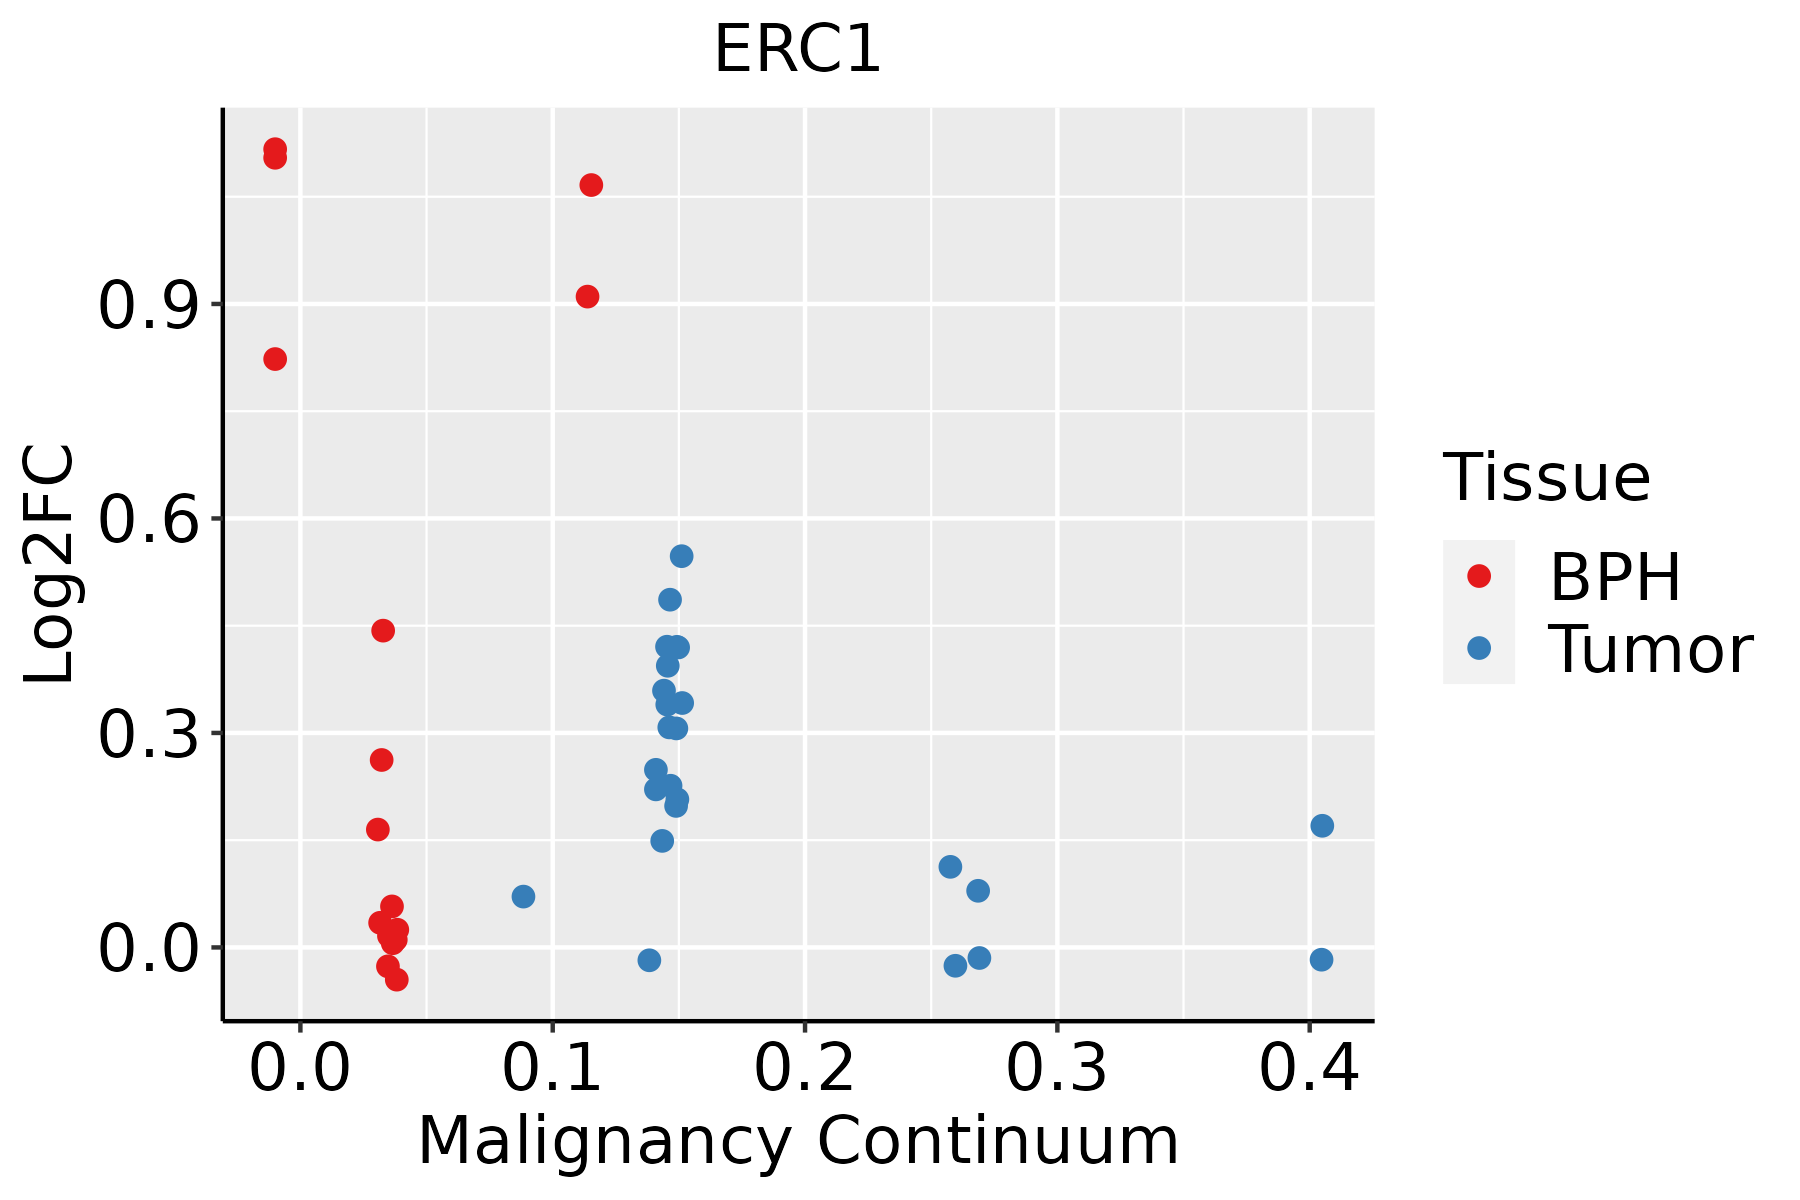 | BPH: Benign Prostatic Hyperplasia |
| Skin |  | AK: Actinic keratosis |
| cSCC: Cutaneous squamous cell carcinoma | ||
| SCCIS:squamous cell carcinoma in situ | ||
| Thyroid | 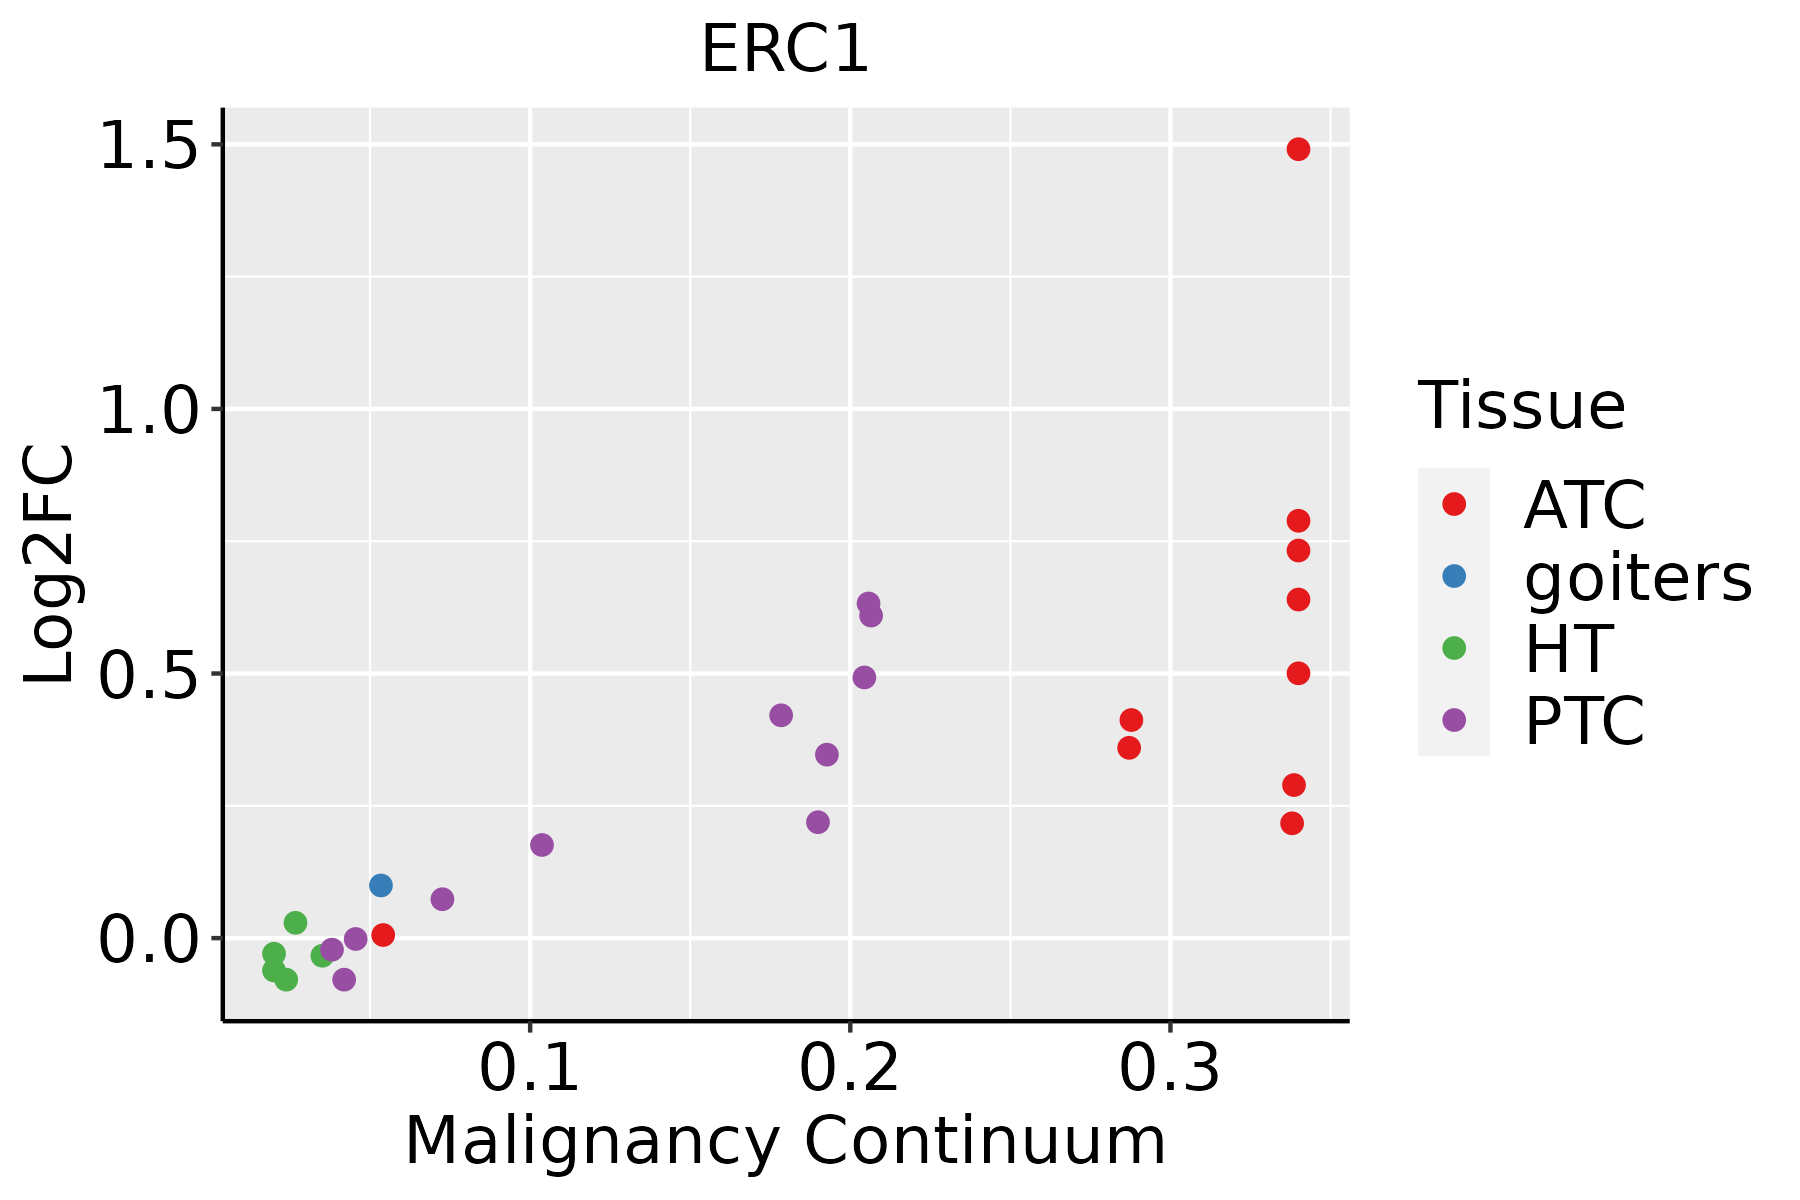 | ATC: Anaplastic thyroid cancer |
| HT: Hashimoto's thyroiditis | ||
| PTC: Papillary thyroid cancer |
| ∗log2FC in expression of this searched gene in stem-like cells from each diseased tissue sample relative to stem-like cells in normal samples in each tissue plotted against the malignancy continuum. Samples are colored based on if they are from different disease stage. |
Top |
Malignant transformation related pathway analysis |
| Find out the enriched GO biological processes and KEGG pathways involved in transition from healthy to precancer to cancer |
| Tissue | Disease Stage | Enriched GO biological Processes |
| Colorectum | AD |  |
| Colorectum | SER |  |
| Colorectum | MSS |  |
| Colorectum | MSI-H |  |
| Colorectum | FAP |  |
| ∗Top 15 enriched GO BP terms are showed in the bar plot of each disease state in each tissue. Each row represents a significant GO biological process which is colored according to the -log10(p.adjust). |
| Page: 1 2 3 4 5 6 7 8 9 |
| GO ID | Tissue | Disease Stage | Description | Gene Ratio | Bg Ratio | pvalue | p.adjust | Count |
| GO:003133010 | Cervix | CC | negative regulation of cellular catabolic process | 63/2311 | 262/18723 | 1.10e-07 | 5.68e-06 | 63 |
| GO:000989510 | Cervix | CC | negative regulation of catabolic process | 69/2311 | 320/18723 | 2.15e-06 | 6.55e-05 | 69 |
| GO:00510904 | Cervix | CC | regulation of DNA-binding transcription factor activity | 87/2311 | 440/18723 | 4.85e-06 | 1.22e-04 | 87 |
| GO:00161977 | Cervix | CC | endosomal transport | 48/2311 | 230/18723 | 1.65e-04 | 1.97e-03 | 48 |
| GO:00072497 | Cervix | CC | I-kappaB kinase/NF-kappaB signaling | 56/2311 | 281/18723 | 1.81e-04 | 2.12e-03 | 56 |
| GO:00105067 | Cervix | CC | regulation of autophagy | 61/2311 | 317/18723 | 2.61e-04 | 2.87e-03 | 61 |
| GO:00510915 | Cervix | CC | positive regulation of DNA-binding transcription factor activity | 51/2311 | 260/18723 | 5.05e-04 | 4.92e-03 | 51 |
| GO:00510923 | Cervix | CC | positive regulation of NF-kappaB transcription factor activity | 32/2311 | 152/18723 | 1.62e-03 | 1.25e-02 | 32 |
| GO:00164827 | Cervix | CC | cytosolic transport | 33/2311 | 168/18723 | 4.43e-03 | 2.70e-02 | 33 |
| GO:00343316 | Cervix | CC | cell junction maintenance | 10/2311 | 35/18723 | 7.99e-03 | 4.18e-02 | 10 |
| GO:0009895 | Colorectum | AD | negative regulation of catabolic process | 124/3918 | 320/18723 | 1.66e-13 | 3.35e-11 | 124 |
| GO:0031330 | Colorectum | AD | negative regulation of cellular catabolic process | 104/3918 | 262/18723 | 2.66e-12 | 3.96e-10 | 104 |
| GO:0016197 | Colorectum | AD | endosomal transport | 90/3918 | 230/18723 | 1.88e-10 | 1.73e-08 | 90 |
| GO:0010506 | Colorectum | AD | regulation of autophagy | 111/3918 | 317/18723 | 3.57e-09 | 2.35e-07 | 111 |
| GO:0016482 | Colorectum | AD | cytosolic transport | 68/3918 | 168/18723 | 6.00e-09 | 3.72e-07 | 68 |
| GO:0042147 | Colorectum | AD | retrograde transport, endosome to Golgi | 37/3918 | 91/18723 | 1.46e-05 | 3.14e-04 | 37 |
| GO:0043954 | Colorectum | AD | cellular component maintenance | 26/3918 | 61/18723 | 1.04e-04 | 1.56e-03 | 26 |
| GO:0007249 | Colorectum | AD | I-kappaB kinase/NF-kappaB signaling | 82/3918 | 281/18723 | 6.09e-04 | 6.40e-03 | 82 |
| GO:0010507 | Colorectum | AD | negative regulation of autophagy | 31/3918 | 85/18723 | 6.91e-04 | 7.05e-03 | 31 |
| GO:0034331 | Colorectum | AD | cell junction maintenance | 15/3918 | 35/18723 | 2.78e-03 | 2.09e-02 | 15 |
| Page: 1 2 3 4 5 6 7 8 9 10 11 12 |
| Pathway ID | Tissue | Disease Stage | Description | Gene Ratio | Bg Ratio | pvalue | p.adjust | qvalue | Count |
| hsa040645 | Esophagus | ESCC | NF-kappa B signaling pathway | 67/4205 | 104/8465 | 1.62e-03 | 4.89e-03 | 2.50e-03 | 67 |
| hsa0406412 | Esophagus | ESCC | NF-kappa B signaling pathway | 67/4205 | 104/8465 | 1.62e-03 | 4.89e-03 | 2.50e-03 | 67 |
| hsa040644 | Oral cavity | OSCC | NF-kappa B signaling pathway | 67/3704 | 104/8465 | 1.57e-05 | 6.75e-05 | 3.44e-05 | 67 |
| hsa0406411 | Oral cavity | OSCC | NF-kappa B signaling pathway | 67/3704 | 104/8465 | 1.57e-05 | 6.75e-05 | 3.44e-05 | 67 |
| hsa040642 | Oral cavity | EOLP | NF-kappa B signaling pathway | 31/1218 | 104/8465 | 3.72e-05 | 1.82e-04 | 1.07e-04 | 31 |
| hsa040643 | Oral cavity | EOLP | NF-kappa B signaling pathway | 31/1218 | 104/8465 | 3.72e-05 | 1.82e-04 | 1.07e-04 | 31 |
| Page: 1 |
Top |
Cell-cell communication analysis |
| Identification of potential cell-cell interactions between two cell types and their ligand-receptor pairs for different disease states |
| Ligand | Receptor | LRpair | Pathway | Tissue | Disease Stage |
| Page: 1 |
Top |
Single-cell gene regulatory network inference analysis |
| Find out the significant the regulons (TFs) and the target genes of each regulon across cell types for different disease states |
| TF | Cell Type | Tissue | Disease Stage | Target Gene | RSS | Regulon Activity |
| ∗The dot plots of a searched regulon are shown for all cell subpopulations in each disease state of each tissue based on the regulon specific score inferred using pySCENIC and by calculating the average expression. |
| Page: 1 |
Top |
Somatic mutation of malignant transformation related genes |
| Annotation of somatic variants for genes involved in malignant transformation |
| Hugo Symbol | Variant Class | Variant Classification | dbSNP RS | HGVSc | HGVSp | HGVSp Short | SWISSPROT | BIOTYPE | SIFT | PolyPhen | Tumor Sample Barcode | Tissue | Histology | Sex | Age | Stage | Therapy Types | Drugs | Outcome |
| ERC1 | SNV | Missense_Mutation | c.2334N>C | p.Lys778Asn | p.K778N | Q8IUD2 | protein_coding | deleterious(0) | probably_damaging(0.983) | TCGA-A2-A0YK-01 | Breast | breast invasive carcinoma | Female | <65 | I/II | Chemotherapy | cytoxan | SD | |
| ERC1 | SNV | Missense_Mutation | novel | c.3131G>T | p.Gly1044Val | p.G1044V | Q8IUD2 | protein_coding | deleterious_low_confidence(0.03) | benign(0.011) | TCGA-A2-A25A-01 | Breast | breast invasive carcinoma | Female | <65 | I/II | Unspecific | Cytoxan | SD |
| ERC1 | SNV | Missense_Mutation | c.3016N>G | p.Pro1006Ala | p.P1006A | Q8IUD2 | protein_coding | deleterious_low_confidence(0) | possibly_damaging(0.813) | TCGA-A2-A25E-01 | Breast | breast invasive carcinoma | Female | <65 | III/IV | Chemotherapy | cytoxan | PD | |
| ERC1 | SNV | Missense_Mutation | c.3139C>T | p.Pro1047Ser | p.P1047S | Q8IUD2 | protein_coding | tolerated_low_confidence(0.08) | probably_damaging(0.994) | TCGA-A7-A0D9-01 | Breast | breast invasive carcinoma | Female | <65 | I/II | Chemotherapy | taxotere | SD | |
| ERC1 | SNV | Missense_Mutation | novel | c.430N>T | p.Arg144Cys | p.R144C | Q8IUD2 | protein_coding | deleterious(0) | probably_damaging(0.943) | TCGA-AN-A046-01 | Breast | breast invasive carcinoma | Female | >=65 | I/II | Unknown | Unknown | SD |
| ERC1 | SNV | Missense_Mutation | novel | c.2843N>T | p.Ser948Leu | p.S948L | Q8IUD2 | protein_coding | deleterious(0) | probably_damaging(0.999) | TCGA-AN-A046-01 | Breast | breast invasive carcinoma | Female | >=65 | I/II | Unknown | Unknown | SD |
| ERC1 | SNV | Missense_Mutation | c.1783A>T | p.Ser595Cys | p.S595C | Q8IUD2 | protein_coding | tolerated(0.07) | probably_damaging(0.926) | TCGA-AO-A12H-01 | Breast | breast invasive carcinoma | Female | >=65 | I/II | Hormone Therapy | arimidex | SD | |
| ERC1 | SNV | Missense_Mutation | c.1120N>C | p.Ser374Pro | p.S374P | Q8IUD2 | protein_coding | tolerated(0.66) | benign(0.012) | TCGA-BH-A18G-01 | Breast | breast invasive carcinoma | Female | >=65 | I/II | Unknown | Unknown | SD | |
| ERC1 | SNV | Missense_Mutation | c.2738G>A | p.Arg913Gln | p.R913Q | Q8IUD2 | protein_coding | tolerated(0.14) | probably_damaging(0.989) | TCGA-E2-A573-01 | Breast | breast invasive carcinoma | Female | <65 | I/II | Chemotherapy | taxotere | CR | |
| ERC1 | insertion | Frame_Shift_Ins | novel | c.3210_3211insAT | p.Gln1071IlefsTer7 | p.Q1071Ifs*7 | Q8IUD2 | protein_coding | TCGA-AN-A03X-01 | Breast | breast invasive carcinoma | Female | >=65 | I/II | Unknown | Unknown | SD |
| Page: 1 2 3 4 5 6 7 8 9 10 11 |
Top |
Related drugs of malignant transformation related genes |
| Identification of chemicals and drugs interact with genes involved in malignant transfromation |
| (DGIdb 4.0) |
| Entrez ID | Symbol | Category | Interaction Types | Drug Claim Name | Drug Name | PMIDs |
| Page: 1 |

Copyright 2023-Present -The University of Texas Health Science Center at Houston |