
|
|||||
|
 | |
| |
| |
| |
| |
| |
|
Gene: ERBB3 |
Gene summary for ERBB3 |
| Gene information | Species | Human | Gene symbol | ERBB3 | Gene ID | 2065 |
| Gene name | erb-b2 receptor tyrosine kinase 3 | |
| Gene Alias | ErbB-3 | |
| Cytomap | 12q13.2 | |
| Gene Type | protein-coding | GO ID | GO:0001932 | UniProtAcc | P21860 |
Top |
Malignant transformation analysis |
| Identification of the aberrant gene expression in precancerous and cancerous lesions by comparing the gene expression of stem-like cells in diseased tissues with normal stem cells |
| Entrez ID | Symbol | Replicates | Species | Organ | Tissue | Adj P-value | Log2FC | Malignancy |
| 2065 | ERBB3 | GSM4909285 | Human | Breast | IDC | 6.98e-03 | 2.54e-01 | 0.21 |
| 2065 | ERBB3 | GSM4909293 | Human | Breast | IDC | 2.67e-14 | 3.89e-01 | 0.1581 |
| 2065 | ERBB3 | GSM4909296 | Human | Breast | IDC | 7.91e-05 | -7.77e-02 | 0.1524 |
| 2065 | ERBB3 | GSM4909297 | Human | Breast | IDC | 1.09e-02 | -1.83e-02 | 0.1517 |
| 2065 | ERBB3 | GSM4909298 | Human | Breast | IDC | 2.36e-21 | 5.99e-01 | 0.1551 |
| 2065 | ERBB3 | GSM4909301 | Human | Breast | IDC | 7.73e-11 | 5.31e-01 | 0.1577 |
| 2065 | ERBB3 | GSM4909302 | Human | Breast | IDC | 4.33e-04 | 3.39e-01 | 0.1545 |
| 2065 | ERBB3 | GSM4909306 | Human | Breast | IDC | 3.85e-07 | 3.75e-01 | 0.1564 |
| 2065 | ERBB3 | GSM4909307 | Human | Breast | IDC | 1.13e-04 | 3.13e-01 | 0.1569 |
| 2065 | ERBB3 | GSM4909311 | Human | Breast | IDC | 6.99e-21 | -3.27e-02 | 0.1534 |
| 2065 | ERBB3 | GSM4909312 | Human | Breast | IDC | 7.40e-11 | 2.00e-01 | 0.1552 |
| 2065 | ERBB3 | GSM4909319 | Human | Breast | IDC | 9.66e-22 | -2.08e-01 | 0.1563 |
| 2065 | ERBB3 | GSM4909320 | Human | Breast | IDC | 1.13e-03 | 7.80e-02 | 0.1575 |
| 2065 | ERBB3 | GSM4909321 | Human | Breast | IDC | 7.10e-11 | 9.48e-02 | 0.1559 |
| 2065 | ERBB3 | M1 | Human | Breast | IDC | 6.46e-10 | 5.43e-01 | 0.1577 |
| 2065 | ERBB3 | NCCBC14 | Human | Breast | DCIS | 4.66e-05 | -1.89e-01 | 0.2021 |
| 2065 | ERBB3 | NCCBC2 | Human | Breast | DCIS | 2.05e-03 | 3.00e-01 | 0.1554 |
| 2065 | ERBB3 | NCCBC5 | Human | Breast | DCIS | 5.81e-06 | -2.35e-01 | 0.2046 |
| 2065 | ERBB3 | P1 | Human | Breast | IDC | 5.34e-09 | 3.21e-02 | 0.1527 |
| 2065 | ERBB3 | DCIS2 | Human | Breast | DCIS | 4.90e-51 | 1.24e-01 | 0.0085 |
| Page: 1 2 3 4 5 6 7 8 9 |
| Tissue | Expression Dynamics | Abbreviation |
| Breast | 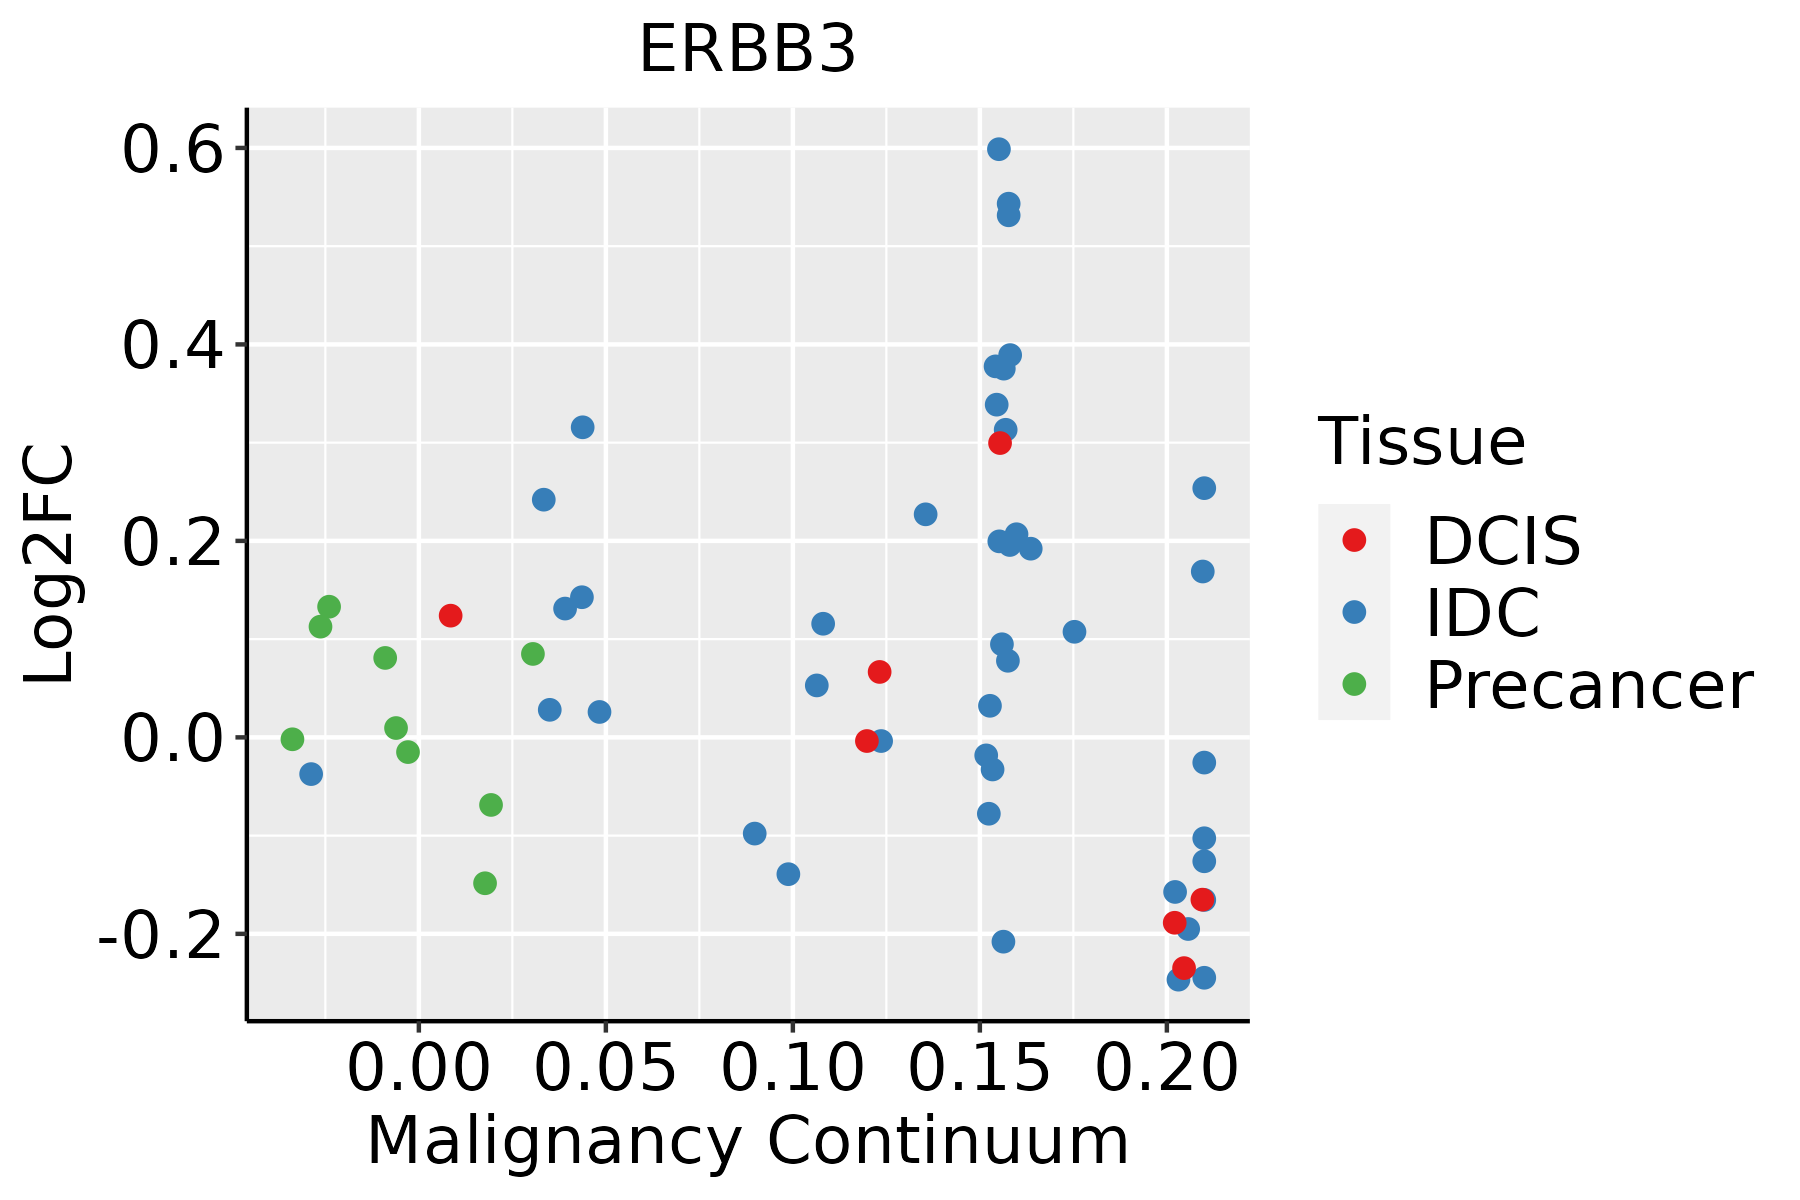 | IDC: Invasive ductal carcinoma |
| DCIS: Ductal carcinoma in situ | ||
| Precancer(BRCA1-mut): Precancerous lesion from BRCA1 mutation carriers | ||
| Colorectum (GSE201348) |  | FAP: Familial adenomatous polyposis |
| CRC: Colorectal cancer | ||
| Colorectum (HTA11) | 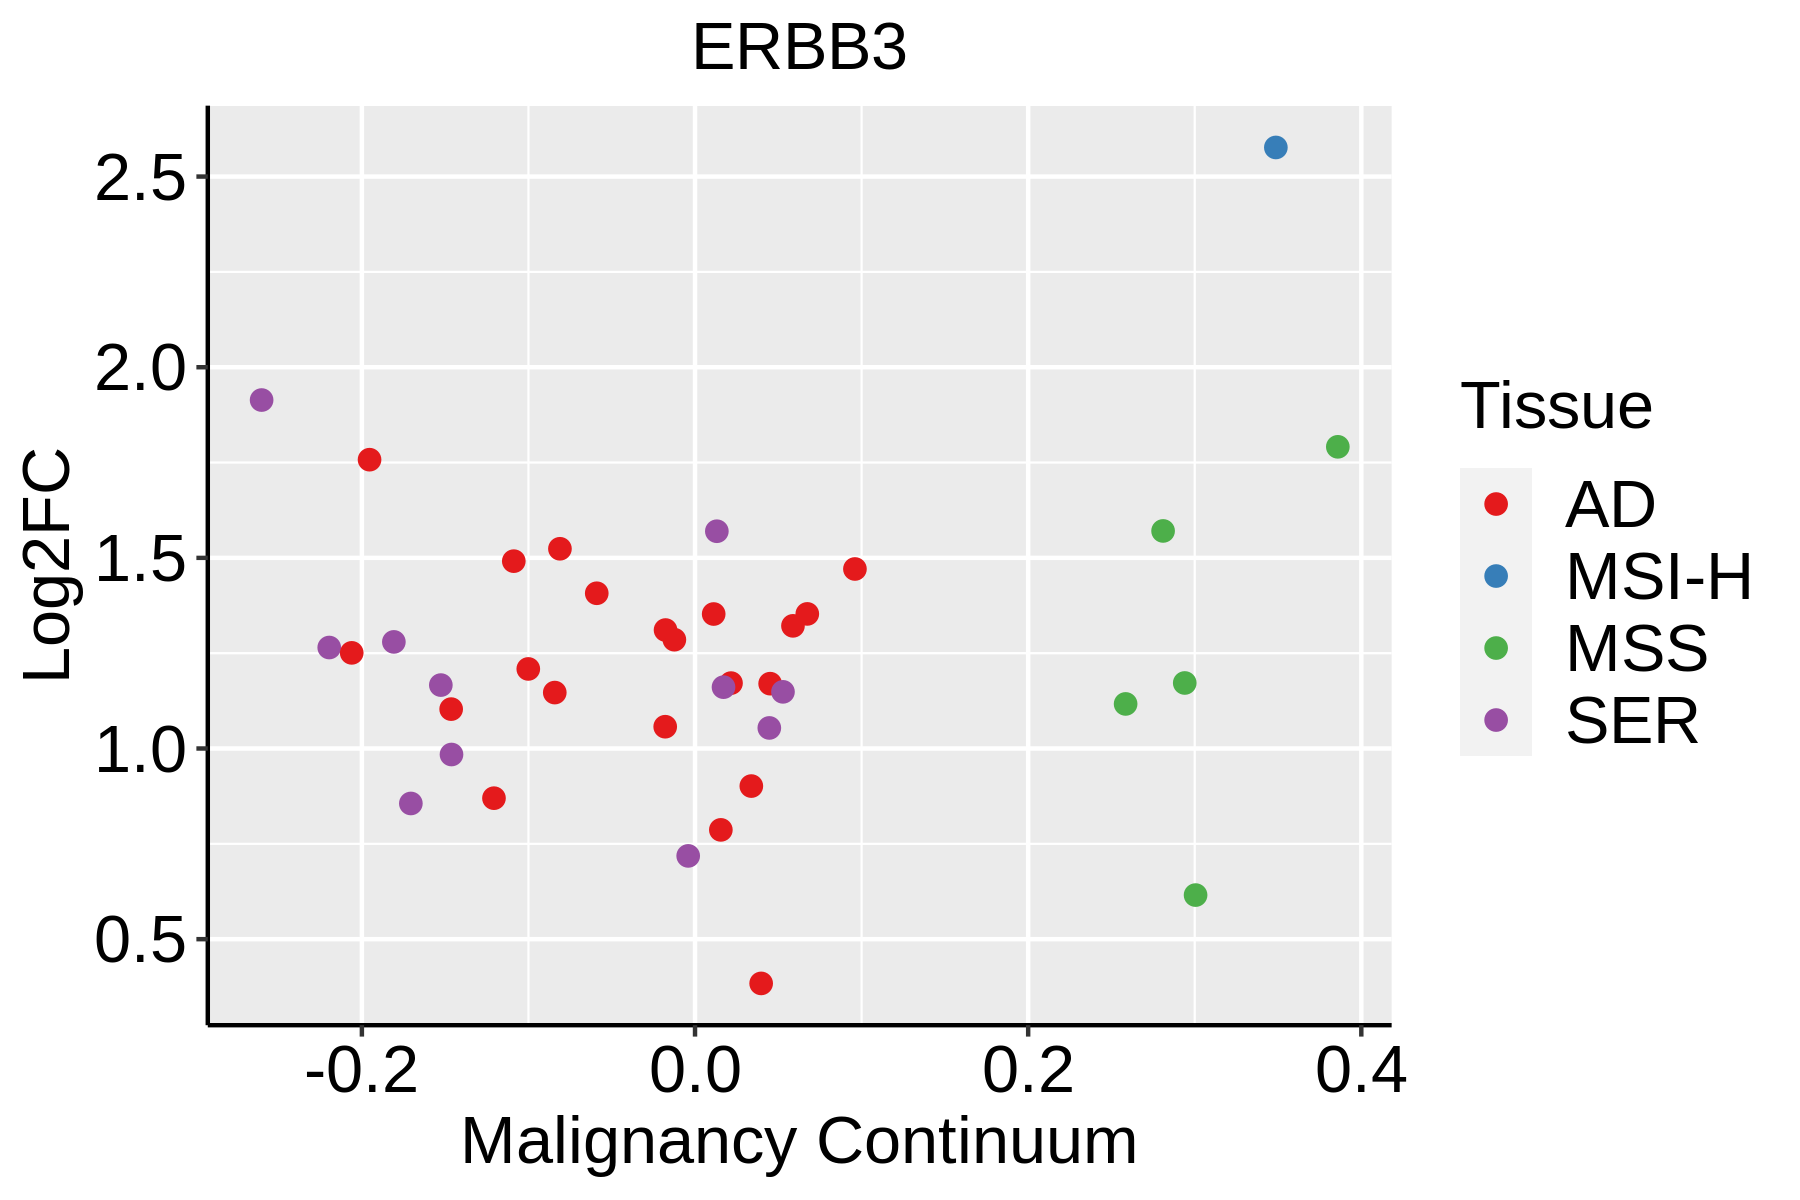 | AD: Adenomas |
| SER: Sessile serrated lesions | ||
| MSI-H: Microsatellite-high colorectal cancer | ||
| MSS: Microsatellite stable colorectal cancer | ||
| Esophagus |  | ESCC: Esophageal squamous cell carcinoma |
| HGIN: High-grade intraepithelial neoplasias | ||
| LGIN: Low-grade intraepithelial neoplasias | ||
| Liver |  | HCC: Hepatocellular carcinoma |
| NAFLD: Non-alcoholic fatty liver disease | ||
| Oral Cavity |  | EOLP: Erosive Oral lichen planus |
| LP: leukoplakia | ||
| NEOLP: Non-erosive oral lichen planus | ||
| OSCC: Oral squamous cell carcinoma | ||
| Prostate |  | BPH: Benign Prostatic Hyperplasia |
| Thyroid |  | ATC: Anaplastic thyroid cancer |
| HT: Hashimoto's thyroiditis | ||
| PTC: Papillary thyroid cancer |
| ∗log2FC in expression of this searched gene in stem-like cells from each diseased tissue sample relative to stem-like cells in normal samples in each tissue plotted against the malignancy continuum. Samples are colored based on if they are from different disease stage. |
Top |
Malignant transformation related pathway analysis |
| Find out the enriched GO biological processes and KEGG pathways involved in transition from healthy to precancer to cancer |
| Tissue | Disease Stage | Enriched GO biological Processes |
| Colorectum | AD |  |
| Colorectum | SER |  |
| Colorectum | MSS |  |
| Colorectum | MSI-H |  |
| Colorectum | FAP |  |
| ∗Top 15 enriched GO BP terms are showed in the bar plot of each disease state in each tissue. Each row represents a significant GO biological process which is colored according to the -log10(p.adjust). |
| Page: 1 2 3 4 5 6 7 8 9 |
| GO ID | Tissue | Disease Stage | Description | Gene Ratio | Bg Ratio | pvalue | p.adjust | Count |
| GO:009719114 | Breast | IDC | extrinsic apoptotic signaling pathway | 42/1434 | 219/18723 | 2.56e-08 | 1.73e-06 | 42 |
| GO:007099714 | Breast | IDC | neuron death | 57/1434 | 361/18723 | 1.31e-07 | 7.38e-06 | 57 |
| GO:005140213 | Breast | IDC | neuron apoptotic process | 42/1434 | 246/18723 | 7.21e-07 | 3.35e-05 | 42 |
| GO:190121414 | Breast | IDC | regulation of neuron death | 48/1434 | 319/18723 | 5.01e-06 | 1.69e-04 | 48 |
| GO:004352313 | Breast | IDC | regulation of neuron apoptotic process | 35/1434 | 212/18723 | 1.26e-05 | 3.29e-04 | 35 |
| GO:004206014 | Breast | IDC | wound healing | 55/1434 | 422/18723 | 7.27e-05 | 1.45e-03 | 55 |
| GO:004352411 | Breast | IDC | negative regulation of neuron apoptotic process | 23/1434 | 145/18723 | 6.58e-04 | 8.11e-03 | 23 |
| GO:004206311 | Breast | IDC | gliogenesis | 39/1434 | 301/18723 | 8.63e-04 | 1.00e-02 | 39 |
| GO:00100011 | Breast | IDC | glial cell differentiation | 31/1434 | 225/18723 | 1.04e-03 | 1.15e-02 | 31 |
| GO:190121513 | Breast | IDC | negative regulation of neuron death | 29/1434 | 208/18723 | 1.23e-03 | 1.32e-02 | 29 |
| GO:00071625 | Breast | IDC | negative regulation of cell adhesion | 37/1434 | 303/18723 | 3.27e-03 | 2.75e-02 | 37 |
| GO:007099724 | Breast | DCIS | neuron death | 57/1390 | 361/18723 | 4.56e-08 | 2.84e-06 | 57 |
| GO:009719123 | Breast | DCIS | extrinsic apoptotic signaling pathway | 40/1390 | 219/18723 | 9.43e-08 | 5.28e-06 | 40 |
| GO:005140222 | Breast | DCIS | neuron apoptotic process | 43/1390 | 246/18723 | 1.16e-07 | 6.13e-06 | 43 |
| GO:190121421 | Breast | DCIS | regulation of neuron death | 48/1390 | 319/18723 | 2.13e-06 | 7.79e-05 | 48 |
| GO:004352321 | Breast | DCIS | regulation of neuron apoptotic process | 36/1390 | 212/18723 | 2.45e-06 | 8.68e-05 | 36 |
| GO:004206024 | Breast | DCIS | wound healing | 54/1390 | 422/18723 | 6.09e-05 | 1.22e-03 | 54 |
| GO:004352421 | Breast | DCIS | negative regulation of neuron apoptotic process | 23/1390 | 145/18723 | 4.27e-04 | 5.72e-03 | 23 |
| GO:00420632 | Breast | DCIS | gliogenesis | 39/1390 | 301/18723 | 4.76e-04 | 6.25e-03 | 39 |
| GO:00100012 | Breast | DCIS | glial cell differentiation | 31/1390 | 225/18723 | 6.24e-04 | 7.87e-03 | 31 |
| Page: 1 2 3 4 5 6 7 8 9 10 11 |
| Pathway ID | Tissue | Disease Stage | Description | Gene Ratio | Bg Ratio | pvalue | p.adjust | qvalue | Count |
| hsa0520523 | Breast | IDC | Proteoglycans in cancer | 42/867 | 205/8465 | 7.69e-06 | 9.99e-05 | 7.48e-05 | 42 |
| hsa0520533 | Breast | IDC | Proteoglycans in cancer | 42/867 | 205/8465 | 7.69e-06 | 9.99e-05 | 7.48e-05 | 42 |
| hsa0520542 | Breast | DCIS | Proteoglycans in cancer | 39/846 | 205/8465 | 5.36e-05 | 5.58e-04 | 4.11e-04 | 39 |
| hsa0520552 | Breast | DCIS | Proteoglycans in cancer | 39/846 | 205/8465 | 5.36e-05 | 5.58e-04 | 4.11e-04 | 39 |
| hsa05205 | Colorectum | AD | Proteoglycans in cancer | 70/2092 | 205/8465 | 1.37e-03 | 8.46e-03 | 5.39e-03 | 70 |
| hsa04012 | Colorectum | AD | ErbB signaling pathway | 31/2092 | 85/8465 | 1.02e-02 | 3.91e-02 | 2.50e-02 | 31 |
| hsa01521 | Colorectum | AD | EGFR tyrosine kinase inhibitor resistance | 29/2092 | 79/8465 | 1.15e-02 | 4.24e-02 | 2.71e-02 | 29 |
| hsa052051 | Colorectum | AD | Proteoglycans in cancer | 70/2092 | 205/8465 | 1.37e-03 | 8.46e-03 | 5.39e-03 | 70 |
| hsa040121 | Colorectum | AD | ErbB signaling pathway | 31/2092 | 85/8465 | 1.02e-02 | 3.91e-02 | 2.50e-02 | 31 |
| hsa015211 | Colorectum | AD | EGFR tyrosine kinase inhibitor resistance | 29/2092 | 79/8465 | 1.15e-02 | 4.24e-02 | 2.71e-02 | 29 |
| hsa052052 | Colorectum | SER | Proteoglycans in cancer | 58/1580 | 205/8465 | 4.37e-04 | 3.82e-03 | 2.77e-03 | 58 |
| hsa052053 | Colorectum | SER | Proteoglycans in cancer | 58/1580 | 205/8465 | 4.37e-04 | 3.82e-03 | 2.77e-03 | 58 |
| hsa052054 | Colorectum | MSS | Proteoglycans in cancer | 65/1875 | 205/8465 | 8.66e-04 | 5.38e-03 | 3.29e-03 | 65 |
| hsa040122 | Colorectum | MSS | ErbB signaling pathway | 30/1875 | 85/8465 | 3.73e-03 | 1.67e-02 | 1.02e-02 | 30 |
| hsa052055 | Colorectum | MSS | Proteoglycans in cancer | 65/1875 | 205/8465 | 8.66e-04 | 5.38e-03 | 3.29e-03 | 65 |
| hsa040123 | Colorectum | MSS | ErbB signaling pathway | 30/1875 | 85/8465 | 3.73e-03 | 1.67e-02 | 1.02e-02 | 30 |
| hsa052056 | Colorectum | FAP | Proteoglycans in cancer | 57/1404 | 205/8465 | 3.05e-05 | 3.29e-04 | 2.00e-04 | 57 |
| hsa015212 | Colorectum | FAP | EGFR tyrosine kinase inhibitor resistance | 26/1404 | 79/8465 | 2.69e-04 | 2.19e-03 | 1.33e-03 | 26 |
| hsa040124 | Colorectum | FAP | ErbB signaling pathway | 26/1404 | 85/8465 | 9.52e-04 | 5.22e-03 | 3.17e-03 | 26 |
| hsa04010 | Colorectum | FAP | MAPK signaling pathway | 68/1404 | 302/8465 | 4.00e-03 | 1.67e-02 | 1.02e-02 | 68 |
| Page: 1 2 3 4 |
Top |
Cell-cell communication analysis |
| Identification of potential cell-cell interactions between two cell types and their ligand-receptor pairs for different disease states |
| Ligand | Receptor | LRpair | Pathway | Tissue | Disease Stage |
| NRG1 | ERBB3 | NRG1_ERBB3 | NRG | Breast | DCIS |
| NRG1 | ERBB2_ERBB3 | NRG1_ERBB2_ERBB3 | NRG | Breast | DCIS |
| NRG1 | ERBB3 | NRG1_ERBB3 | NRG | Cervix | CC |
| NRG1 | ERBB3 | NRG1_ERBB3 | NRG | Cervix | Precancer |
| NRG1 | ERBB2_ERBB3 | NRG1_ERBB2_ERBB3 | NRG | Cervix | Precancer |
| NRG1 | ERBB3 | NRG1_ERBB3 | NRG | CRC | AD |
| NRG1 | ERBB2_ERBB3 | NRG1_ERBB2_ERBB3 | NRG | CRC | AD |
| NRG1 | ERBB3 | NRG1_ERBB3 | NRG | CRC | ADJ |
| NRG1 | ERBB2_ERBB3 | NRG1_ERBB2_ERBB3 | NRG | CRC | ADJ |
| NRG1 | ERBB3 | NRG1_ERBB3 | NRG | CRC | FAP |
| NRG1 | ERBB2_ERBB3 | NRG1_ERBB2_ERBB3 | NRG | CRC | FAP |
| NRG1 | ERBB3 | NRG1_ERBB3 | NRG | CRC | MSS |
| NRG1 | ERBB2_ERBB3 | NRG1_ERBB2_ERBB3 | NRG | CRC | MSS |
| NRG1 | ERBB3 | NRG1_ERBB3 | NRG | Esophagus | ESCC |
| NRG1 | ERBB2_ERBB3 | NRG1_ERBB2_ERBB3 | NRG | Esophagus | ESCC |
| NRG2 | ERBB3 | NRG2_ERBB3 | NRG | Esophagus | ESCC |
| NRG2 | ERBB2_ERBB3 | NRG2_ERBB2_ERBB3 | NRG | Esophagus | ESCC |
| NRG1 | ERBB3 | NRG1_ERBB3 | NRG | GC | ADJ |
| NRG1 | ERBB3 | NRG1_ERBB3 | NRG | GC | GC |
| NRG1 | ERBB3 | NRG1_ERBB3 | NRG | HNSCC | OSCC |
| Page: 1 |
Top |
Single-cell gene regulatory network inference analysis |
| Find out the significant the regulons (TFs) and the target genes of each regulon across cell types for different disease states |
| TF | Cell Type | Tissue | Disease Stage | Target Gene | RSS | Regulon Activity |
| ∗The dot plots of a searched regulon are shown for all cell subpopulations in each disease state of each tissue based on the regulon specific score inferred using pySCENIC and by calculating the average expression. |
| Page: 1 |
Top |
Somatic mutation of malignant transformation related genes |
| Annotation of somatic variants for genes involved in malignant transformation |
| Hugo Symbol | Variant Class | Variant Classification | dbSNP RS | HGVSc | HGVSp | HGVSp Short | SWISSPROT | BIOTYPE | SIFT | PolyPhen | Tumor Sample Barcode | Tissue | Histology | Sex | Age | Stage | Therapy Types | Drugs | Outcome |
| ERBB3 | SNV | Missense_Mutation | novel | c.2783A>G | p.Glu928Gly | p.E928G | P21860 | protein_coding | deleterious(0) | probably_damaging(1) | TCGA-A1-A0SF-01 | Breast | breast invasive carcinoma | Female | <65 | I/II | Chemotherapy | tc | SD |
| ERBB3 | SNV | Missense_Mutation | novel | c.3505N>C | p.Thr1169Pro | p.T1169P | P21860 | protein_coding | tolerated(0.07) | benign(0) | TCGA-A2-A04P-01 | Breast | breast invasive carcinoma | Female | <65 | III/IV | Chemotherapy | taxol | PD |
| ERBB3 | SNV | Missense_Mutation | c.850N>A | p.Gly284Arg | p.G284R | P21860 | protein_coding | deleterious(0) | benign(0.063) | TCGA-A2-A3XV-01 | Breast | breast invasive carcinoma | Female | <65 | I/II | Chemotherapy | carboplatin | CR | |
| ERBB3 | SNV | Missense_Mutation | novel | c.413N>T | p.Gln138Leu | p.Q138L | P21860 | protein_coding | deleterious(0.02) | benign(0.225) | TCGA-A7-A56D-01 | Breast | breast invasive carcinoma | Female | >=65 | I/II | Hormone Therapy | arimidex | SD |
| ERBB3 | SNV | Missense_Mutation | c.2374N>G | p.Leu792Val | p.L792V | P21860 | protein_coding | tolerated(0.48) | benign(0.116) | TCGA-A8-A09G-01 | Breast | breast invasive carcinoma | Female | >=65 | III/IV | Unknown | Unknown | SD | |
| ERBB3 | SNV | Missense_Mutation | novel | c.2783N>G | p.Glu928Gly | p.E928G | P21860 | protein_coding | deleterious(0) | probably_damaging(1) | TCGA-A8-A09G-01 | Breast | breast invasive carcinoma | Female | >=65 | III/IV | Unknown | Unknown | SD |
| ERBB3 | SNV | Missense_Mutation | rs781015952 | c.3079N>A | p.Leu1027Met | p.L1027M | P21860 | protein_coding | tolerated(0.11) | probably_damaging(0.994) | TCGA-AC-A23H-01 | Breast | breast invasive carcinoma | Female | >=65 | I/II | Unknown | Unknown | PD |
| ERBB3 | SNV | Missense_Mutation | c.3782A>C | p.Glu1261Ala | p.E1261A | P21860 | protein_coding | tolerated(0.17) | possibly_damaging(0.714) | TCGA-AN-A0FV-01 | Breast | breast invasive carcinoma | Female | <65 | I/II | Unknown | Unknown | SD | |
| ERBB3 | SNV | Missense_Mutation | c.1132G>C | p.Ala378Pro | p.A378P | P21860 | protein_coding | tolerated(0.98) | benign(0.038) | TCGA-AN-A0FX-01 | Breast | breast invasive carcinoma | Female | <65 | I/II | Unknown | Unknown | SD | |
| ERBB3 | SNV | Missense_Mutation | c.1293N>C | p.Leu431Phe | p.L431F | P21860 | protein_coding | deleterious(0.01) | probably_damaging(0.987) | TCGA-AR-A0TX-01 | Breast | breast invasive carcinoma | Female | <65 | I/II | Unknown | Unknown | SD |
| Page: 1 2 3 4 5 6 7 8 9 10 11 12 13 14 15 16 17 18 19 20 21 22 23 |
Top |
Related drugs of malignant transformation related genes |
| Identification of chemicals and drugs interact with genes involved in malignant transfromation |
| (DGIdb 4.0) |
| Entrez ID | Symbol | Category | Interaction Types | Drug Claim Name | Drug Name | PMIDs |
| 2065 | ERBB3 | DRUGGABLE GENOME, KINASE, TYROSINE KINASE, ENZYME, CLINICALLY ACTIONABLE, DRUG RESISTANCE | antibody | 252827373 | ELGEMTUMAB | |
| 2065 | ERBB3 | DRUGGABLE GENOME, KINASE, TYROSINE KINASE, ENZYME, CLINICALLY ACTIONABLE, DRUG RESISTANCE | TRASTUZUMAB | TRASTUZUMAB | 23680147 | |
| 2065 | ERBB3 | DRUGGABLE GENOME, KINASE, TYROSINE KINASE, ENZYME, CLINICALLY ACTIONABLE, DRUG RESISTANCE | 178101724 | |||
| 2065 | ERBB3 | DRUGGABLE GENOME, KINASE, TYROSINE KINASE, ENZYME, CLINICALLY ACTIONABLE, DRUG RESISTANCE | lapatinib | LAPATINIB | ||
| 2065 | ERBB3 | DRUGGABLE GENOME, KINASE, TYROSINE KINASE, ENZYME, CLINICALLY ACTIONABLE, DRUG RESISTANCE | inhibitor | CHEMBL2109406 | PATRITUMAB | |
| 2065 | ERBB3 | DRUGGABLE GENOME, KINASE, TYROSINE KINASE, ENZYME, CLINICALLY ACTIONABLE, DRUG RESISTANCE | inhibitor | DACOMITINIB | DACOMITINIB | |
| 2065 | ERBB3 | DRUGGABLE GENOME, KINASE, TYROSINE KINASE, ENZYME, CLINICALLY ACTIONABLE, DRUG RESISTANCE | CDX-3379 | |||
| 2065 | ERBB3 | DRUGGABLE GENOME, KINASE, TYROSINE KINASE, ENZYME, CLINICALLY ACTIONABLE, DRUG RESISTANCE | inhibitor | 315661317 | ||
| 2065 | ERBB3 | DRUGGABLE GENOME, KINASE, TYROSINE KINASE, ENZYME, CLINICALLY ACTIONABLE, DRUG RESISTANCE | LAPATINIB | LAPATINIB | 25953157,25398453 | |
| 2065 | ERBB3 | DRUGGABLE GENOME, KINASE, TYROSINE KINASE, ENZYME, CLINICALLY ACTIONABLE, DRUG RESISTANCE | PERTUZUMAB | PERTUZUMAB | 23680147 |
| Page: 1 2 3 4 5 6 7 8 |

Copyright 2023-Present -The University of Texas Health Science Center at Houston |