| Tissue | Expression Dynamics | Abbreviation |
| Esophagus | 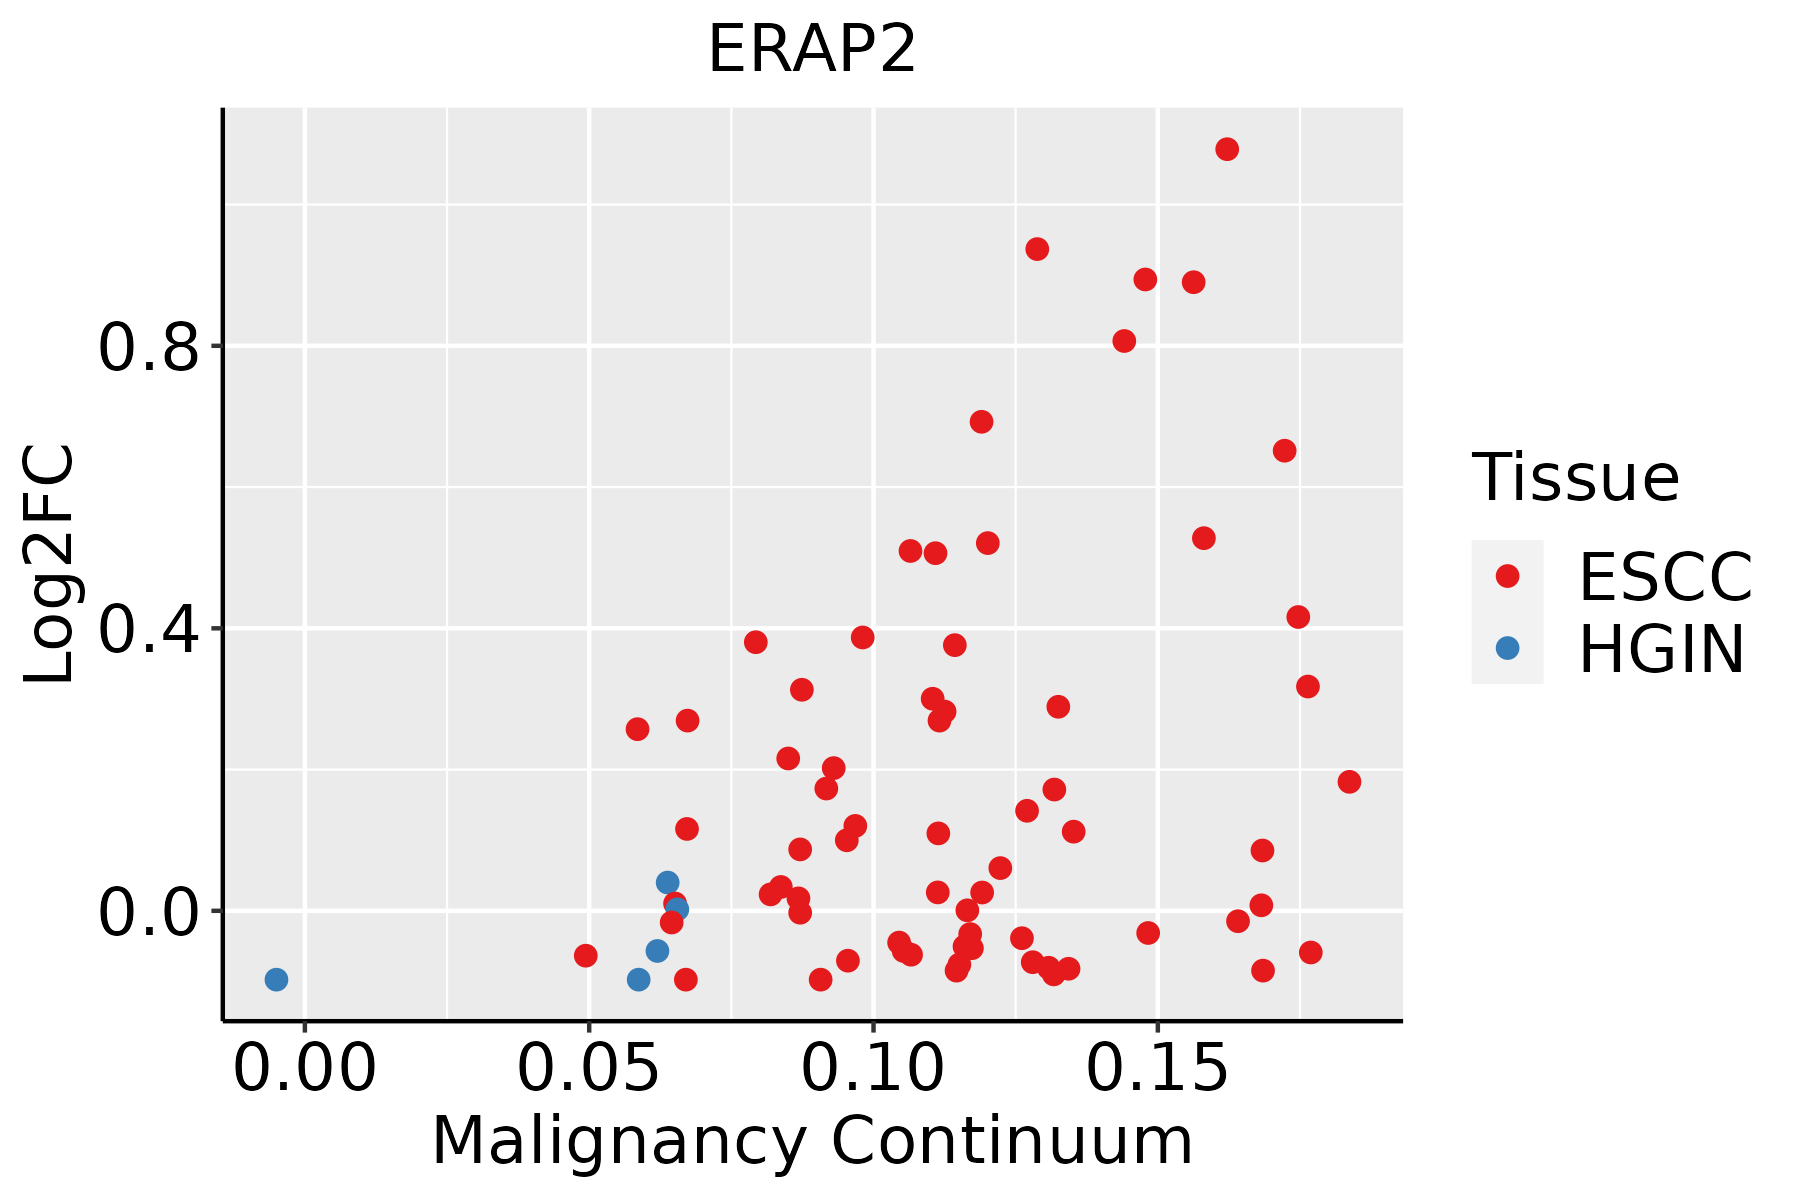 | ESCC: Esophageal squamous cell carcinoma |
| HGIN: High-grade intraepithelial neoplasias |
| LGIN: Low-grade intraepithelial neoplasias |
| Liver |  | HCC: Hepatocellular carcinoma |
| NAFLD: Non-alcoholic fatty liver disease |
| Oral Cavity |  | EOLP: Erosive Oral lichen planus |
| LP: leukoplakia |
| NEOLP: Non-erosive oral lichen planus |
| OSCC: Oral squamous cell carcinoma |
| Prostate | 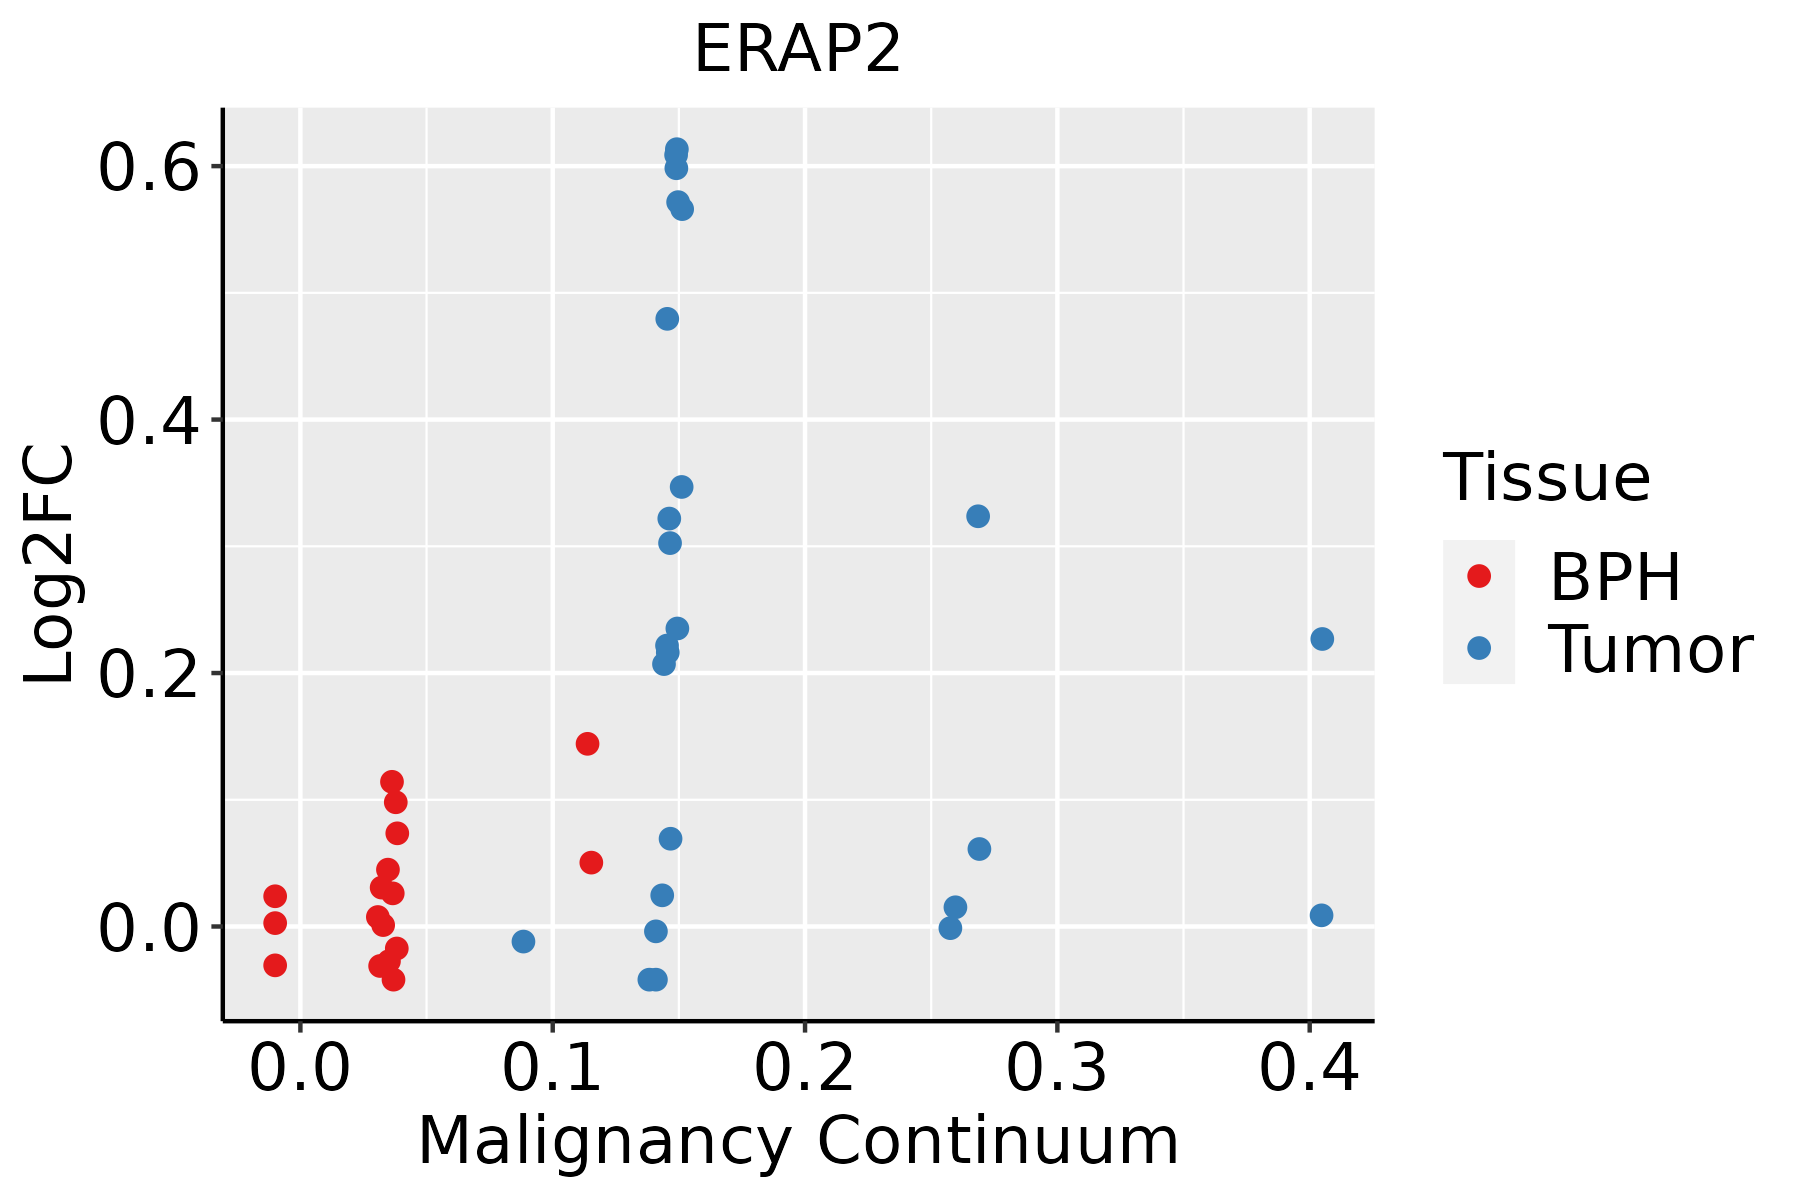 | BPH: Benign Prostatic Hyperplasia |
| Skin |  | AK: Actinic keratosis |
| cSCC: Cutaneous squamous cell carcinoma |
| SCCIS:squamous cell carcinoma in situ |
| Thyroid | 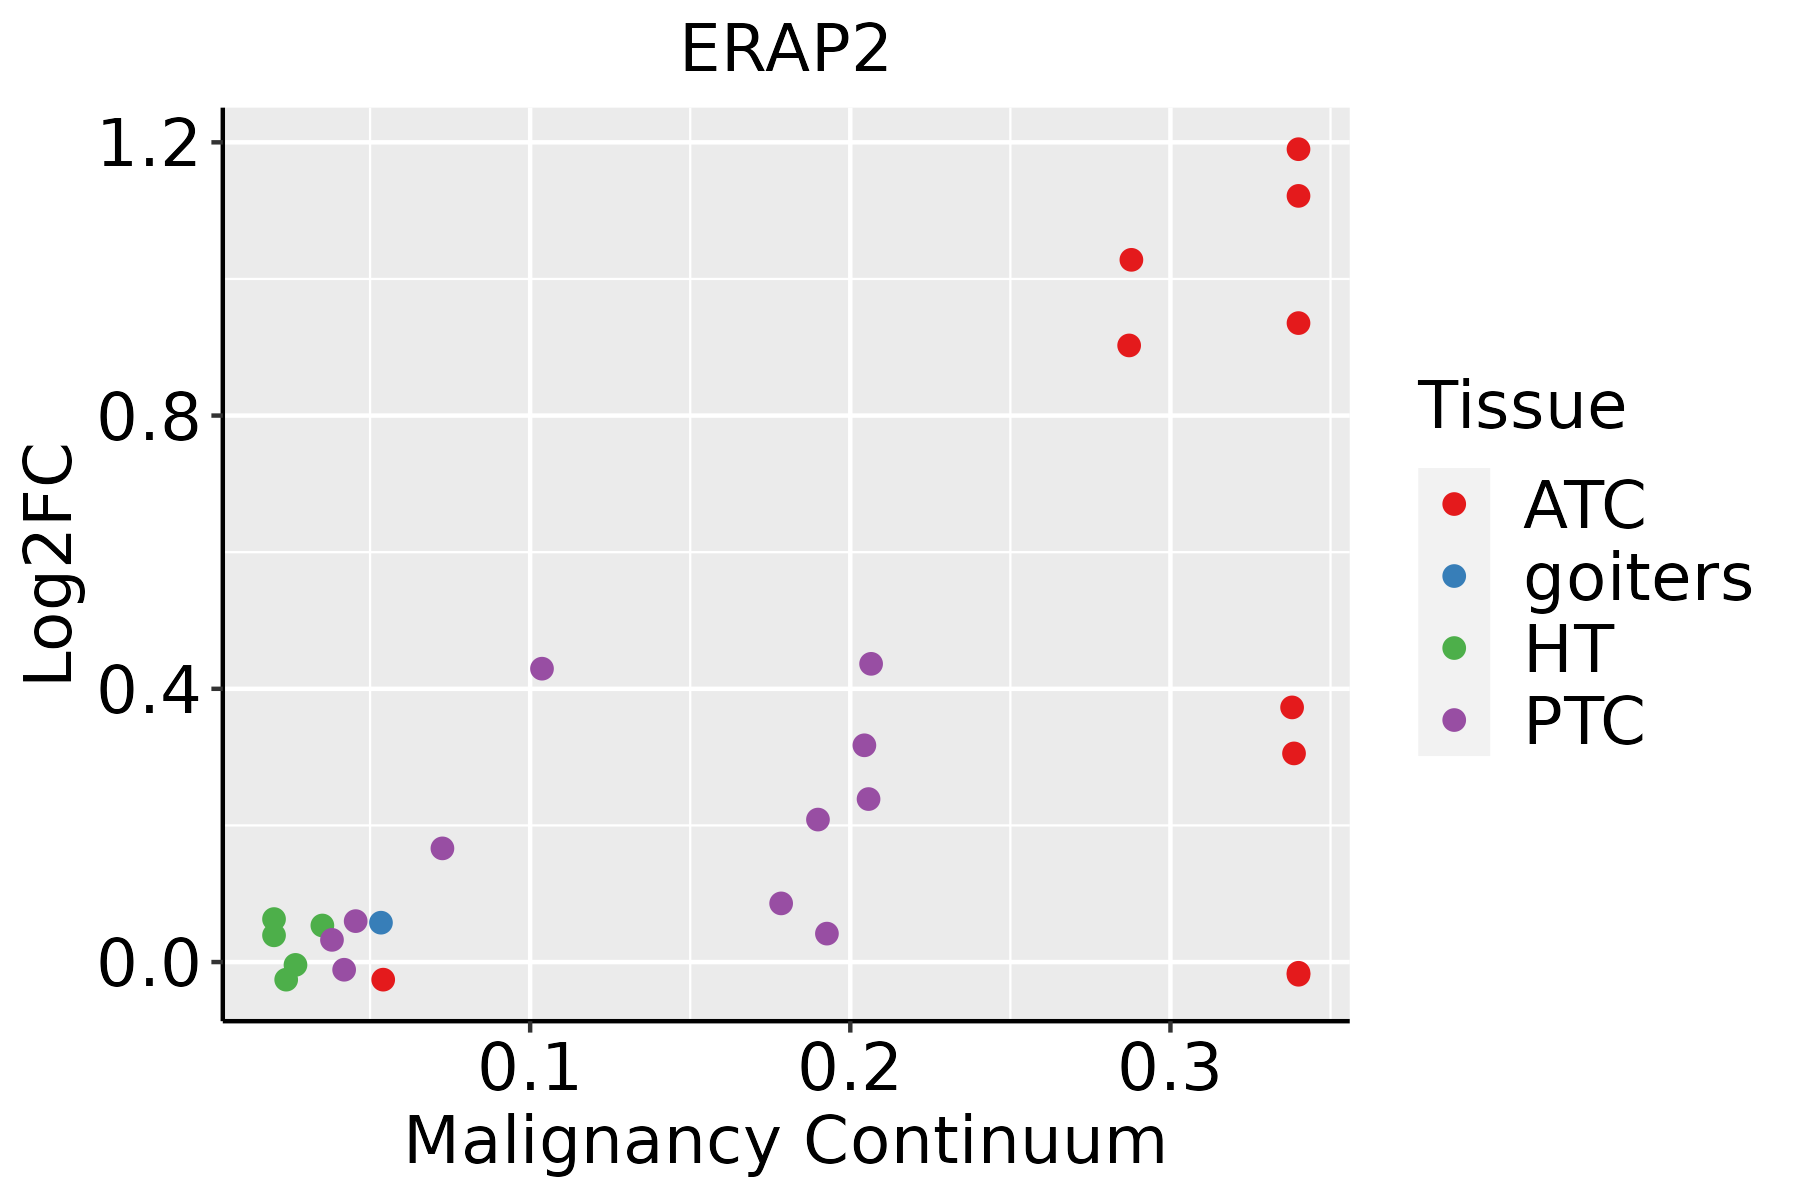 | ATC: Anaplastic thyroid cancer |
| HT: Hashimoto's thyroiditis |
| PTC: Papillary thyroid cancer |
| GO ID | Tissue | Disease Stage | Description | Gene Ratio | Bg Ratio | pvalue | p.adjust | Count |
| GO:004800220 | Esophagus | ESCC | antigen processing and presentation of peptide antigen | 44/8552 | 62/18723 | 4.81e-05 | 3.78e-04 | 44 |
| GO:001988225 | Esophagus | ESCC | antigen processing and presentation | 67/8552 | 106/18723 | 2.03e-04 | 1.28e-03 | 67 |
| GO:000247418 | Esophagus | ESCC | antigen processing and presentation of peptide antigen via MHC class I | 22/8552 | 28/18723 | 3.95e-04 | 2.26e-03 | 22 |
| GO:000248325 | Esophagus | ESCC | antigen processing and presentation of endogenous peptide antigen | 16/8552 | 19/18723 | 6.45e-04 | 3.43e-03 | 16 |
| GO:001988519 | Esophagus | ESCC | antigen processing and presentation of endogenous peptide antigen via MHC class I | 14/8552 | 17/18723 | 2.22e-03 | 9.78e-03 | 14 |
| GO:0019883111 | Esophagus | ESCC | antigen processing and presentation of endogenous antigen | 18/8552 | 26/18723 | 1.32e-02 | 4.31e-02 | 18 |
| GO:001988212 | Liver | HCC | antigen processing and presentation | 65/7958 | 106/18723 | 7.06e-05 | 6.37e-04 | 65 |
| GO:000248312 | Liver | HCC | antigen processing and presentation of endogenous peptide antigen | 16/7958 | 19/18723 | 2.37e-04 | 1.79e-03 | 16 |
| GO:004800212 | Liver | HCC | antigen processing and presentation of peptide antigen | 40/7958 | 62/18723 | 3.84e-04 | 2.62e-03 | 40 |
| GO:000247411 | Liver | HCC | antigen processing and presentation of peptide antigen via MHC class I | 21/7958 | 28/18723 | 4.94e-04 | 3.23e-03 | 21 |
| GO:001988522 | Liver | HCC | antigen processing and presentation of endogenous peptide antigen via MHC class I | 14/7958 | 17/18723 | 9.39e-04 | 5.47e-03 | 14 |
| GO:001988312 | Liver | HCC | antigen processing and presentation of endogenous antigen | 18/7958 | 26/18723 | 5.37e-03 | 2.24e-02 | 18 |
| GO:001988220 | Oral cavity | OSCC | antigen processing and presentation | 65/7305 | 106/18723 | 2.69e-06 | 3.32e-05 | 65 |
| GO:004800219 | Oral cavity | OSCC | antigen processing and presentation of peptide antigen | 40/7305 | 62/18723 | 4.20e-05 | 3.63e-04 | 40 |
| GO:000247416 | Oral cavity | OSCC | antigen processing and presentation of peptide antigen via MHC class I | 21/7305 | 28/18723 | 1.19e-04 | 8.54e-04 | 21 |
| GO:000248320 | Oral cavity | OSCC | antigen processing and presentation of endogenous peptide antigen | 15/7305 | 19/18723 | 4.64e-04 | 2.76e-03 | 15 |
| GO:001988517 | Oral cavity | OSCC | antigen processing and presentation of endogenous peptide antigen via MHC class I | 13/7305 | 17/18723 | 1.92e-03 | 8.94e-03 | 13 |
| GO:001988319 | Oral cavity | OSCC | antigen processing and presentation of endogenous antigen | 17/7305 | 26/18723 | 5.83e-03 | 2.23e-02 | 17 |
| GO:0019882110 | Oral cavity | LP | antigen processing and presentation | 48/4623 | 106/18723 | 2.96e-06 | 6.44e-05 | 48 |
| GO:0048002110 | Oral cavity | LP | antigen processing and presentation of peptide antigen | 30/4623 | 62/18723 | 4.46e-05 | 6.35e-04 | 30 |
| Hugo Symbol | Variant Class | Variant Classification | dbSNP RS | HGVSc | HGVSp | HGVSp Short | SWISSPROT | BIOTYPE | SIFT | PolyPhen | Tumor Sample Barcode | Tissue | Histology | Sex | Age | Stage | Therapy Types | Drugs | Outcome |
| ERAP2 | SNV | Missense_Mutation | | c.1480N>T | p.Asp494Tyr | p.D494Y | Q6P179 | protein_coding | deleterious(0) | probably_damaging(0.945) | TCGA-A8-A06P-01 | Breast | breast invasive carcinoma | Female | <65 | III/IV | Unspecific | | SD |
| ERAP2 | SNV | Missense_Mutation | | c.1726N>C | p.Glu576Gln | p.E576Q | Q6P179 | protein_coding | tolerated(0.22) | benign(0.017) | TCGA-AC-A23H-01 | Breast | breast invasive carcinoma | Female | >=65 | I/II | Unknown | Unknown | PD |
| ERAP2 | SNV | Missense_Mutation | rs113436741 | c.1666N>A | p.Gly556Arg | p.G556R | Q6P179 | protein_coding | deleterious(0.01) | benign(0.379) | TCGA-AO-A0J9-01 | Breast | breast invasive carcinoma | Female | <65 | III/IV | Chemotherapy | cyclophosphamide | PD |
| ERAP2 | SNV | Missense_Mutation | novel | c.2123N>G | p.His708Arg | p.H708R | Q6P179 | protein_coding | tolerated(0.62) | benign(0) | TCGA-AR-A2LR-01 | Breast | breast invasive carcinoma | Female | <65 | I/II | Chemotherapy | adriamycin | SD |
| ERAP2 | SNV | Missense_Mutation | | c.367N>G | p.Gln123Glu | p.Q123E | Q6P179 | protein_coding | tolerated(1) | benign(0.001) | TCGA-E2-A1LG-01 | Breast | breast invasive carcinoma | Female | <65 | I/II | Chemotherapy | doxorubicin | SD |
| ERAP2 | SNV | Missense_Mutation | novel | c.1690G>C | p.Glu564Gln | p.E564Q | Q6P179 | protein_coding | deleterious(0.01) | benign(0.342) | TCGA-GM-A3NW-01 | Breast | breast invasive carcinoma | Female | <65 | I/II | Chemotherapy | fluorouracil | SD |
| ERAP2 | SNV | Missense_Mutation | novel | c.1343A>C | p.Glu448Ala | p.E448A | Q6P179 | protein_coding | deleterious(0.01) | benign(0.401) | TCGA-2W-A8YY-01 | Cervix | cervical & endocervical cancer | Female | <65 | I/II | Chemotherapy | cisplatin | CR |
| ERAP2 | SNV | Missense_Mutation | rs199653916 | c.2550N>G | p.Ile850Met | p.I850M | Q6P179 | protein_coding | tolerated(0.08) | possibly_damaging(0.899) | TCGA-IR-A3LF-01 | Cervix | cervical & endocervical cancer | Female | <65 | I/II | Unknown | Unknown | SD |
| ERAP2 | SNV | Missense_Mutation | novel | c.2871N>A | p.Met957Ile | p.M957I | Q6P179 | protein_coding | tolerated(0.12) | benign(0) | TCGA-ZJ-AB0H-01 | Cervix | cervical & endocervical cancer | Female | <65 | III/IV | Unknown | Unknown | SD |
| ERAP2 | SNV | Missense_Mutation | | c.1115T>C | p.Leu372Pro | p.L372P | Q6P179 | protein_coding | deleterious(0) | probably_damaging(0.932) | TCGA-A6-5661-01 | Colorectum | colon adenocarcinoma | Female | >=65 | I/II | Unknown | Unknown | SD |
| Entrez ID | Symbol | Category | Interaction Types | Drug Claim Name | Drug Name | PMIDs |
| 64167 | ERAP2 | DRUGGABLE GENOME, PROTEASE, ENZYME, NEUTRAL ZINC METALLOPEPTIDASE | inhibitor | 348353642 | | |
| 64167 | ERAP2 | DRUGGABLE GENOME, PROTEASE, ENZYME, NEUTRAL ZINC METALLOPEPTIDASE | inhibitor | 252166866 | | |
| 64167 | ERAP2 | DRUGGABLE GENOME, PROTEASE, ENZYME, NEUTRAL ZINC METALLOPEPTIDASE | | ESCULETIN | ESCULETIN | |
| 64167 | ERAP2 | DRUGGABLE GENOME, PROTEASE, ENZYME, NEUTRAL ZINC METALLOPEPTIDASE | inhibitor | 348353641 | | |
| 64167 | ERAP2 | DRUGGABLE GENOME, PROTEASE, ENZYME, NEUTRAL ZINC METALLOPEPTIDASE | inhibitor | CHEMBL2103847 | TOSEDOSTAT | |
| 64167 | ERAP2 | DRUGGABLE GENOME, PROTEASE, ENZYME, NEUTRAL ZINC METALLOPEPTIDASE | | SCOPOLETIN | SCOPOLETIN | |


