Schematic overview of the cellular and molecular mechanisms involved in the cancer progression, including the proposed cellular and molecular mechanisms in cancer cells trajectory. AT1: alveolar type 1 cells; AT2: alveolar type 2 cells; AAH: atypical adenomatous hyperplasia; AIS: adenocarcinoma in situ; MIA: minimally invasive adenocarcinoma; IA: invasive adenocarcinoma; EMT: epithelial-mesenchymal transition

Home

Download

Statistics

Help

Contact

Center for Computational Systems Medicine
leaf

Gene summary

leaf

Malignant transformation analysis

leaf

Malignant transformation related pathway analysis

leaf

Cell-cell communication analysis

leaf

Single-cell gene regulatory network inference analysis

leaf

Somatic mutation of malignant transformation related genes

leaf

Related drugs of malignant transformation related genes

Gene: ERAL1

Gene summary for ERAL1

check button Gene summary.

Gene informationSpeciesHuman
Gene symbol

ERAL1

Gene ID

26284

Gene nameEra like 12S mitochondrial rRNA chaperone 1
Gene AliasCEGA
Cytomap17q11.2
Gene Typeprotein-coding
GO ID

GO:0000028

UniProtAcc

O75616


Top

Malignant transformation analysis

check button Identification of the aberrant gene expression in precancerous and cancerous lesions by comparing the gene expression of stem-like cells in diseased tissues with normal stem cells
check button Malignant transformation involving gene list.
Entrez IDSymbolReplicatesSpeciesOrganTissueAdj P-valueLog2FCMalignancy
26284ERAL1HTA11_2487_2000001011HumanColorectumSER1.61e-021.61e-01-0.1808
26284ERAL1HTA11_1938_2000001011HumanColorectumAD1.14e-042.42e-01-0.0811
26284ERAL1HTA11_347_2000001011HumanColorectumAD1.35e-062.03e-01-0.1954
26284ERAL1HTA11_3361_2000001011HumanColorectumAD3.85e-022.01e-01-0.1207
26284ERAL1HTA11_696_2000001011HumanColorectumAD4.57e-032.05e-01-0.1464
26284ERAL1HTA11_1391_2000001011HumanColorectumAD8.40e-042.64e-01-0.059
26284ERAL1HTA11_866_3004761011HumanColorectumAD3.26e-041.83e-010.096
26284ERAL1HTA11_10711_2000001011HumanColorectumAD5.10e-032.57e-010.0338
26284ERAL1HTA11_7696_3000711011HumanColorectumAD2.09e-032.27e-010.0674
26284ERAL1HTA11_99999970781_79442HumanColorectumMSS3.79e-031.82e-010.294
26284ERAL1HTA11_99999971662_82457HumanColorectumMSS5.61e-063.25e-010.3859
26284ERAL1HTA11_99999973899_84307HumanColorectumMSS6.77e-031.96e-010.2585
26284ERAL1HTA11_99999974143_84620HumanColorectumMSS7.47e-103.19e-010.3005
26284ERAL1LZE4THumanEsophagusESCC3.14e-063.57e-010.0811
26284ERAL1LZE5THumanEsophagusESCC5.24e-034.07e-010.0514
26284ERAL1LZE7THumanEsophagusESCC4.17e-064.33e-010.0667
26284ERAL1LZE8THumanEsophagusESCC5.78e-123.75e-010.067
26284ERAL1LZE20THumanEsophagusESCC1.82e-059.48e-020.0662
26284ERAL1LZE24THumanEsophagusESCC8.61e-206.88e-010.0596
26284ERAL1LZE21THumanEsophagusESCC4.02e-045.99e-010.0655
Page: 1 2 3 4 5 6 

check button Transcriptomic changes along malignancy continuum.
TissueExpression DynamicsAbbreviation
Colorectum (GSE201348)The image shows the transcriptomic changes along malignancy continuum.log2FC in expression of this searched gene in stem-like cells from each diseased tissue sample relative to stem-like cells in normal samples in each tissue plotted against the malignancy continuum. Samples are colored based on if they are from different disease stage.FAP: Familial adenomatous polyposis
CRC: Colorectal cancer
Colorectum (HTA11)The image shows the transcriptomic changes along malignancy continuum.log2FC in expression of this searched gene in stem-like cells from each diseased tissue sample relative to stem-like cells in normal samples in each tissue plotted against the malignancy continuum. Samples are colored based on if they are from different disease stage.AD: Adenomas
SER: Sessile serrated lesions
MSI-H: Microsatellite-high colorectal cancer
MSS: Microsatellite stable colorectal cancer
EsophagusThe image shows the transcriptomic changes along malignancy continuum.log2FC in expression of this searched gene in stem-like cells from each diseased tissue sample relative to stem-like cells in normal samples in each tissue plotted against the malignancy continuum. Samples are colored based on if they are from different disease stage.
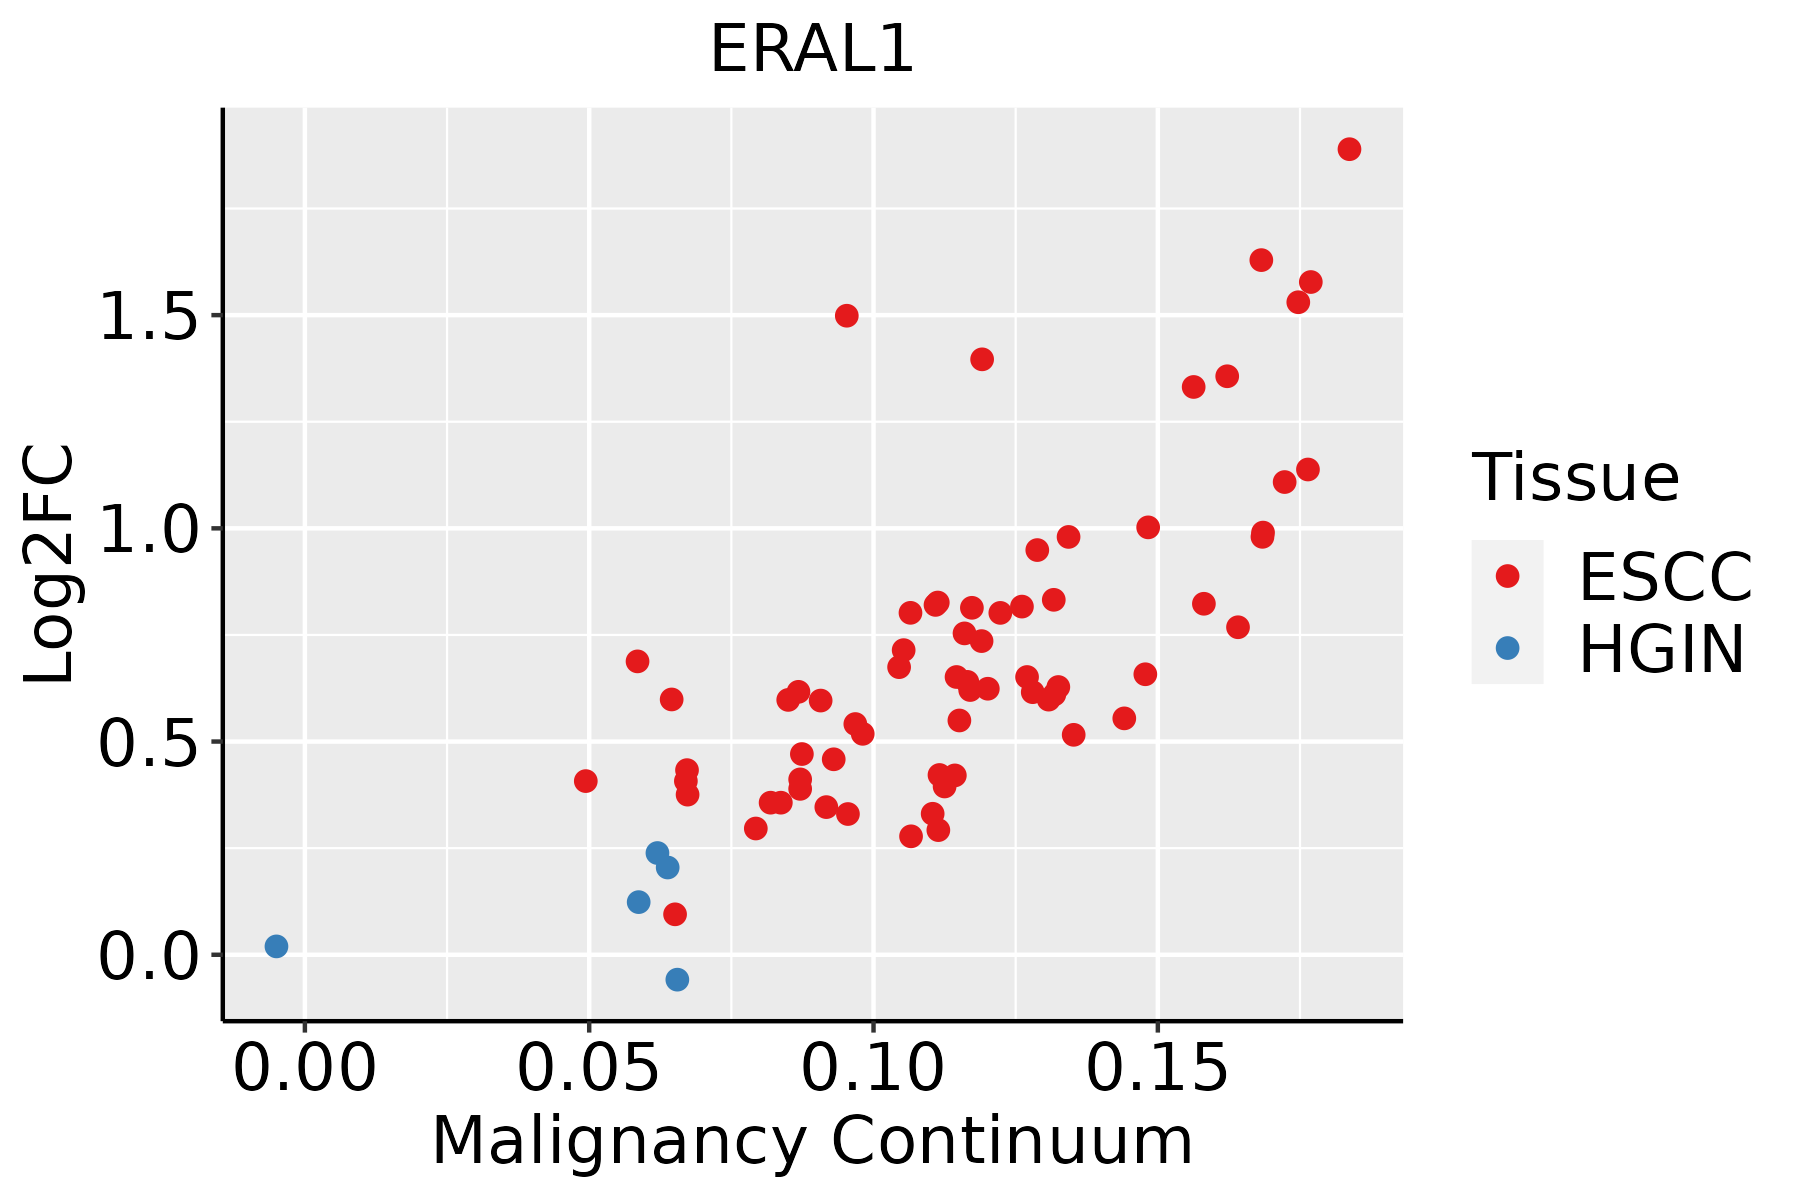
ESCC: Esophageal squamous cell carcinoma
HGIN: High-grade intraepithelial neoplasias
LGIN: Low-grade intraepithelial neoplasias
LiverThe image shows the transcriptomic changes along malignancy continuum.log2FC in expression of this searched gene in stem-like cells from each diseased tissue sample relative to stem-like cells in normal samples in each tissue plotted against the malignancy continuum. Samples are colored based on if they are from different disease stage.
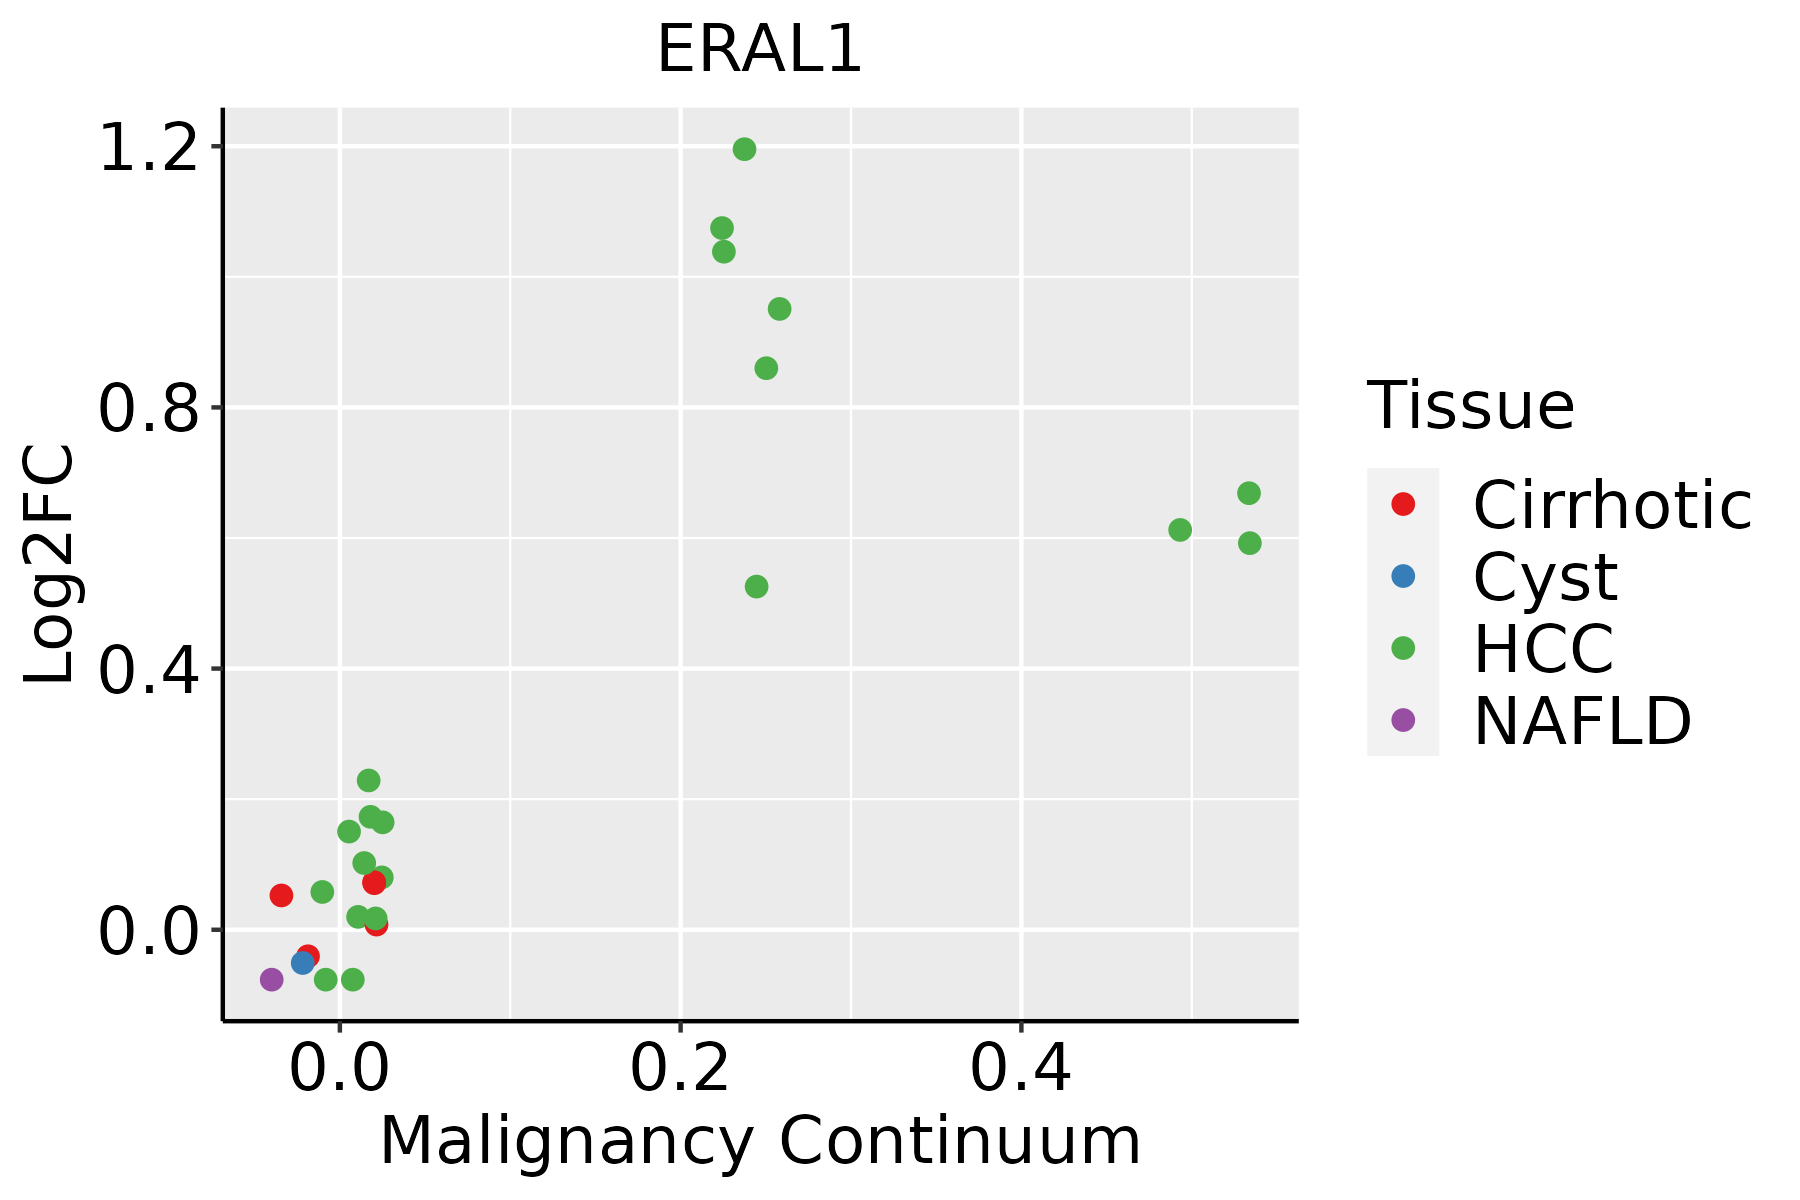
HCC: Hepatocellular carcinoma
NAFLD: Non-alcoholic fatty liver disease
Oral CavityThe image shows the transcriptomic changes along malignancy continuum.log2FC in expression of this searched gene in stem-like cells from each diseased tissue sample relative to stem-like cells in normal samples in each tissue plotted against the malignancy continuum. Samples are colored based on if they are from different disease stage.
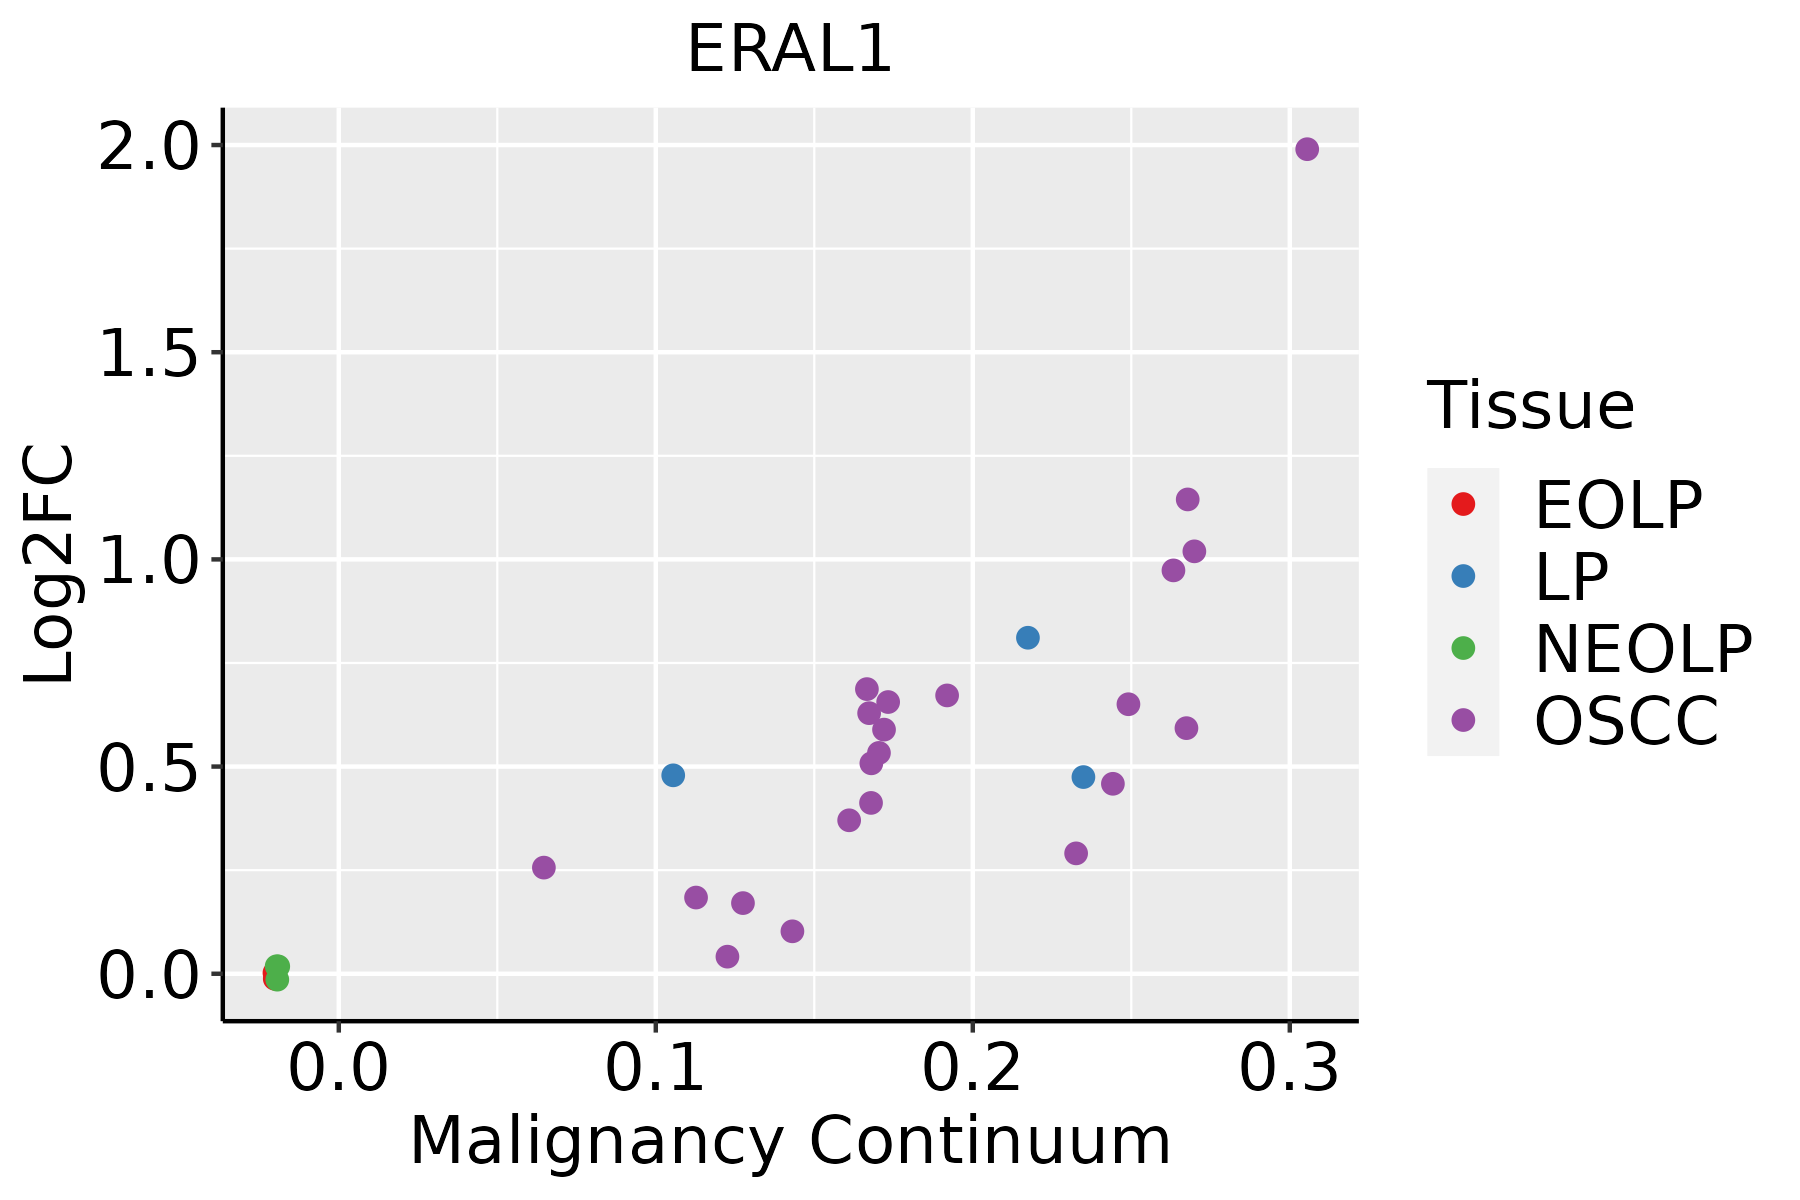
EOLP: Erosive Oral lichen planus
LP: leukoplakia
NEOLP: Non-erosive oral lichen planus
OSCC: Oral squamous cell carcinoma
SkinThe image shows the transcriptomic changes along malignancy continuum.log2FC in expression of this searched gene in stem-like cells from each diseased tissue sample relative to stem-like cells in normal samples in each tissue plotted against the malignancy continuum. Samples are colored based on if they are from different disease stage.
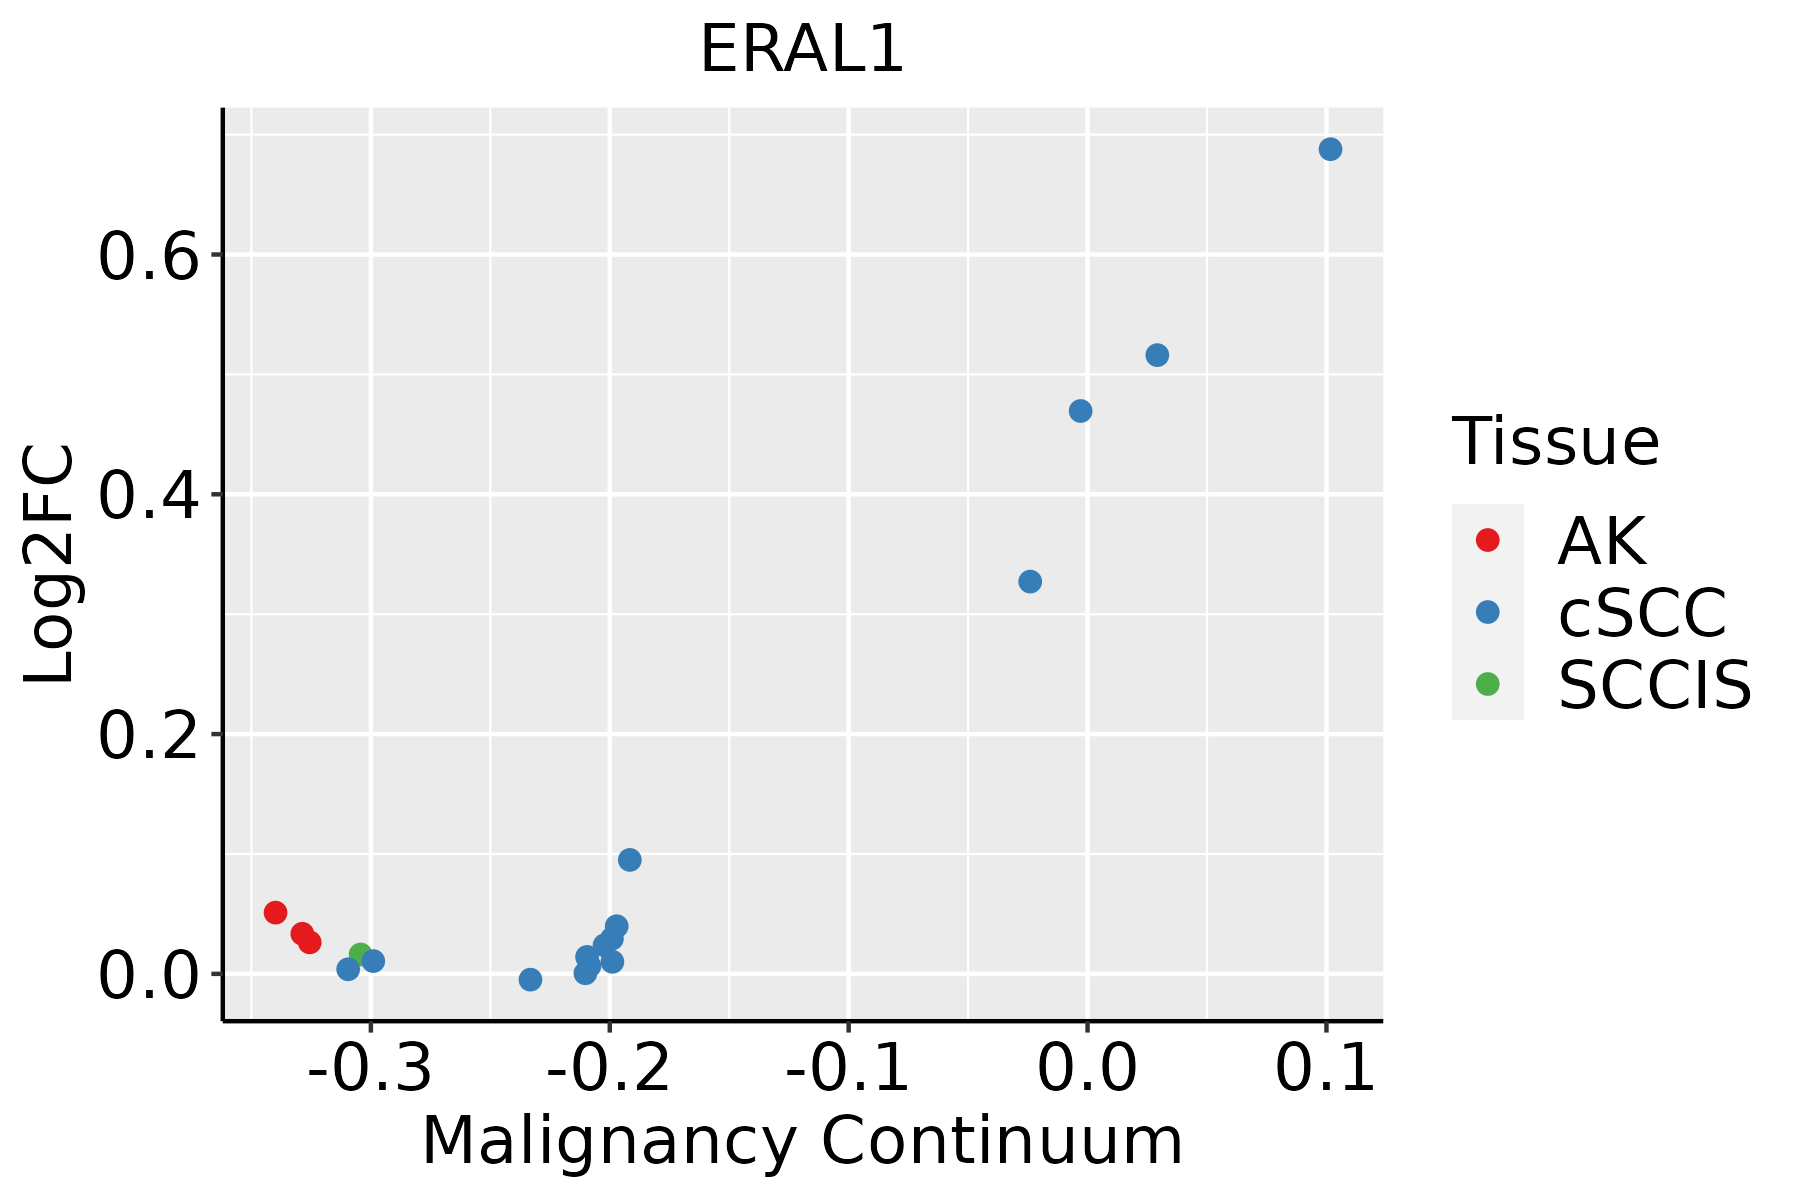
AK: Actinic keratosis
cSCC: Cutaneous squamous cell carcinoma
SCCIS:squamous cell carcinoma in situ
∗log2FC in expression of this searched gene in stem-like cells from each diseased tissue sample relative to stem-like cells in normal samples in each tissue plotted against the malignancy continuum. Samples are colored based on if they are from different disease stage.

Top

Malignant transformation related pathway analysis

check buttonFind out the enriched GO biological processes and KEGG pathways involved in transition from healthy to precancer to cancer
check button Figure of enriched GO biological processes.
TissueDisease StageEnriched GO biological Processes
ColorectumADGO analysis - Figure of enriched GO biological processes: Top 15 enriched GO BP terms are showed in the bar plot of each disease state in each tissue. Each row represents a significant GO biological process which is colored according to the -log10(p.adjust).
ColorectumSERGO analysis - Figure of enriched GO biological processes: Top 15 enriched GO BP terms are showed in the bar plot of each disease state in each tissue. Each row represents a significant GO biological process which is colored according to the -log10(p.adjust).
ColorectumMSSGO analysis - Figure of enriched GO biological processes: Top 15 enriched GO BP terms are showed in the bar plot of each disease state in each tissue. Each row represents a significant GO biological process which is colored according to the -log10(p.adjust).
ColorectumMSI-HGO analysis - Figure of enriched GO biological processes: Top 15 enriched GO BP terms are showed in the bar plot of each disease state in each tissue. Each row represents a significant GO biological process which is colored according to the -log10(p.adjust).
ColorectumFAPGO analysis - Figure of enriched GO biological processes: Top 15 enriched GO BP terms are showed in the bar plot of each disease state in each tissue. Each row represents a significant GO biological process which is colored according to the -log10(p.adjust).
∗Top 15 enriched GO BP terms are showed in the bar plot of each disease state in each tissue. Each row represents a significant GO biological process which is colored according to the -log10(p.adjust).
Page: 1 2 3 4 5 6 7 8 9 

check button Enriched GO biological processes.
GO IDTissueDisease StageDescriptionGene RatioBg Ratiopvaluep.adjustCount
GO:0022618ColorectumADribonucleoprotein complex assembly92/3918220/187231.49e-122.60e-1092
GO:0071826ColorectumADribonucleoprotein complex subunit organization94/3918227/187231.70e-122.87e-1094
GO:0022613ColorectumADribonucleoprotein complex biogenesis151/3918463/187231.96e-091.39e-07151
GO:0042255ColorectumADribosome assembly28/391861/187231.08e-052.47e-0428
GO:0000028ColorectumADribosomal small subunit assembly11/391819/187234.66e-045.15e-0311
GO:0042254ColorectumADribosome biogenesis84/3918299/187231.82e-031.50e-0284
GO:0042274ColorectumADribosomal small subunit biogenesis25/391873/187235.69e-033.64e-0225
GO:00226181ColorectumSERribonucleoprotein complex assembly69/2897220/187232.25e-092.15e-0769
GO:00718261ColorectumSERribonucleoprotein complex subunit organization70/2897227/187233.83e-093.51e-0770
GO:00226131ColorectumSERribonucleoprotein complex biogenesis112/2897463/187235.01e-072.48e-05112
GO:00422551ColorectumSERribosome assembly25/289761/187231.44e-066.55e-0525
GO:00000281ColorectumSERribosomal small subunit assembly10/289719/187231.86e-043.43e-0310
GO:00422741ColorectumSERribosomal small subunit biogenesis23/289773/187234.50e-046.57e-0323
GO:00422541ColorectumSERribosome biogenesis66/2897299/187231.48e-031.60e-0266
GO:00718262ColorectumMSSribonucleoprotein complex subunit organization90/3467227/187236.88e-141.78e-1190
GO:00226182ColorectumMSSribonucleoprotein complex assembly88/3467220/187237.12e-141.78e-1188
GO:00226132ColorectumMSSribonucleoprotein complex biogenesis144/3467463/187232.76e-113.67e-09144
GO:00422552ColorectumMSSribosome assembly26/346761/187231.15e-052.71e-0426
GO:00422542ColorectumMSSribosome biogenesis79/3467299/187234.32e-045.23e-0379
GO:00000282ColorectumMSSribosomal small subunit assembly10/346719/187238.39e-048.68e-0310
Page: 1 2 3 4 

check button Enriched KEGG pathways.
Pathway IDTissueDisease StageDescriptionGene RatioBg Ratiopvaluep.adjustqvalueCount
Page: 1 

Top

Cell-cell communication analysis

check buttonIdentification of potential cell-cell interactions between two cell types and their ligand-receptor pairs for different disease states
LigandReceptorLRpairPathwayTissueDisease Stage
Page: 1 

Top

Single-cell gene regulatory network inference analysis

check buttonFind out the significant the regulons (TFs) and the target genes of each regulon across cell types for different disease states
TFCell TypeTissueDisease StageTarget GeneRSSRegulon Activity
∗The dot plots of a searched regulon are shown for all cell subpopulations in each disease state of each tissue based on the regulon specific score inferred using pySCENIC and by calculating the average expression.
Page: 1 

Top

Somatic mutation of malignant transformation related genes

check buttonAnnotation of somatic variants for genes involved in malignant transformation
Hugo SymbolVariant ClassVariant ClassificationdbSNP RSHGVScHGVSpHGVSp ShortSWISSPROTBIOTYPESIFTPolyPhenTumor Sample BarcodeTissueHistologySexAgeStageTherapy TypesDrugsOutcome
ERAL1SNVMissense_Mutationc.554N>Tp.Ser185Phep.S185FO75616protein_codingdeleterious(0)probably_damaging(0.995)TCGA-BH-A0DZ-01Breastbreast invasive carcinomaFemale<65I/IIChemotherapydocetaxelSD
ERAL1SNVMissense_Mutationnovelc.281N>Cp.Arg94Thrp.R94TO75616protein_codingtolerated(0.05)benign(0.118)TCGA-C8-A1HM-01Breastbreast invasive carcinomaFemale>=65I/IIChemotherapydoxorubicinCR
ERAL1insertionIn_Frame_Insnovelc.1144_1145insCTTGTTCAATCGGTGTTAp.Glu382delinsAlaCysSerIleGlyValLysp.E382delinsACSIGVKO75616protein_codingTCGA-A8-A085-01Breastbreast invasive carcinomaMale<65I/IIHormone TherapytamoxiphenSD
ERAL1insertionIn_Frame_Insnovelc.272_273insGATTTCTGCTATTTGGCCTCATGGGAAATGTAGTCTTTTAGGAGAp.Ser91_Met92insIleSerAlaIleTrpProHisGlyLysCysSerLeuLeuGlyAspp.S91_M92insISAIWPHGKCSLLGDO75616protein_codingTCGA-A8-A08H-01Breastbreast invasive carcinomaFemale>=65I/IIUnknownUnknownSD
ERAL1insertionFrame_Shift_Insnovelc.214_215insCTTTTAGGAGACATGGCCAGAAGGGCCGTTTACAp.His72ProfsTer36p.H72Pfs*36O75616protein_codingTCGA-B6-A0IC-01Breastbreast invasive carcinomaFemale>=65I/IIUnknownUnknownSD
ERAL1insertionFrame_Shift_Insnovelc.222_223insTCTCCTACTCGCTp.Gly75SerfsTer26p.G75Sfs*26O75616protein_codingTCGA-BH-A0HW-01Breastbreast invasive carcinomaFemale<65I/IIChemotherapydoxorubicinSD
ERAL1SNVMissense_Mutationc.176C>Tp.Ser59Leup.S59LO75616protein_codingdeleterious_low_confidence(0.03)benign(0)TCGA-EK-A3GK-01Cervixcervical & endocervical cancerFemale<65I/IIUnknownUnknownSD
ERAL1SNVMissense_Mutationc.187N>Tp.Ser63Cysp.S63CO75616protein_codingtolerated_low_confidence(0.11)benign(0)TCGA-A6-3808-01Colorectumcolon adenocarcinomaMale>=65I/IIUnknownUnknownSD
ERAL1SNVMissense_Mutationc.931C>Ap.Leu311Ilep.L311IO75616protein_codingtolerated(0.13)benign(0.296)TCGA-AA-3715-01Colorectumcolon adenocarcinomaMale>=65I/IIUnknownUnknownPD
ERAL1SNVMissense_Mutationc.432G>Tp.Lys144Asnp.K144NO75616protein_codingdeleterious(0)probably_damaging(0.959)TCGA-AA-3975-01Colorectumcolon adenocarcinomaMale>=65I/IIUnknownUnknownSD
Page: 1 2 3 4 

Top

Related drugs of malignant transformation related genes

check buttonIdentification of chemicals and drugs interact with genes involved in malignant transfromation
(DGIdb 4.0)
Entrez IDSymbolCategoryInteraction TypesDrug Claim NameDrug NamePMIDs
Page: 1