
|
|||||
|
 | |
| |
| |
| |
| |
| |
|
Gene: EPS8L2 |
Gene summary for EPS8L2 |
| Gene information | Species | Human | Gene symbol | EPS8L2 | Gene ID | 64787 |
| Gene name | EPS8 like 2 | |
| Gene Alias | DFNB106 | |
| Cytomap | 11p15.5 | |
| Gene Type | protein-coding | GO ID | GO:0003008 | UniProtAcc | Q9H6S3 |
Top |
Malignant transformation analysis |
| Identification of the aberrant gene expression in precancerous and cancerous lesions by comparing the gene expression of stem-like cells in diseased tissues with normal stem cells |
| Entrez ID | Symbol | Replicates | Species | Organ | Tissue | Adj P-value | Log2FC | Malignancy |
| 64787 | EPS8L2 | LZE4T | Human | Esophagus | ESCC | 5.22e-13 | 1.88e-01 | 0.0811 |
| 64787 | EPS8L2 | LZE5T | Human | Esophagus | ESCC | 4.00e-06 | 4.59e-01 | 0.0514 |
| 64787 | EPS8L2 | LZE8T | Human | Esophagus | ESCC | 6.98e-13 | 2.60e-01 | 0.067 |
| 64787 | EPS8L2 | LZE20T | Human | Esophagus | ESCC | 3.72e-02 | 2.89e-01 | 0.0662 |
| 64787 | EPS8L2 | LZE22D1 | Human | Esophagus | HGIN | 5.18e-03 | 9.88e-02 | 0.0595 |
| 64787 | EPS8L2 | LZE22T | Human | Esophagus | ESCC | 2.49e-09 | 6.24e-01 | 0.068 |
| 64787 | EPS8L2 | LZE24T | Human | Esophagus | ESCC | 4.20e-09 | 4.77e-01 | 0.0596 |
| 64787 | EPS8L2 | LZE21T | Human | Esophagus | ESCC | 6.37e-07 | 2.36e-01 | 0.0655 |
| 64787 | EPS8L2 | P1T-E | Human | Esophagus | ESCC | 2.30e-08 | 7.85e-01 | 0.0875 |
| 64787 | EPS8L2 | P2T-E | Human | Esophagus | ESCC | 3.12e-22 | 4.72e-01 | 0.1177 |
| 64787 | EPS8L2 | P4T-E | Human | Esophagus | ESCC | 1.82e-09 | 2.17e-01 | 0.1323 |
| 64787 | EPS8L2 | P5T-E | Human | Esophagus | ESCC | 1.02e-06 | 1.38e-02 | 0.1327 |
| 64787 | EPS8L2 | P8T-E | Human | Esophagus | ESCC | 8.11e-34 | 8.41e-01 | 0.0889 |
| 64787 | EPS8L2 | P9T-E | Human | Esophagus | ESCC | 6.14e-20 | 2.59e-01 | 0.1131 |
| 64787 | EPS8L2 | P10T-E | Human | Esophagus | ESCC | 2.41e-13 | 9.59e-02 | 0.116 |
| 64787 | EPS8L2 | P11T-E | Human | Esophagus | ESCC | 2.76e-10 | 9.31e-01 | 0.1426 |
| 64787 | EPS8L2 | P12T-E | Human | Esophagus | ESCC | 1.65e-18 | 3.78e-01 | 0.1122 |
| 64787 | EPS8L2 | P15T-E | Human | Esophagus | ESCC | 3.28e-22 | 6.16e-01 | 0.1149 |
| 64787 | EPS8L2 | P16T-E | Human | Esophagus | ESCC | 5.94e-12 | 2.06e-01 | 0.1153 |
| 64787 | EPS8L2 | P17T-E | Human | Esophagus | ESCC | 2.88e-10 | 9.06e-01 | 0.1278 |
| Page: 1 2 3 4 5 6 7 |
| Tissue | Expression Dynamics | Abbreviation |
| Esophagus | 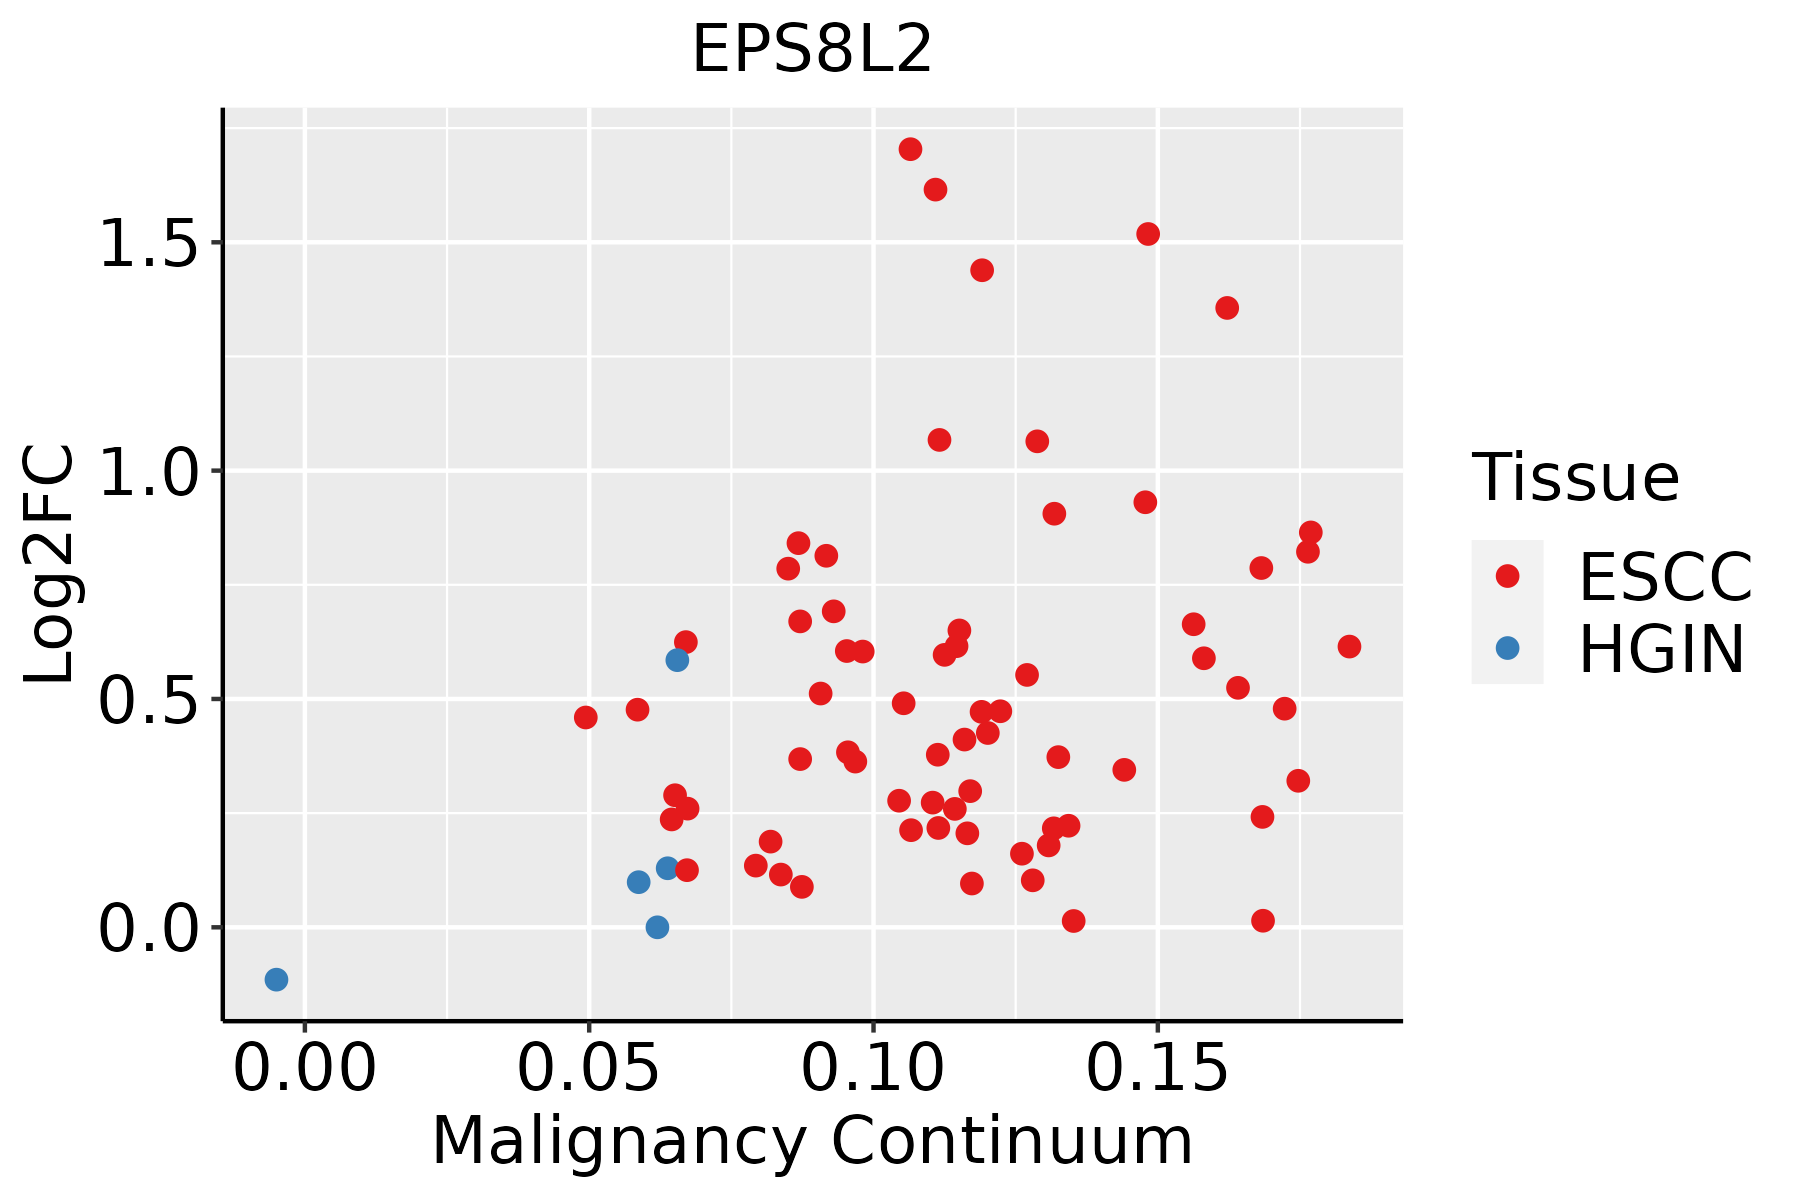 | ESCC: Esophageal squamous cell carcinoma |
| HGIN: High-grade intraepithelial neoplasias | ||
| LGIN: Low-grade intraepithelial neoplasias | ||
| GC |  | CAG: Chronic atrophic gastritis |
| CAG with IM: Chronic atrophic gastritis with intestinal metaplasia | ||
| CSG: Chronic superficial gastritis | ||
| GC: Gastric cancer | ||
| SIM: Severe intestinal metaplasia | ||
| WIM: Wild intestinal metaplasia | ||
| Liver | 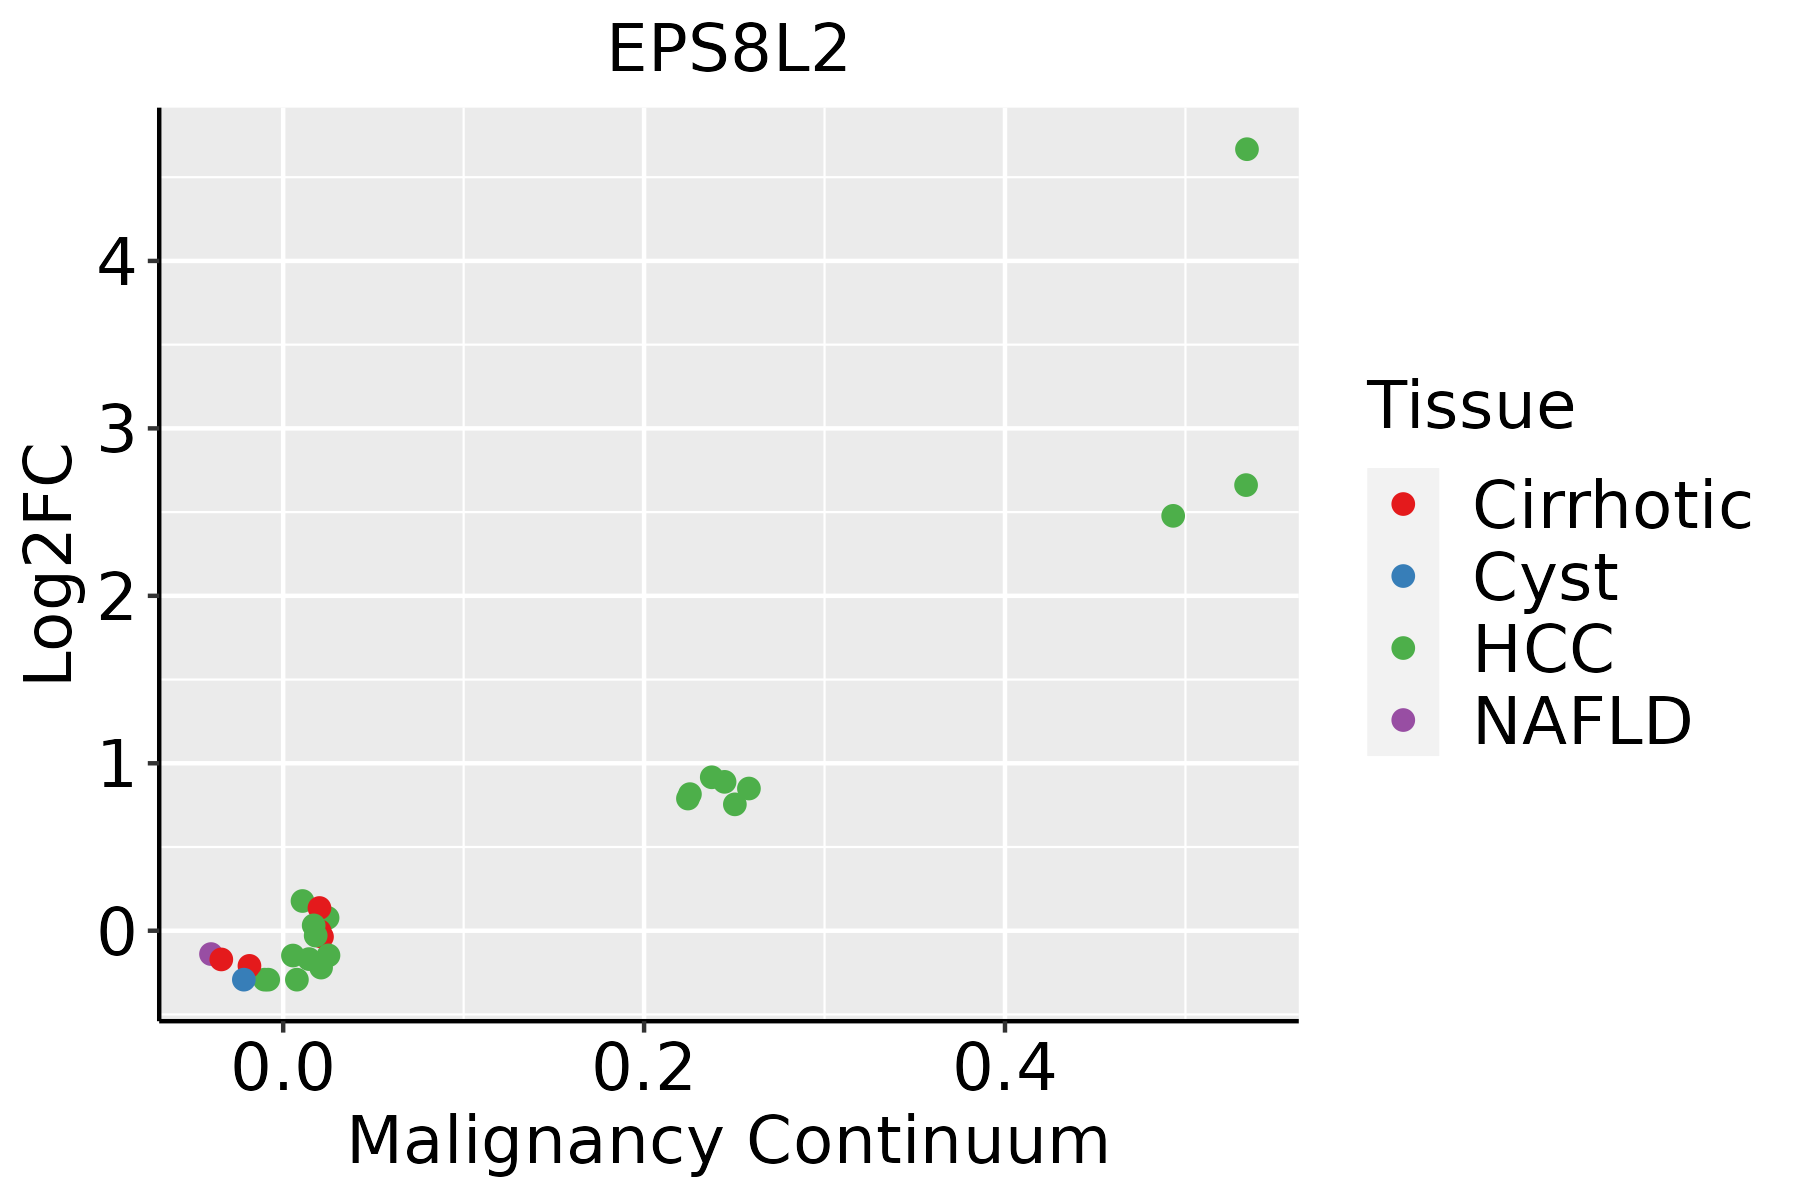 | HCC: Hepatocellular carcinoma |
| NAFLD: Non-alcoholic fatty liver disease | ||
| Oral Cavity | 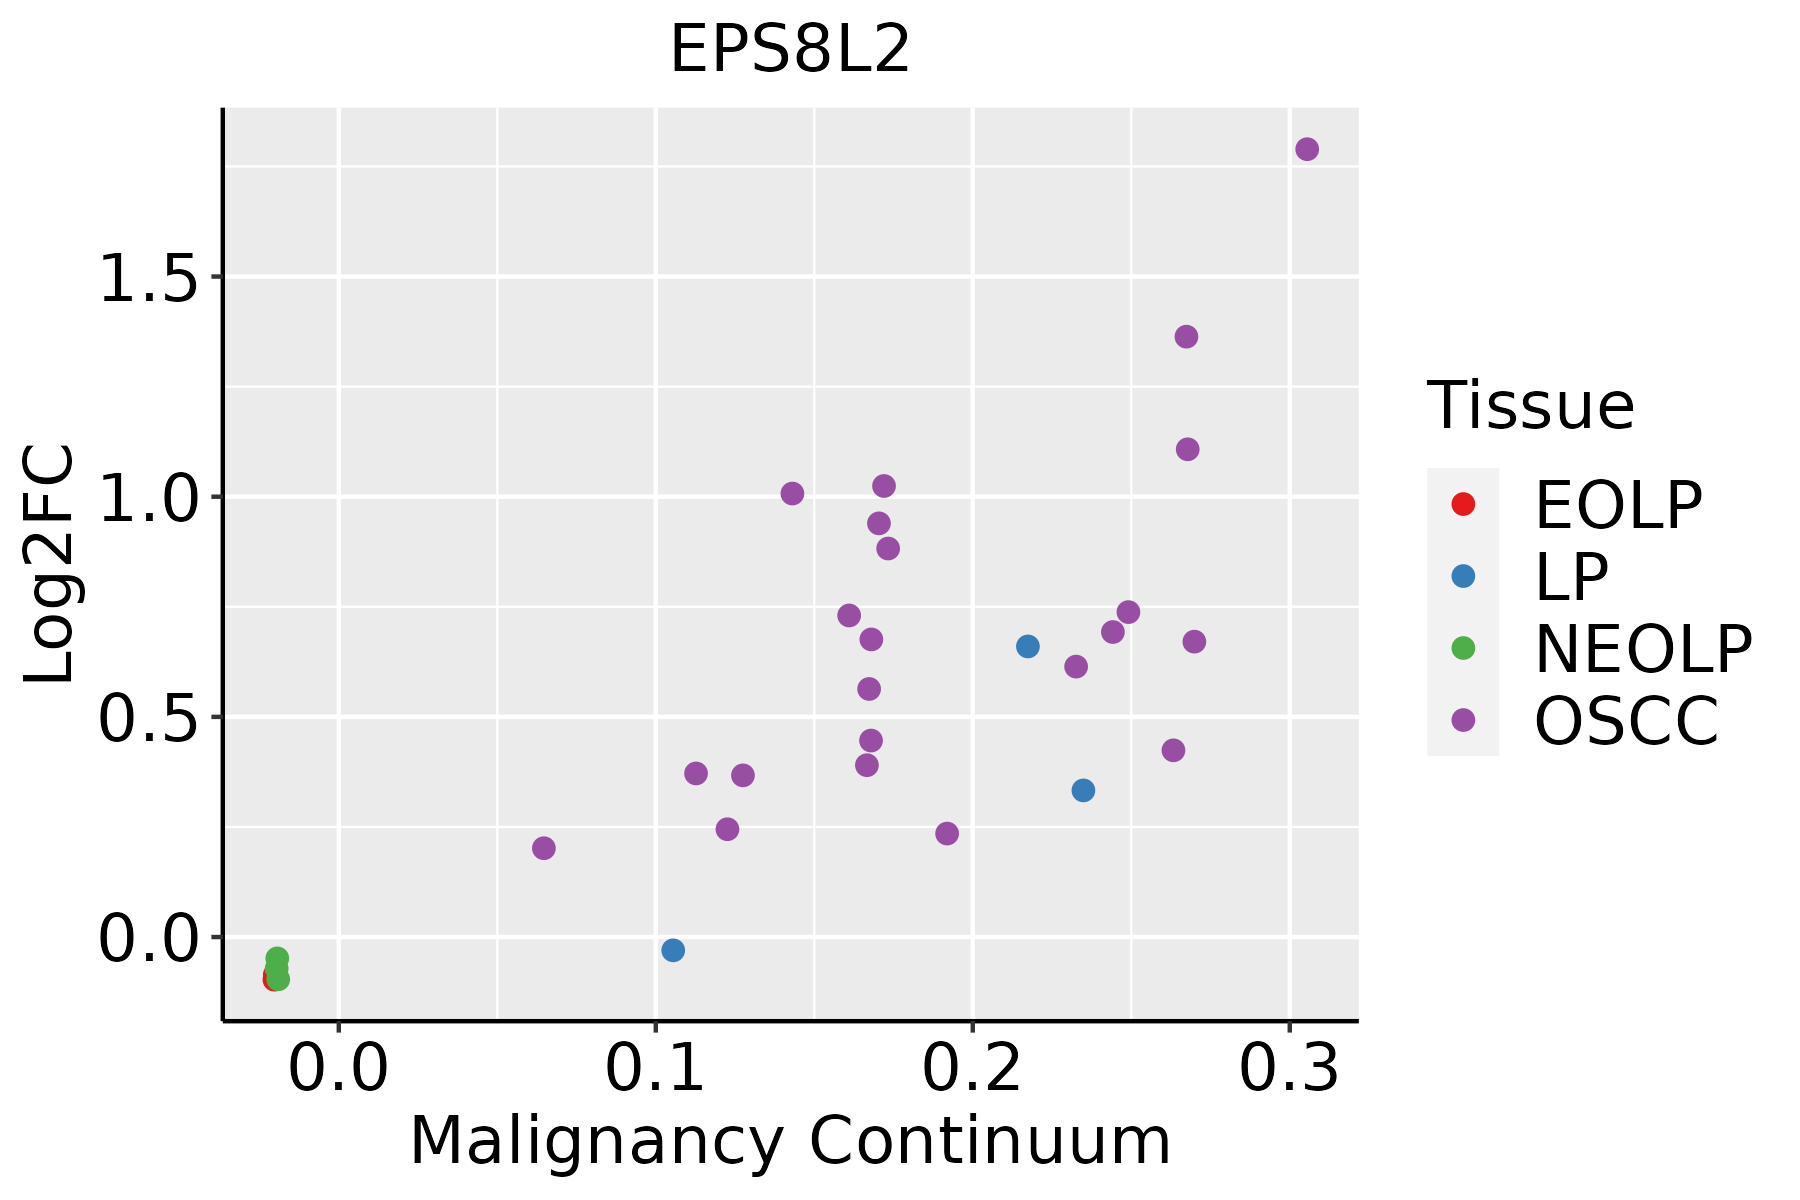 | EOLP: Erosive Oral lichen planus |
| LP: leukoplakia | ||
| NEOLP: Non-erosive oral lichen planus | ||
| OSCC: Oral squamous cell carcinoma | ||
| Skin |  | AK: Actinic keratosis |
| cSCC: Cutaneous squamous cell carcinoma | ||
| SCCIS:squamous cell carcinoma in situ | ||
| Thyroid |  | ATC: Anaplastic thyroid cancer |
| HT: Hashimoto's thyroiditis | ||
| PTC: Papillary thyroid cancer |
| ∗log2FC in expression of this searched gene in stem-like cells from each diseased tissue sample relative to stem-like cells in normal samples in each tissue plotted against the malignancy continuum. Samples are colored based on if they are from different disease stage. |
Top |
Malignant transformation related pathway analysis |
| Find out the enriched GO biological processes and KEGG pathways involved in transition from healthy to precancer to cancer |
| Tissue | Disease Stage | Enriched GO biological Processes |
| Colorectum | AD |  |
| Colorectum | SER |  |
| Colorectum | MSS |  |
| Colorectum | MSI-H |  |
| Colorectum | FAP |  |
| ∗Top 15 enriched GO BP terms are showed in the bar plot of each disease state in each tissue. Each row represents a significant GO biological process which is colored according to the -log10(p.adjust). |
| Page: 1 2 3 4 5 6 7 8 9 |
| GO ID | Tissue | Disease Stage | Description | Gene Ratio | Bg Ratio | pvalue | p.adjust | Count |
| GO:006049117 | Esophagus | HGIN | regulation of cell projection assembly | 39/2587 | 188/18723 | 5.61e-03 | 4.57e-02 | 39 |
| GO:000726510 | Esophagus | ESCC | Ras protein signal transduction | 201/8552 | 337/18723 | 1.44e-07 | 2.30e-06 | 201 |
| GO:003134616 | Esophagus | ESCC | positive regulation of cell projection organization | 201/8552 | 353/18723 | 1.19e-05 | 1.11e-04 | 201 |
| GO:00315299 | Esophagus | ESCC | ruffle organization | 39/8552 | 56/18723 | 2.44e-04 | 1.51e-03 | 39 |
| GO:00971789 | Esophagus | ESCC | ruffle assembly | 32/8552 | 44/18723 | 2.50e-04 | 1.54e-03 | 32 |
| GO:006049118 | Esophagus | ESCC | regulation of cell projection assembly | 110/8552 | 188/18723 | 2.60e-04 | 1.58e-03 | 110 |
| GO:012003218 | Esophagus | ESCC | regulation of plasma membrane bounded cell projection assembly | 108/8552 | 186/18723 | 4.37e-04 | 2.46e-03 | 108 |
| GO:000726610 | Esophagus | ESCC | Rho protein signal transduction | 81/8552 | 137/18723 | 1.03e-03 | 5.20e-03 | 81 |
| GO:01200347 | Esophagus | ESCC | positive regulation of plasma membrane bounded cell projection assembly | 64/8552 | 105/18723 | 1.15e-03 | 5.70e-03 | 64 |
| GO:00465789 | Esophagus | ESCC | regulation of Ras protein signal transduction | 106/8552 | 189/18723 | 2.49e-03 | 1.08e-02 | 106 |
| GO:19000277 | Esophagus | ESCC | regulation of ruffle assembly | 21/8552 | 31/18723 | 1.10e-02 | 3.70e-02 | 21 |
| GO:005105610 | Esophagus | ESCC | regulation of small GTPase mediated signal transduction | 157/8552 | 302/18723 | 1.55e-02 | 4.98e-02 | 157 |
| GO:000726511 | Liver | Cirrhotic | Ras protein signal transduction | 119/4634 | 337/18723 | 8.16e-06 | 1.22e-04 | 119 |
| GO:000726611 | Liver | Cirrhotic | Rho protein signal transduction | 53/4634 | 137/18723 | 2.05e-04 | 1.89e-03 | 53 |
| GO:00315294 | Liver | Cirrhotic | ruffle organization | 26/4634 | 56/18723 | 3.40e-04 | 2.91e-03 | 26 |
| GO:00971783 | Liver | Cirrhotic | ruffle assembly | 21/4634 | 44/18723 | 7.88e-04 | 5.79e-03 | 21 |
| GO:01200326 | Liver | Cirrhotic | regulation of plasma membrane bounded cell projection assembly | 63/4634 | 186/18723 | 3.16e-03 | 1.78e-02 | 63 |
| GO:19000273 | Liver | Cirrhotic | regulation of ruffle assembly | 15/4634 | 31/18723 | 3.68e-03 | 2.02e-02 | 15 |
| GO:00604915 | Liver | Cirrhotic | regulation of cell projection assembly | 63/4634 | 188/18723 | 4.17e-03 | 2.22e-02 | 63 |
| GO:003502311 | Liver | Cirrhotic | regulation of Rho protein signal transduction | 32/4634 | 86/18723 | 6.81e-03 | 3.35e-02 | 32 |
| Page: 1 2 3 4 5 |
| Pathway ID | Tissue | Disease Stage | Description | Gene Ratio | Bg Ratio | pvalue | p.adjust | qvalue | Count |
| Page: 1 |
Top |
Cell-cell communication analysis |
| Identification of potential cell-cell interactions between two cell types and their ligand-receptor pairs for different disease states |
| Ligand | Receptor | LRpair | Pathway | Tissue | Disease Stage |
| Page: 1 |
Top |
Single-cell gene regulatory network inference analysis |
| Find out the significant the regulons (TFs) and the target genes of each regulon across cell types for different disease states |
| TF | Cell Type | Tissue | Disease Stage | Target Gene | RSS | Regulon Activity |
| ∗The dot plots of a searched regulon are shown for all cell subpopulations in each disease state of each tissue based on the regulon specific score inferred using pySCENIC and by calculating the average expression. |
| Page: 1 |
Top |
Somatic mutation of malignant transformation related genes |
| Annotation of somatic variants for genes involved in malignant transformation |
| Hugo Symbol | Variant Class | Variant Classification | dbSNP RS | HGVSc | HGVSp | HGVSp Short | SWISSPROT | BIOTYPE | SIFT | PolyPhen | Tumor Sample Barcode | Tissue | Histology | Sex | Age | Stage | Therapy Types | Drugs | Outcome |
| EPS8L2 | SNV | Missense_Mutation | novel | c.1894N>A | p.Glu632Lys | p.E632K | Q9H6S3 | protein_coding | deleterious(0) | benign(0.148) | TCGA-AC-A2QI-01 | Breast | breast invasive carcinoma | Female | >=65 | III/IV | Chemotherapy | cytoxan | CR |
| EPS8L2 | SNV | Missense_Mutation | novel | c.830N>T | p.Ala277Val | p.A277V | Q9H6S3 | protein_coding | deleterious(0) | probably_damaging(0.935) | TCGA-2W-A8YY-01 | Cervix | cervical & endocervical cancer | Female | <65 | I/II | Chemotherapy | cisplatin | CR |
| EPS8L2 | SNV | Missense_Mutation | novel | c.971N>T | p.Ala324Val | p.A324V | Q9H6S3 | protein_coding | deleterious(0) | possibly_damaging(0.793) | TCGA-2W-A8YY-01 | Cervix | cervical & endocervical cancer | Female | <65 | I/II | Chemotherapy | cisplatin | CR |
| EPS8L2 | SNV | Missense_Mutation | c.19N>C | p.Val7Leu | p.V7L | Q9H6S3 | protein_coding | tolerated_low_confidence(0.46) | benign(0) | TCGA-DG-A2KK-01 | Cervix | cervical & endocervical cancer | Female | <65 | III/IV | Chemotherapy | cisplatin | SD | |
| EPS8L2 | deletion | Frame_Shift_Del | c.2137delG | p.Glu713ArgfsTer114 | p.E713Rfs*114 | Q9H6S3 | protein_coding | TCGA-EA-A410-01 | Cervix | cervical & endocervical cancer | Female | <65 | I/II | Unknown | Unknown | SD | |||
| EPS8L2 | SNV | Missense_Mutation | novel | c.775N>A | p.Leu259Ile | p.L259I | Q9H6S3 | protein_coding | deleterious(0) | probably_damaging(0.991) | TCGA-AA-A010-01 | Colorectum | colon adenocarcinoma | Female | <65 | I/II | Chemotherapy | folinic | CR |
| EPS8L2 | SNV | Missense_Mutation | rs369273038 | c.1072T>C | p.Cys358Arg | p.C358R | Q9H6S3 | protein_coding | deleterious(0) | possibly_damaging(0.598) | TCGA-AA-A01P-01 | Colorectum | colon adenocarcinoma | Female | >=65 | III/IV | Unknown | Unknown | PD |
| EPS8L2 | SNV | Missense_Mutation | rs558489382 | c.19N>A | p.Val7Met | p.V7M | Q9H6S3 | protein_coding | tolerated_low_confidence(0.32) | benign(0) | TCGA-AZ-4313-01 | Colorectum | colon adenocarcinoma | Female | <65 | I/II | Unknown | Unknown | SD |
| EPS8L2 | SNV | Missense_Mutation | c.799G>A | p.Glu267Lys | p.E267K | Q9H6S3 | protein_coding | deleterious(0) | probably_damaging(0.994) | TCGA-AZ-4315-01 | Colorectum | colon adenocarcinoma | Male | <65 | I/II | Unknown | Unknown | SD | |
| EPS8L2 | SNV | Missense_Mutation | c.258N>T | p.Lys86Asn | p.K86N | Q9H6S3 | protein_coding | deleterious(0) | possibly_damaging(0.812) | TCGA-AZ-6606-01 | Colorectum | colon adenocarcinoma | Male | >=65 | III/IV | Chemotherapy | folfiri | PD |
| Page: 1 2 3 4 5 |
Top |
Related drugs of malignant transformation related genes |
| Identification of chemicals and drugs interact with genes involved in malignant transfromation |
| (DGIdb 4.0) |
| Entrez ID | Symbol | Category | Interaction Types | Drug Claim Name | Drug Name | PMIDs |
| Page: 1 |

Copyright 2023-Present -The University of Texas Health Science Center at Houston |