
|
|||||
|
 | |
| |
| |
| |
| |
| |
|
Gene: EPS8L1 |
Gene summary for EPS8L1 |
| Gene information | Species | Human | Gene symbol | EPS8L1 | Gene ID | 54869 |
| Gene name | EPS8 like 1 | |
| Gene Alias | DRC3 | |
| Cytomap | 19q13.42 | |
| Gene Type | protein-coding | GO ID | GO:0007154 | UniProtAcc | Q8TE68 |
Top |
Malignant transformation analysis |
| Identification of the aberrant gene expression in precancerous and cancerous lesions by comparing the gene expression of stem-like cells in diseased tissues with normal stem cells |
| Entrez ID | Symbol | Replicates | Species | Organ | Tissue | Adj P-value | Log2FC | Malignancy |
| 54869 | EPS8L1 | AEH-subject1 | Human | Endometrium | AEH | 2.50e-14 | 5.42e-01 | -0.3059 |
| 54869 | EPS8L1 | AEH-subject2 | Human | Endometrium | AEH | 3.22e-25 | 6.80e-01 | -0.2525 |
| 54869 | EPS8L1 | EEC-subject2 | Human | Endometrium | EEC | 1.45e-13 | 5.24e-01 | -0.2607 |
| 54869 | EPS8L1 | EEC-subject5 | Human | Endometrium | EEC | 1.42e-03 | 2.48e-01 | -0.249 |
| 54869 | EPS8L1 | GSM6177622_NYU_UCEC3_lib1_lib1 | Human | Endometrium | EEC | 1.04e-04 | 1.85e-01 | -0.1917 |
| 54869 | EPS8L1 | GSM6177622_NYU_UCEC3_lib2_lib2 | Human | Endometrium | EEC | 2.05e-06 | 2.22e-01 | -0.1916 |
| 54869 | EPS8L1 | GSM6177623_NYU_UCEC3_Vis | Human | Endometrium | EEC | 6.46e-08 | 4.31e-01 | -0.1269 |
| 54869 | EPS8L1 | LZE5T | Human | Esophagus | ESCC | 4.95e-08 | 5.52e-01 | 0.0514 |
| 54869 | EPS8L1 | LZE20T | Human | Esophagus | ESCC | 3.11e-04 | 3.28e-01 | 0.0662 |
| 54869 | EPS8L1 | LZE24T | Human | Esophagus | ESCC | 3.21e-09 | 4.51e-01 | 0.0596 |
| 54869 | EPS8L1 | P1T-E | Human | Esophagus | ESCC | 8.95e-10 | 1.10e+00 | 0.0875 |
| 54869 | EPS8L1 | P5T-E | Human | Esophagus | ESCC | 1.78e-03 | 6.04e-02 | 0.1327 |
| 54869 | EPS8L1 | P8T-E | Human | Esophagus | ESCC | 4.66e-61 | 1.72e+00 | 0.0889 |
| 54869 | EPS8L1 | P17T-E | Human | Esophagus | ESCC | 4.92e-09 | 3.68e-01 | 0.1278 |
| 54869 | EPS8L1 | P21T-E | Human | Esophagus | ESCC | 9.35e-10 | 1.67e-01 | 0.1617 |
| 54869 | EPS8L1 | P23T-E | Human | Esophagus | ESCC | 1.72e-21 | 1.07e+00 | 0.108 |
| 54869 | EPS8L1 | P24T-E | Human | Esophagus | ESCC | 4.30e-10 | 2.18e-01 | 0.1287 |
| 54869 | EPS8L1 | P28T-E | Human | Esophagus | ESCC | 1.26e-04 | 8.70e-02 | 0.1149 |
| 54869 | EPS8L1 | P31T-E | Human | Esophagus | ESCC | 2.13e-02 | 2.04e-01 | 0.1251 |
| 54869 | EPS8L1 | P36T-E | Human | Esophagus | ESCC | 3.36e-04 | 2.22e-01 | 0.1187 |
| Page: 1 2 3 4 5 |
| Tissue | Expression Dynamics | Abbreviation |
| Endometrium |  | AEH: Atypical endometrial hyperplasia |
| EEC: Endometrioid Cancer | ||
| Esophagus | 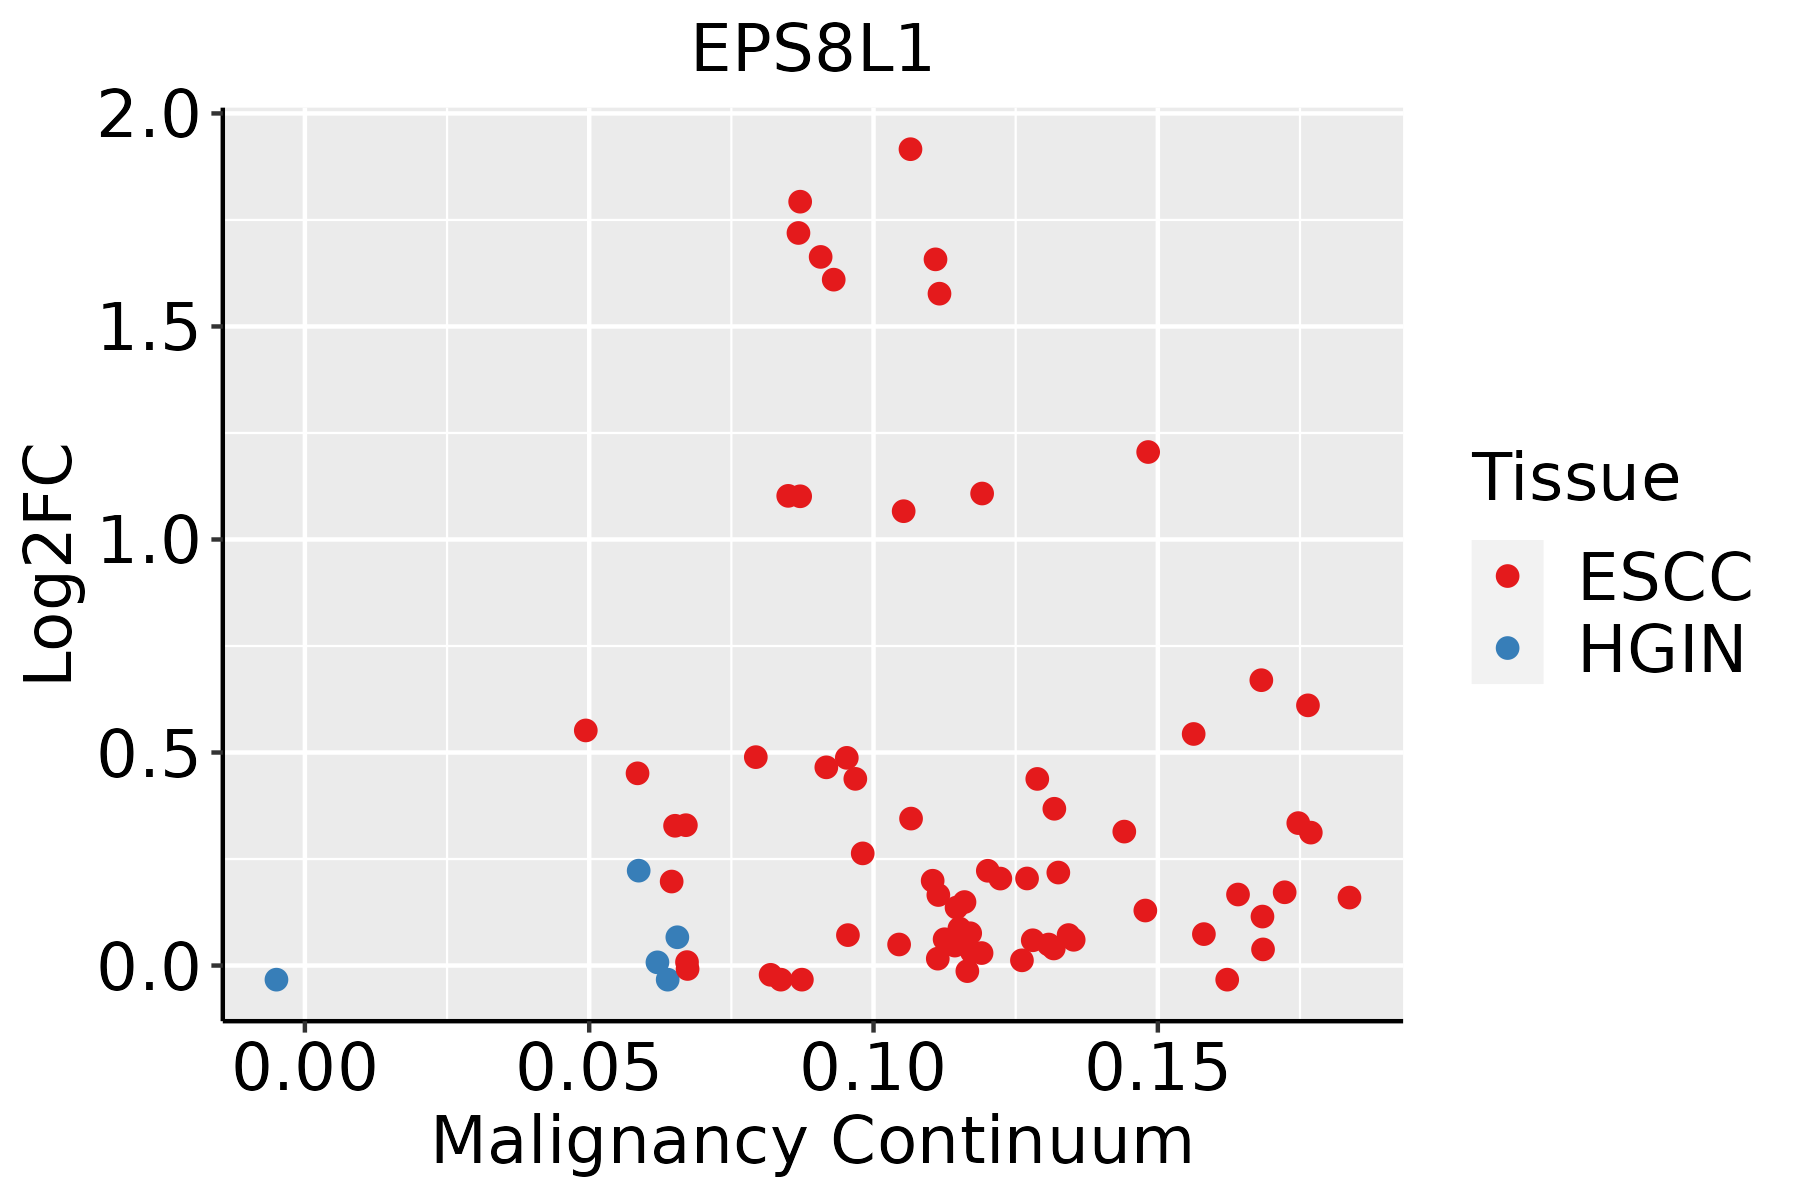 | ESCC: Esophageal squamous cell carcinoma |
| HGIN: High-grade intraepithelial neoplasias | ||
| LGIN: Low-grade intraepithelial neoplasias | ||
| GC | 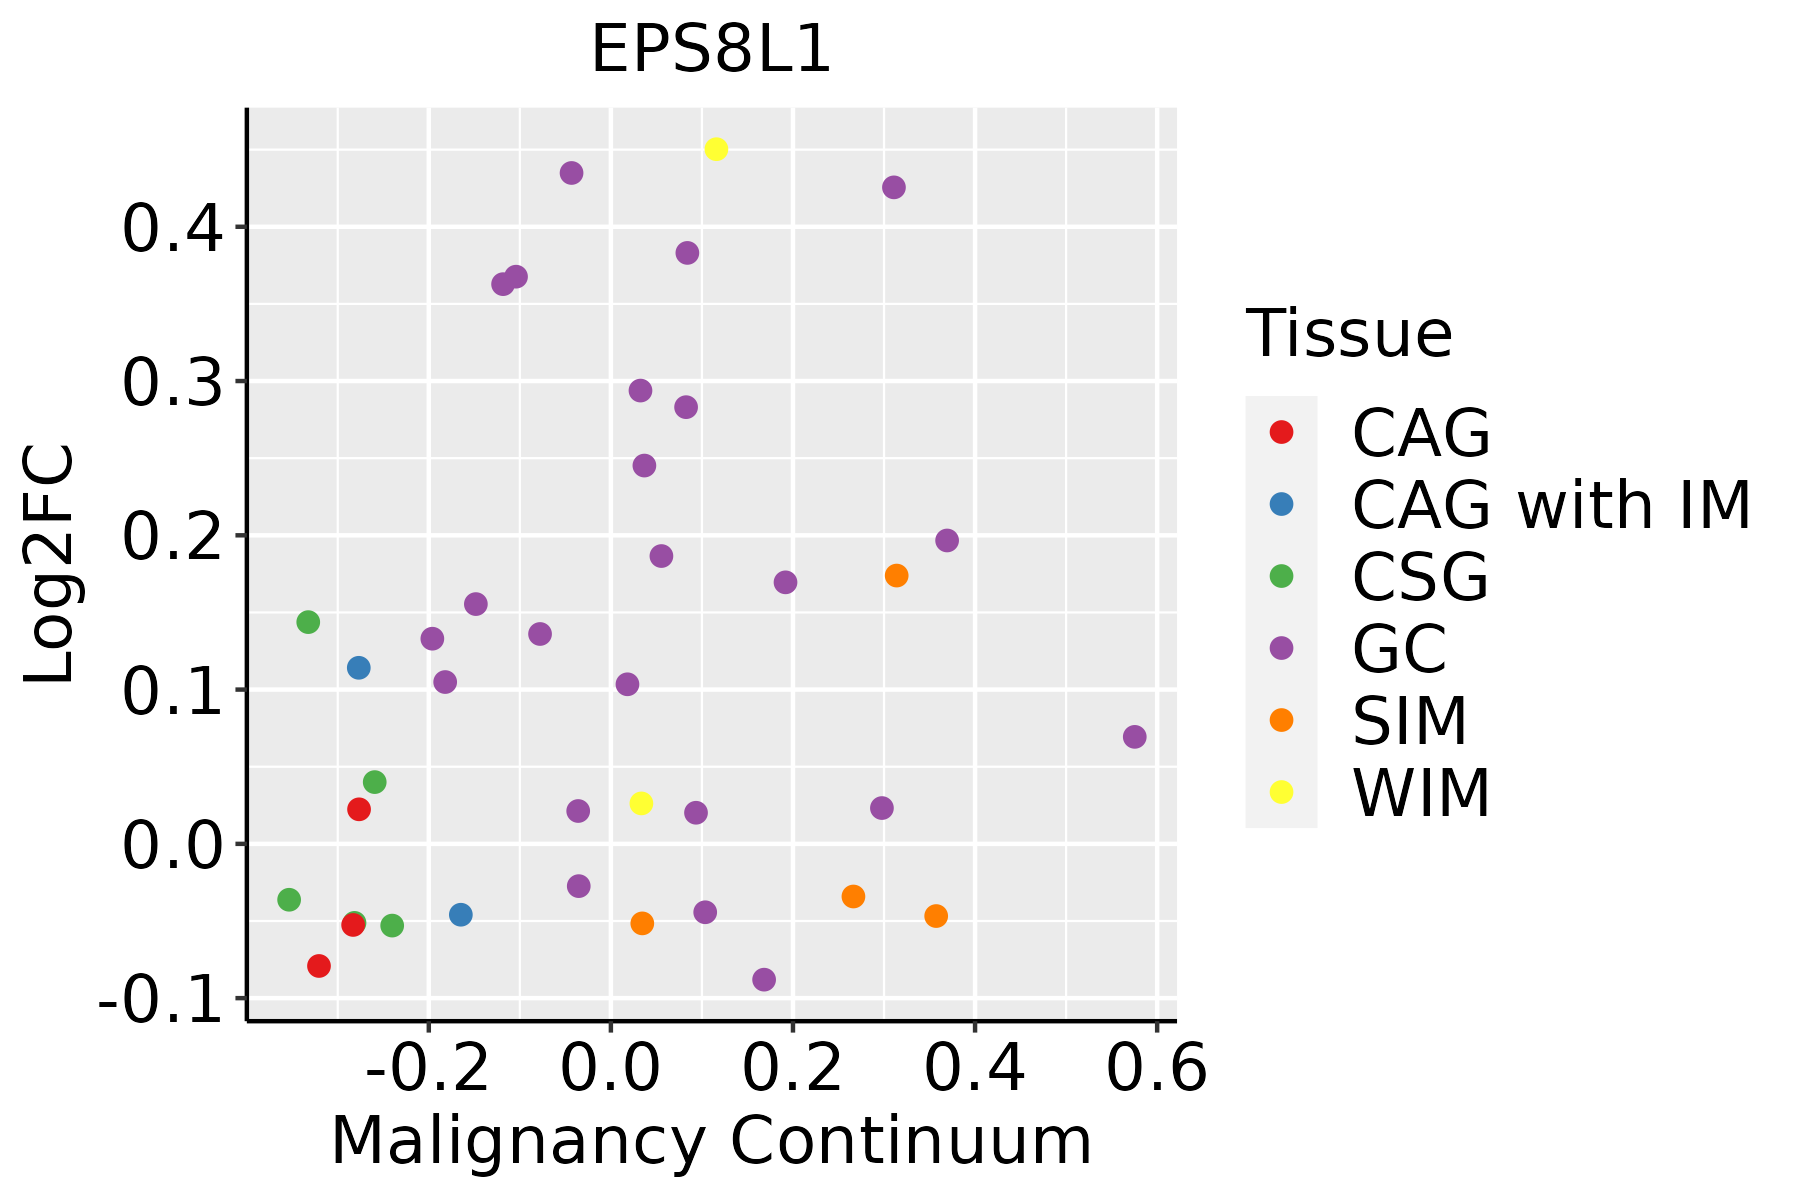 | CAG: Chronic atrophic gastritis |
| CAG with IM: Chronic atrophic gastritis with intestinal metaplasia | ||
| CSG: Chronic superficial gastritis | ||
| GC: Gastric cancer | ||
| SIM: Severe intestinal metaplasia | ||
| WIM: Wild intestinal metaplasia | ||
| Oral Cavity |  | EOLP: Erosive Oral lichen planus |
| LP: leukoplakia | ||
| NEOLP: Non-erosive oral lichen planus | ||
| OSCC: Oral squamous cell carcinoma | ||
| Thyroid | 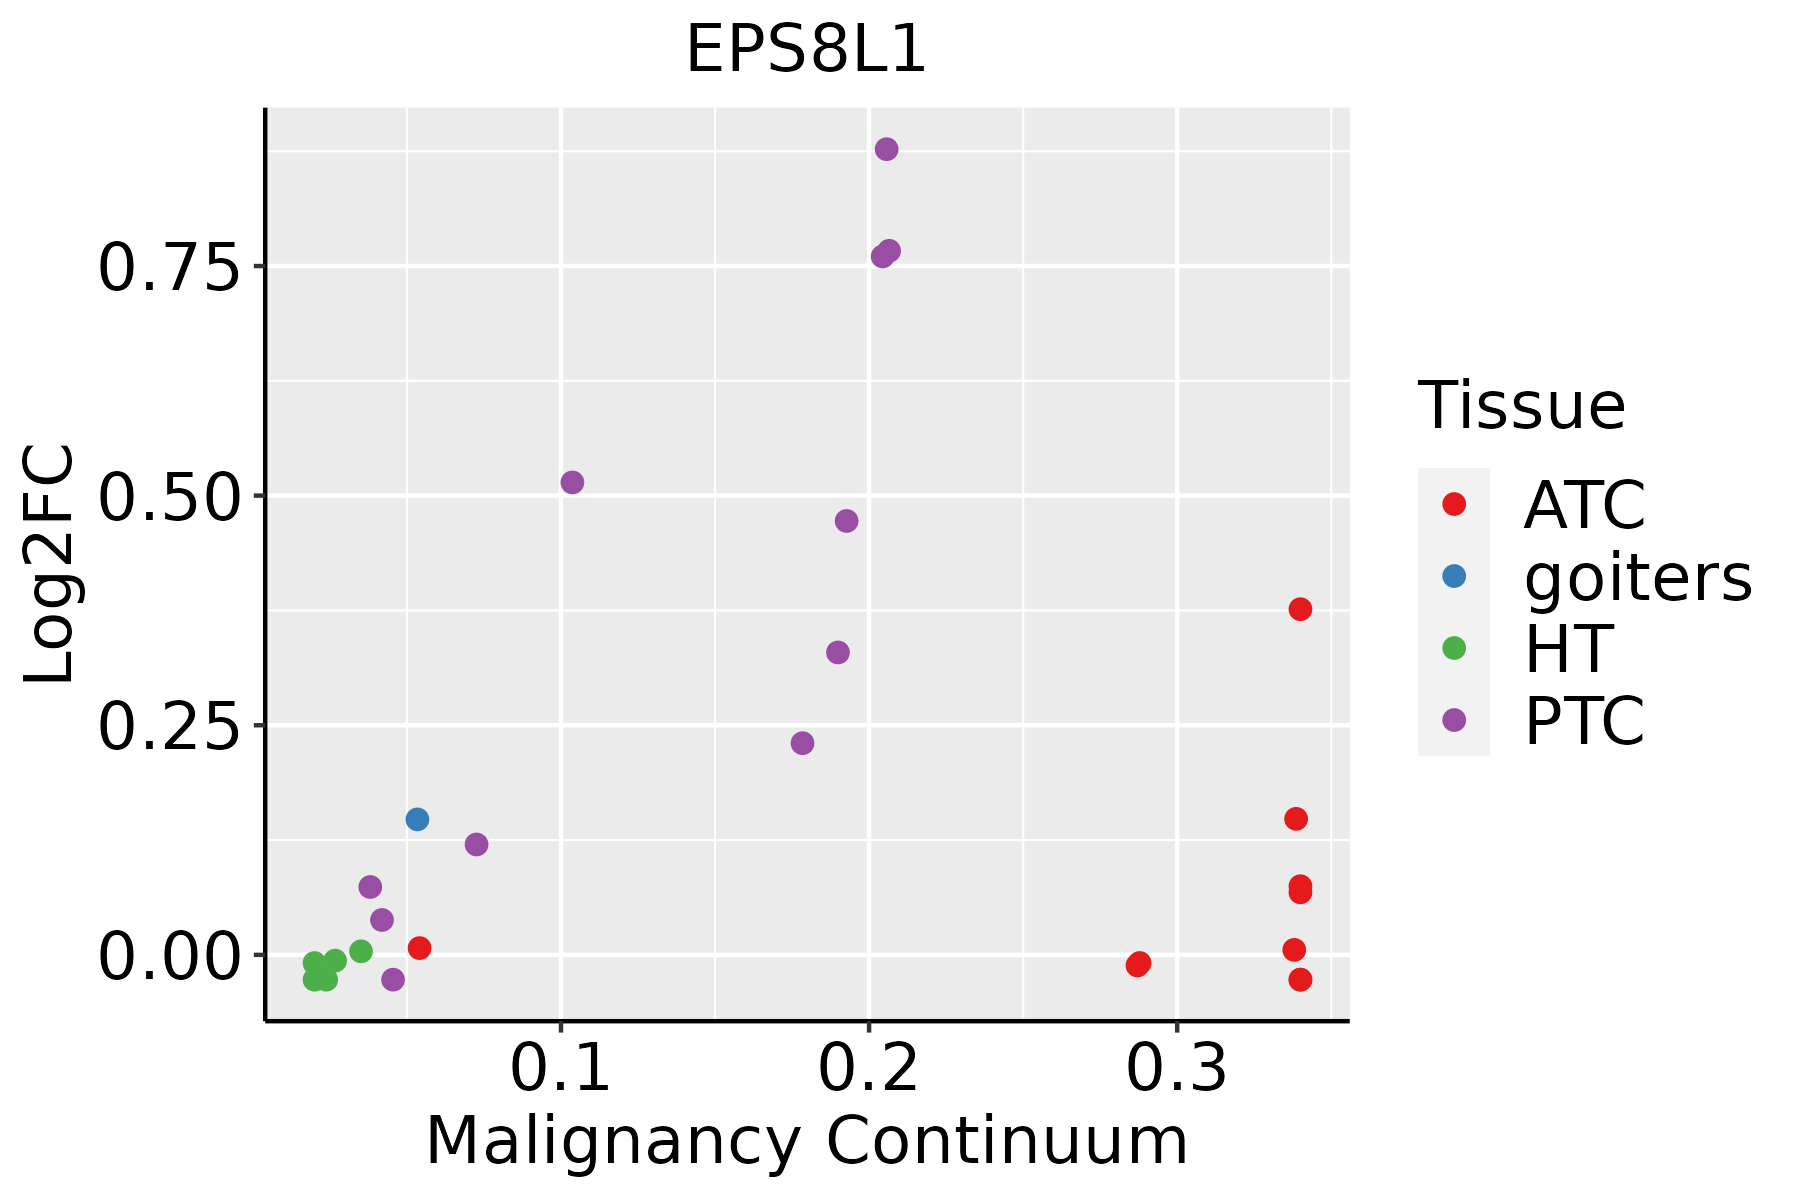 | ATC: Anaplastic thyroid cancer |
| HT: Hashimoto's thyroiditis | ||
| PTC: Papillary thyroid cancer |
| ∗log2FC in expression of this searched gene in stem-like cells from each diseased tissue sample relative to stem-like cells in normal samples in each tissue plotted against the malignancy continuum. Samples are colored based on if they are from different disease stage. |
Top |
Malignant transformation related pathway analysis |
| Find out the enriched GO biological processes and KEGG pathways involved in transition from healthy to precancer to cancer |
| Tissue | Disease Stage | Enriched GO biological Processes |
| Colorectum | AD |  |
| Colorectum | SER |  |
| Colorectum | MSS |  |
| Colorectum | MSI-H |  |
| Colorectum | FAP |  |
| ∗Top 15 enriched GO BP terms are showed in the bar plot of each disease state in each tissue. Each row represents a significant GO biological process which is colored according to the -log10(p.adjust). |
| Page: 1 2 3 4 5 6 7 8 9 |
| GO ID | Tissue | Disease Stage | Description | Gene Ratio | Bg Ratio | pvalue | p.adjust | Count |
| GO:00510567 | Endometrium | AEH | regulation of small GTPase mediated signal transduction | 59/2100 | 302/18723 | 1.43e-05 | 3.03e-04 | 59 |
| GO:00072657 | Endometrium | AEH | Ras protein signal transduction | 63/2100 | 337/18723 | 3.09e-05 | 5.66e-04 | 63 |
| GO:19000275 | Endometrium | AEH | regulation of ruffle assembly | 11/2100 | 31/18723 | 3.44e-04 | 3.80e-03 | 11 |
| GO:00313468 | Endometrium | AEH | positive regulation of cell projection organization | 61/2100 | 353/18723 | 3.91e-04 | 4.20e-03 | 61 |
| GO:00971786 | Endometrium | AEH | ruffle assembly | 13/2100 | 44/18723 | 7.79e-04 | 7.36e-03 | 13 |
| GO:00315296 | Endometrium | AEH | ruffle organization | 15/2100 | 56/18723 | 9.88e-04 | 8.90e-03 | 15 |
| GO:00465786 | Endometrium | AEH | regulation of Ras protein signal transduction | 36/2100 | 189/18723 | 1.01e-03 | 8.97e-03 | 36 |
| GO:00072667 | Endometrium | AEH | Rho protein signal transduction | 28/2100 | 137/18723 | 1.17e-03 | 1.01e-02 | 28 |
| GO:01200329 | Endometrium | AEH | regulation of plasma membrane bounded cell projection assembly | 34/2100 | 186/18723 | 2.79e-03 | 2.01e-02 | 34 |
| GO:00604918 | Endometrium | AEH | regulation of cell projection assembly | 34/2100 | 188/18723 | 3.33e-03 | 2.32e-02 | 34 |
| GO:00350236 | Endometrium | AEH | regulation of Rho protein signal transduction | 18/2100 | 86/18723 | 6.39e-03 | 3.79e-02 | 18 |
| GO:005105612 | Endometrium | EEC | regulation of small GTPase mediated signal transduction | 61/2168 | 302/18723 | 9.42e-06 | 2.08e-04 | 61 |
| GO:000726513 | Endometrium | EEC | Ras protein signal transduction | 64/2168 | 337/18723 | 4.31e-05 | 7.10e-04 | 64 |
| GO:000726613 | Endometrium | EEC | Rho protein signal transduction | 30/2168 | 137/18723 | 4.05e-04 | 4.31e-03 | 30 |
| GO:190002712 | Endometrium | EEC | regulation of ruffle assembly | 11/2168 | 31/18723 | 4.54e-04 | 4.69e-03 | 11 |
| GO:003134613 | Endometrium | EEC | positive regulation of cell projection organization | 61/2168 | 353/18723 | 8.82e-04 | 8.03e-03 | 61 |
| GO:004657813 | Endometrium | EEC | regulation of Ras protein signal transduction | 37/2168 | 189/18723 | 9.23e-04 | 8.32e-03 | 37 |
| GO:009717812 | Endometrium | EEC | ruffle assembly | 13/2168 | 44/18723 | 1.05e-03 | 9.17e-03 | 13 |
| GO:003152913 | Endometrium | EEC | ruffle organization | 15/2168 | 56/18723 | 1.37e-03 | 1.13e-02 | 15 |
| GO:003502313 | Endometrium | EEC | regulation of Rho protein signal transduction | 20/2168 | 86/18723 | 1.65e-03 | 1.29e-02 | 20 |
| Page: 1 2 3 4 5 |
| Pathway ID | Tissue | Disease Stage | Description | Gene Ratio | Bg Ratio | pvalue | p.adjust | qvalue | Count |
| Page: 1 |
Top |
Cell-cell communication analysis |
| Identification of potential cell-cell interactions between two cell types and their ligand-receptor pairs for different disease states |
| Ligand | Receptor | LRpair | Pathway | Tissue | Disease Stage |
| Page: 1 |
Top |
Single-cell gene regulatory network inference analysis |
| Find out the significant the regulons (TFs) and the target genes of each regulon across cell types for different disease states |
| TF | Cell Type | Tissue | Disease Stage | Target Gene | RSS | Regulon Activity |
| ∗The dot plots of a searched regulon are shown for all cell subpopulations in each disease state of each tissue based on the regulon specific score inferred using pySCENIC and by calculating the average expression. |
| Page: 1 |
Top |
Somatic mutation of malignant transformation related genes |
| Annotation of somatic variants for genes involved in malignant transformation |
| Hugo Symbol | Variant Class | Variant Classification | dbSNP RS | HGVSc | HGVSp | HGVSp Short | SWISSPROT | BIOTYPE | SIFT | PolyPhen | Tumor Sample Barcode | Tissue | Histology | Sex | Age | Stage | Therapy Types | Drugs | Outcome |
| EPS8L1 | SNV | Missense_Mutation | c.2139N>C | p.Lys713Asn | p.K713N | Q8TE68 | protein_coding | deleterious(0) | benign(0.42) | TCGA-AO-A0J6-01 | Breast | breast invasive carcinoma | Female | <65 | I/II | Chemotherapy | doxorubicin | SD | |
| EPS8L1 | SNV | Missense_Mutation | c.1729N>G | p.Arg577Gly | p.R577G | Q8TE68 | protein_coding | tolerated(0.25) | benign(0) | TCGA-AO-A1KR-01 | Breast | breast invasive carcinoma | Female | <65 | I/II | Chemotherapy | cyclophosphamide | SD | |
| EPS8L1 | SNV | Missense_Mutation | c.340N>A | p.Gly114Ser | p.G114S | Q8TE68 | protein_coding | tolerated(0.54) | benign(0.409) | TCGA-E2-A159-01 | Breast | breast invasive carcinoma | Female | <65 | I/II | Chemotherapy | cyclophosphamide | SD | |
| EPS8L1 | insertion | Nonsense_Mutation | novel | c.1554_1555insCTCAATAAATGACAGCTGTTTCTAGCTGTGT | p.Asp519LeufsTer4 | p.D519Lfs*4 | Q8TE68 | protein_coding | TCGA-BH-A0HU-01 | Breast | breast invasive carcinoma | Female | <65 | I/II | Chemotherapy | docetaxel | SD | ||
| EPS8L1 | SNV | Missense_Mutation | c.1414C>T | p.Pro472Ser | p.P472S | Q8TE68 | protein_coding | tolerated(0.07) | benign(0) | TCGA-Q1-A5R3-01 | Cervix | cervical & endocervical cancer | Female | <65 | I/II | Chemotherapy | cisplatin | PR | |
| EPS8L1 | SNV | Missense_Mutation | rs200225675 | c.1771N>A | p.Glu591Lys | p.E591K | Q8TE68 | protein_coding | tolerated(0.89) | benign(0) | TCGA-A6-2686-01 | Colorectum | colon adenocarcinoma | Female | >=65 | I/II | Unknown | Unknown | SD |
| EPS8L1 | SNV | Missense_Mutation | c.952N>A | p.Asp318Asn | p.D318N | Q8TE68 | protein_coding | deleterious(0) | possibly_damaging(0.452) | TCGA-A6-6653-01 | Colorectum | colon adenocarcinoma | Male | >=65 | I/II | Unknown | Unknown | SD | |
| EPS8L1 | SNV | Missense_Mutation | c.868N>T | p.Arg290Cys | p.R290C | Q8TE68 | protein_coding | deleterious(0) | possibly_damaging(0.854) | TCGA-AA-3492-01 | Colorectum | colon adenocarcinoma | Female | >=65 | I/II | Unknown | Unknown | SD | |
| EPS8L1 | SNV | Missense_Mutation | c.1678N>T | p.Pro560Ser | p.P560S | Q8TE68 | protein_coding | tolerated(0.17) | benign(0.003) | TCGA-AA-3496-01 | Colorectum | colon adenocarcinoma | Female | >=65 | I/II | Unknown | Unknown | SD | |
| EPS8L1 | SNV | Missense_Mutation | c.1714C>T | p.Arg572Cys | p.R572C | Q8TE68 | protein_coding | tolerated(0.05) | benign(0.445) | TCGA-AA-3506-01 | Colorectum | colon adenocarcinoma | Male | >=65 | I/II | Unknown | Unknown | SD |
| Page: 1 2 3 4 5 6 7 8 |
Top |
Related drugs of malignant transformation related genes |
| Identification of chemicals and drugs interact with genes involved in malignant transfromation |
| (DGIdb 4.0) |
| Entrez ID | Symbol | Category | Interaction Types | Drug Claim Name | Drug Name | PMIDs |
| Page: 1 |

Copyright 2023-Present -The University of Texas Health Science Center at Houston |