
|
|||||
|
 | |
| |
| |
| |
| |
| |
|
Gene: EPS15L1 |
Gene summary for EPS15L1 |
| Gene information | Species | Human | Gene symbol | EPS15L1 | Gene ID | 58513 |
| Gene name | epidermal growth factor receptor pathway substrate 15 like 1 | |
| Gene Alias | EPS15R | |
| Cytomap | 19p13.11 | |
| Gene Type | protein-coding | GO ID | GO:0006810 | UniProtAcc | Q9UBC2 |
Top |
Malignant transformation analysis |
| Identification of the aberrant gene expression in precancerous and cancerous lesions by comparing the gene expression of stem-like cells in diseased tissues with normal stem cells |
| Entrez ID | Symbol | Replicates | Species | Organ | Tissue | Adj P-value | Log2FC | Malignancy |
| 58513 | EPS15L1 | LZE4T | Human | Esophagus | ESCC | 1.83e-13 | 3.27e-01 | 0.0811 |
| 58513 | EPS15L1 | LZE7T | Human | Esophagus | ESCC | 6.50e-11 | 6.67e-01 | 0.0667 |
| 58513 | EPS15L1 | LZE8T | Human | Esophagus | ESCC | 4.44e-03 | 7.68e-02 | 0.067 |
| 58513 | EPS15L1 | LZE20T | Human | Esophagus | ESCC | 2.77e-03 | 1.42e-01 | 0.0662 |
| 58513 | EPS15L1 | LZE21D1 | Human | Esophagus | HGIN | 1.77e-02 | 1.84e-01 | 0.0632 |
| 58513 | EPS15L1 | LZE24T | Human | Esophagus | ESCC | 2.31e-15 | 3.59e-01 | 0.0596 |
| 58513 | EPS15L1 | LZE21T | Human | Esophagus | ESCC | 7.93e-03 | 2.32e-01 | 0.0655 |
| 58513 | EPS15L1 | P1T-E | Human | Esophagus | ESCC | 2.36e-08 | 3.71e-01 | 0.0875 |
| 58513 | EPS15L1 | P2T-E | Human | Esophagus | ESCC | 7.50e-21 | 1.98e-01 | 0.1177 |
| 58513 | EPS15L1 | P4T-E | Human | Esophagus | ESCC | 1.86e-15 | 3.19e-01 | 0.1323 |
| 58513 | EPS15L1 | P5T-E | Human | Esophagus | ESCC | 2.43e-16 | 2.11e-01 | 0.1327 |
| 58513 | EPS15L1 | P8T-E | Human | Esophagus | ESCC | 7.81e-23 | 3.49e-01 | 0.0889 |
| 58513 | EPS15L1 | P9T-E | Human | Esophagus | ESCC | 3.62e-17 | 2.33e-01 | 0.1131 |
| 58513 | EPS15L1 | P10T-E | Human | Esophagus | ESCC | 2.21e-32 | 4.95e-01 | 0.116 |
| 58513 | EPS15L1 | P11T-E | Human | Esophagus | ESCC | 1.89e-16 | 3.83e-01 | 0.1426 |
| 58513 | EPS15L1 | P12T-E | Human | Esophagus | ESCC | 3.65e-23 | 4.42e-01 | 0.1122 |
| 58513 | EPS15L1 | P15T-E | Human | Esophagus | ESCC | 8.60e-14 | 2.86e-01 | 0.1149 |
| 58513 | EPS15L1 | P16T-E | Human | Esophagus | ESCC | 3.20e-15 | 2.56e-01 | 0.1153 |
| 58513 | EPS15L1 | P17T-E | Human | Esophagus | ESCC | 1.17e-06 | 2.85e-01 | 0.1278 |
| 58513 | EPS15L1 | P19T-E | Human | Esophagus | ESCC | 1.36e-02 | 3.61e-01 | 0.1662 |
| Page: 1 2 3 4 |
| Tissue | Expression Dynamics | Abbreviation |
| Esophagus | 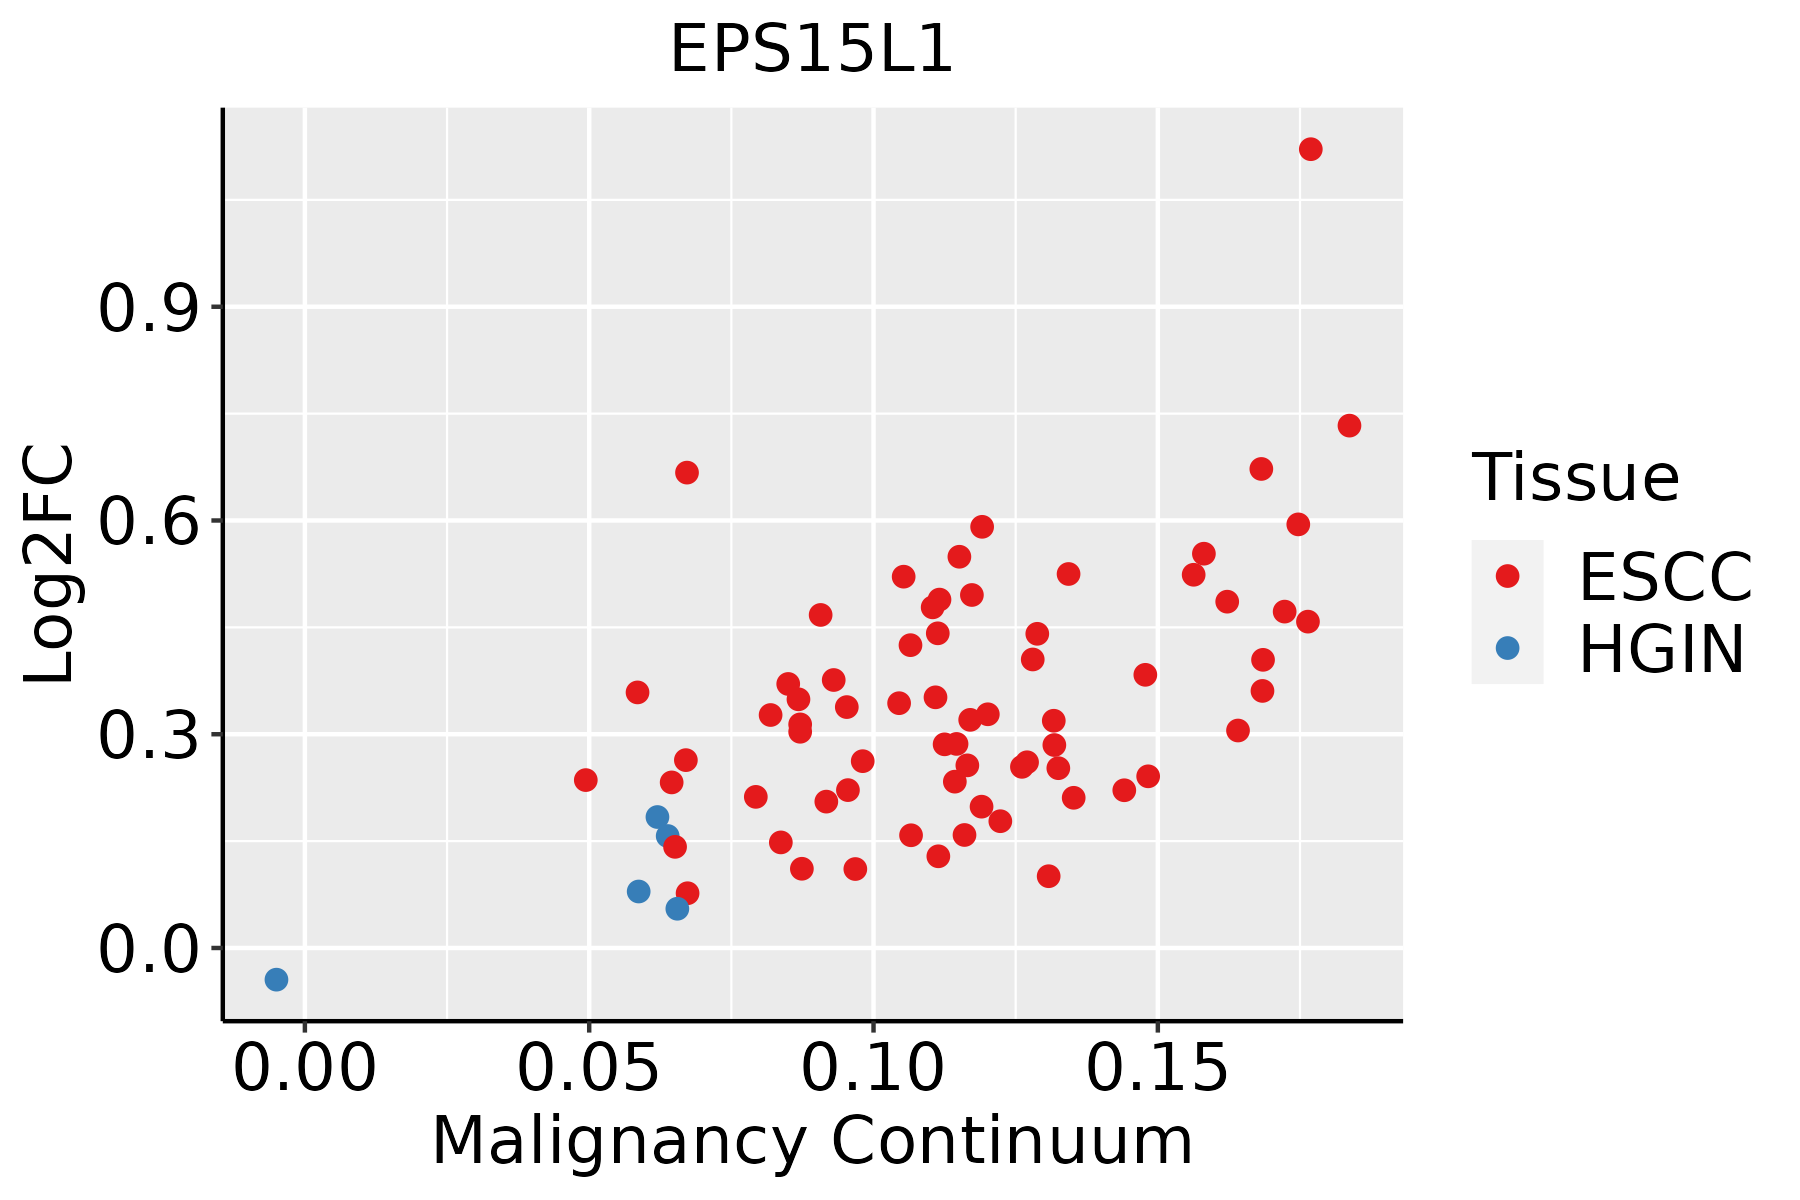 | ESCC: Esophageal squamous cell carcinoma |
| HGIN: High-grade intraepithelial neoplasias | ||
| LGIN: Low-grade intraepithelial neoplasias | ||
| Thyroid | 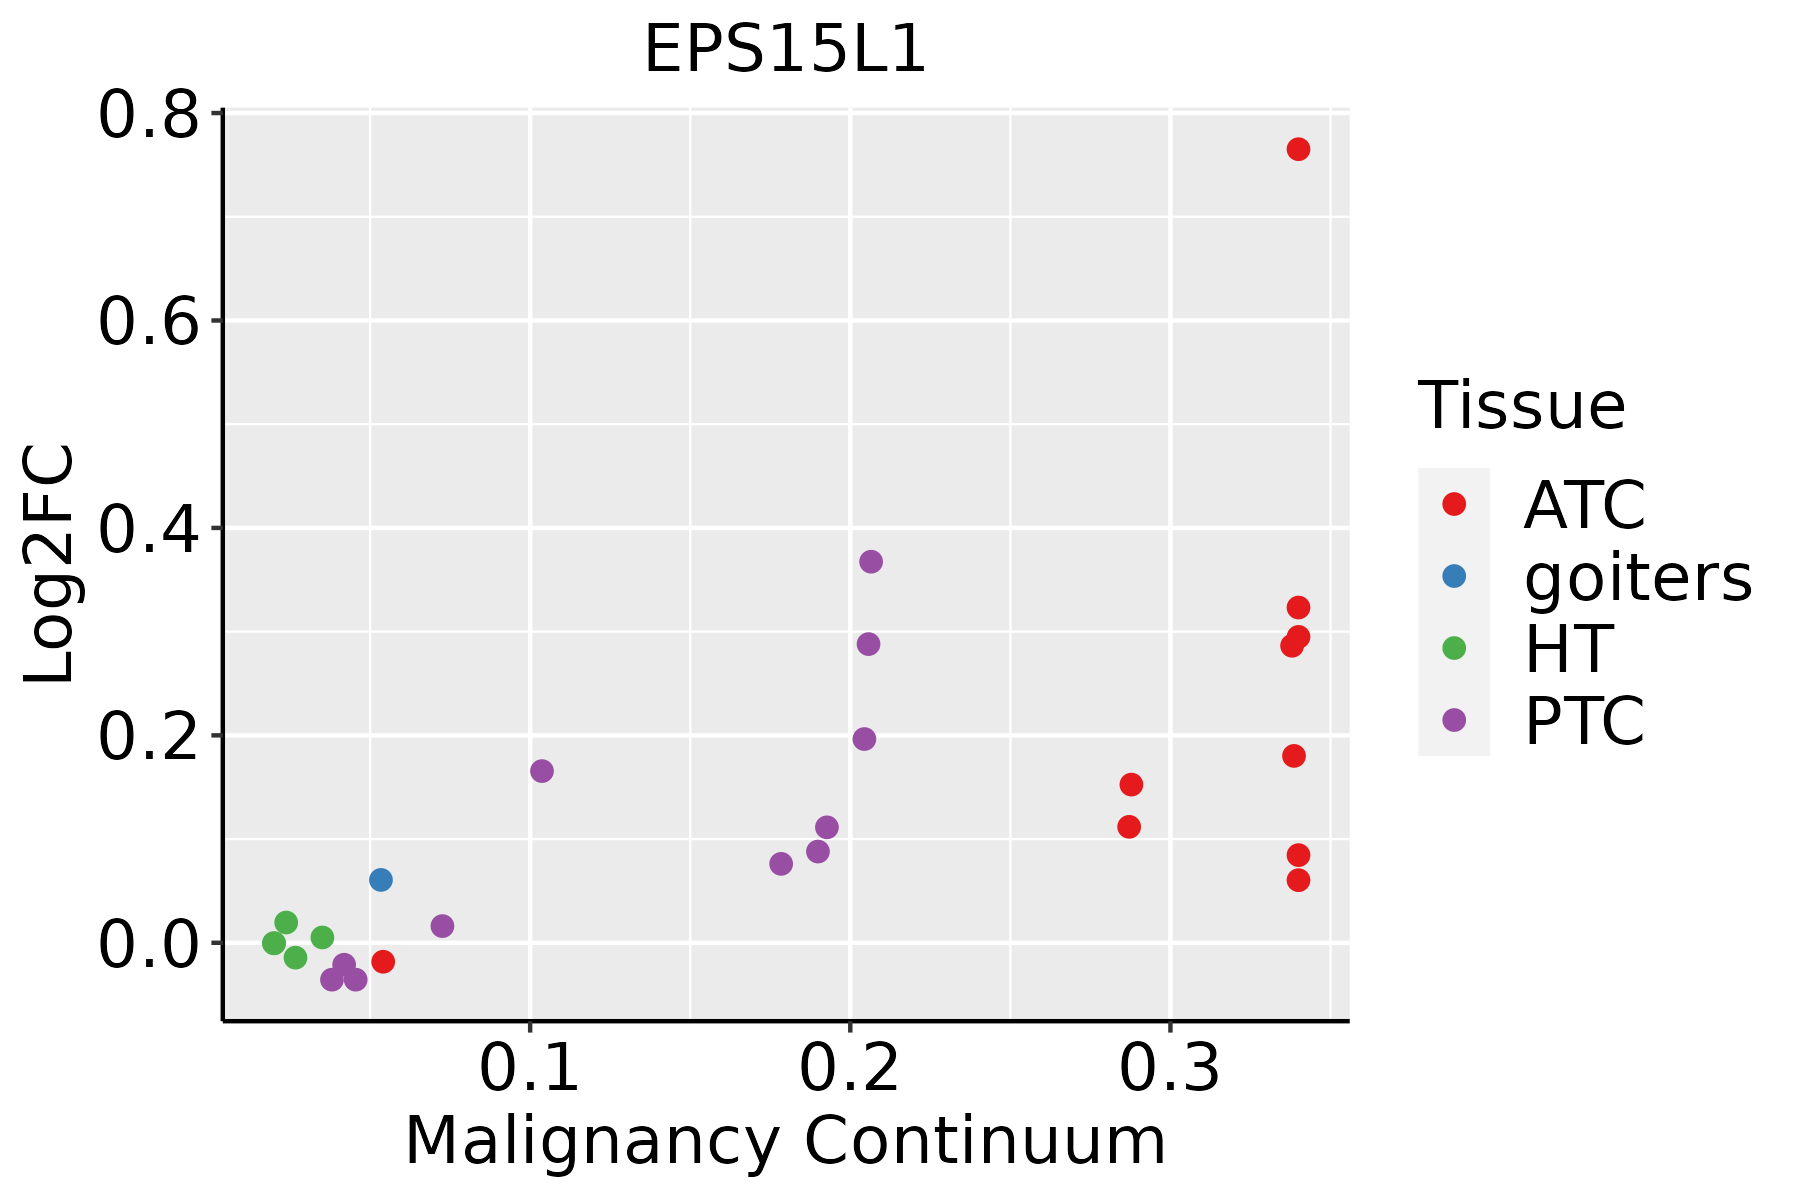 | ATC: Anaplastic thyroid cancer |
| HT: Hashimoto's thyroiditis | ||
| PTC: Papillary thyroid cancer |
| ∗log2FC in expression of this searched gene in stem-like cells from each diseased tissue sample relative to stem-like cells in normal samples in each tissue plotted against the malignancy continuum. Samples are colored based on if they are from different disease stage. |
Top |
Malignant transformation related pathway analysis |
| Find out the enriched GO biological processes and KEGG pathways involved in transition from healthy to precancer to cancer |
| Tissue | Disease Stage | Enriched GO biological Processes |
| Colorectum | AD |  |
| Colorectum | SER |  |
| Colorectum | MSS |  |
| Colorectum | MSI-H |  |
| Colorectum | FAP |  |
| ∗Top 15 enriched GO BP terms are showed in the bar plot of each disease state in each tissue. Each row represents a significant GO biological process which is colored according to the -log10(p.adjust). |
| Page: 1 2 3 4 5 6 7 8 9 |
| GO ID | Tissue | Disease Stage | Description | Gene Ratio | Bg Ratio | pvalue | p.adjust | Count |
| GO:001619710 | Esophagus | HGIN | endosomal transport | 57/2587 | 230/18723 | 5.74e-06 | 1.81e-04 | 57 |
| GO:001619715 | Esophagus | ESCC | endosomal transport | 168/8552 | 230/18723 | 2.28e-17 | 1.93e-15 | 168 |
| GO:001619718 | Thyroid | PTC | endosomal transport | 128/5968 | 230/18723 | 6.26e-14 | 3.52e-12 | 128 |
| GO:001619719 | Thyroid | ATC | endosomal transport | 128/6293 | 230/18723 | 4.44e-12 | 1.75e-10 | 128 |
| Page: 1 |
| Pathway ID | Tissue | Disease Stage | Description | Gene Ratio | Bg Ratio | pvalue | p.adjust | qvalue | Count |
| hsa0414429 | Esophagus | HGIN | Endocytosis | 76/1383 | 251/8465 | 1.74e-08 | 3.34e-07 | 2.65e-07 | 76 |
| hsa04144113 | Esophagus | HGIN | Endocytosis | 76/1383 | 251/8465 | 1.74e-08 | 3.34e-07 | 2.65e-07 | 76 |
| hsa04144210 | Esophagus | ESCC | Endocytosis | 186/4205 | 251/8465 | 9.74e-16 | 4.66e-14 | 2.39e-14 | 186 |
| hsa0414437 | Esophagus | ESCC | Endocytosis | 186/4205 | 251/8465 | 9.74e-16 | 4.66e-14 | 2.39e-14 | 186 |
| Page: 1 |
Top |
Cell-cell communication analysis |
| Identification of potential cell-cell interactions between two cell types and their ligand-receptor pairs for different disease states |
| Ligand | Receptor | LRpair | Pathway | Tissue | Disease Stage |
| Page: 1 |
Top |
Single-cell gene regulatory network inference analysis |
| Find out the significant the regulons (TFs) and the target genes of each regulon across cell types for different disease states |
| TF | Cell Type | Tissue | Disease Stage | Target Gene | RSS | Regulon Activity |
| ∗The dot plots of a searched regulon are shown for all cell subpopulations in each disease state of each tissue based on the regulon specific score inferred using pySCENIC and by calculating the average expression. |
| Page: 1 |
Top |
Somatic mutation of malignant transformation related genes |
| Annotation of somatic variants for genes involved in malignant transformation |
| Hugo Symbol | Variant Class | Variant Classification | dbSNP RS | HGVSc | HGVSp | HGVSp Short | SWISSPROT | BIOTYPE | SIFT | PolyPhen | Tumor Sample Barcode | Tissue | Histology | Sex | Age | Stage | Therapy Types | Drugs | Outcome |
| EPS15L1 | SNV | Missense_Mutation | c.1067N>G | p.Pro356Arg | p.P356R | Q9UBC2 | protein_coding | deleterious(0) | possibly_damaging(0.496) | TCGA-A1-A0SN-01 | Breast | breast invasive carcinoma | Female | <65 | I/II | Chemotherapy | ac | SD | |
| EPS15L1 | SNV | Missense_Mutation | novel | c.1684N>C | p.Glu562Gln | p.E562Q | Q9UBC2 | protein_coding | deleterious(0.04) | benign(0.384) | TCGA-AC-A23H-01 | Breast | breast invasive carcinoma | Female | >=65 | I/II | Unknown | Unknown | PD |
| EPS15L1 | SNV | Missense_Mutation | novel | c.2227N>A | p.Asp743Asn | p.D743N | Q9UBC2 | protein_coding | deleterious(0) | possibly_damaging(0.748) | TCGA-AN-A046-01 | Breast | breast invasive carcinoma | Female | >=65 | I/II | Unknown | Unknown | SD |
| EPS15L1 | SNV | Missense_Mutation | rs143490617 | c.1132G>A | p.Gly378Arg | p.G378R | Q9UBC2 | protein_coding | deleterious(0) | probably_damaging(0.914) | TCGA-AO-A128-01 | Breast | breast invasive carcinoma | Female | <65 | I/II | Chemotherapy | doxorubicin | SD |
| EPS15L1 | insertion | Nonsense_Mutation | novel | c.1199_1200insCCCTGCCTCAAAAATAAATGAATAAGTAATAT | p.Lys400AsnfsTer9 | p.K400Nfs*9 | Q9UBC2 | protein_coding | TCGA-AO-A03T-01 | Breast | breast invasive carcinoma | Female | <65 | I/II | Chemotherapy | cyclophosphamide | SD | ||
| EPS15L1 | insertion | Frame_Shift_Ins | novel | c.997_998insCCCTTCCCAC | p.Phe333SerfsTer17 | p.F333Sfs*17 | Q9UBC2 | protein_coding | TCGA-AO-A0J9-01 | Breast | breast invasive carcinoma | Female | <65 | III/IV | Chemotherapy | cyclophosphamide | PD | ||
| EPS15L1 | insertion | In_Frame_Ins | novel | c.995_996insTGCCCTGGGGGTATTGAC | p.Gln332delinsHisAlaLeuGlyValLeuThr | p.Q332delinsHALGVLT | Q9UBC2 | protein_coding | TCGA-AO-A0J9-01 | Breast | breast invasive carcinoma | Female | <65 | III/IV | Chemotherapy | cyclophosphamide | PD | ||
| EPS15L1 | insertion | Frame_Shift_Ins | novel | c.2109_2110insTCTAGGCAAAT | p.Pro704SerfsTer28 | p.P704Sfs*28 | Q9UBC2 | protein_coding | TCGA-BH-A0E2-01 | Breast | breast invasive carcinoma | Female | <65 | III/IV | Chemotherapy | doxorubicin | SD | ||
| EPS15L1 | insertion | Frame_Shift_Ins | novel | c.2107_2108insT | p.Asp703ValfsTer4 | p.D703Vfs*4 | Q9UBC2 | protein_coding | TCGA-BH-A0E2-01 | Breast | breast invasive carcinoma | Female | <65 | III/IV | Chemotherapy | doxorubicin | SD | ||
| EPS15L1 | insertion | Nonsense_Mutation | novel | c.2129_2130insTCTTAAAGACCTGTAACTCTGACTTTGTTGGTGCCGATTGCAGAT | p.Pro710_Phe711insLeuLysAspLeuTerLeuTerLeuCysTrpCysArgLeuGlnIle | p.P710_F711insLKDL*L*LCWCRLQI | Q9UBC2 | protein_coding | TCGA-BH-A0EE-01 | Breast | breast invasive carcinoma | Female | >=65 | I/II | Chemotherapy | docetaxel | SD |
| Page: 1 2 3 4 5 6 7 8 9 |
Top |
Related drugs of malignant transformation related genes |
| Identification of chemicals and drugs interact with genes involved in malignant transfromation |
| (DGIdb 4.0) |
| Entrez ID | Symbol | Category | Interaction Types | Drug Claim Name | Drug Name | PMIDs |
| Page: 1 |

Copyright 2023-Present -The University of Texas Health Science Center at Houston |