
|
|||||
|
 | |
| |
| |
| |
| |
| |
|
Gene: EPS15 |
Gene summary for EPS15 |
| Gene information | Species | Human | Gene symbol | EPS15 | Gene ID | 2060 |
| Gene name | epidermal growth factor receptor pathway substrate 15 | |
| Gene Alias | AF-1P | |
| Cytomap | 1p32.3 | |
| Gene Type | protein-coding | GO ID | GO:0001881 | UniProtAcc | B7Z240 |
Top |
Malignant transformation analysis |
| Identification of the aberrant gene expression in precancerous and cancerous lesions by comparing the gene expression of stem-like cells in diseased tissues with normal stem cells |
| Entrez ID | Symbol | Replicates | Species | Organ | Tissue | Adj P-value | Log2FC | Malignancy |
| 2060 | EPS15 | CCI_1 | Human | Cervix | CC | 7.09e-04 | 7.67e-01 | 0.528 |
| 2060 | EPS15 | CCI_3 | Human | Cervix | CC | 2.69e-08 | 8.37e-01 | 0.516 |
| 2060 | EPS15 | HTA11_3410_2000001011 | Human | Colorectum | AD | 7.66e-10 | -5.05e-01 | 0.0155 |
| 2060 | EPS15 | HTA11_866_3004761011 | Human | Colorectum | AD | 1.05e-05 | -4.34e-01 | 0.096 |
| 2060 | EPS15 | HTA11_7696_3000711011 | Human | Colorectum | AD | 2.28e-04 | -4.21e-01 | 0.0674 |
| 2060 | EPS15 | HTA11_99999974143_84620 | Human | Colorectum | MSS | 7.57e-06 | -4.25e-01 | 0.3005 |
| 2060 | EPS15 | F007 | Human | Colorectum | FAP | 4.16e-04 | -3.31e-01 | 0.1176 |
| 2060 | EPS15 | A015-C-203 | Human | Colorectum | FAP | 3.52e-27 | -3.84e-01 | -0.1294 |
| 2060 | EPS15 | A015-C-204 | Human | Colorectum | FAP | 2.51e-05 | -3.16e-01 | -0.0228 |
| 2060 | EPS15 | A014-C-040 | Human | Colorectum | FAP | 2.08e-05 | -5.79e-01 | -0.1184 |
| 2060 | EPS15 | A002-C-201 | Human | Colorectum | FAP | 2.74e-09 | -2.71e-01 | 0.0324 |
| 2060 | EPS15 | A002-C-203 | Human | Colorectum | FAP | 2.26e-04 | -1.78e-01 | 0.2786 |
| 2060 | EPS15 | A001-C-119 | Human | Colorectum | FAP | 2.64e-06 | -3.97e-01 | -0.1557 |
| 2060 | EPS15 | A001-C-108 | Human | Colorectum | FAP | 2.21e-17 | -2.76e-01 | -0.0272 |
| 2060 | EPS15 | A002-C-205 | Human | Colorectum | FAP | 1.55e-19 | -4.45e-01 | -0.1236 |
| 2060 | EPS15 | A001-C-104 | Human | Colorectum | FAP | 3.13e-02 | -1.01e-01 | 0.0184 |
| 2060 | EPS15 | A015-C-005 | Human | Colorectum | FAP | 5.12e-03 | -2.59e-01 | -0.0336 |
| 2060 | EPS15 | A015-C-006 | Human | Colorectum | FAP | 4.52e-13 | -4.38e-01 | -0.0994 |
| 2060 | EPS15 | A015-C-106 | Human | Colorectum | FAP | 4.32e-09 | -2.38e-01 | -0.0511 |
| 2060 | EPS15 | A002-C-114 | Human | Colorectum | FAP | 2.67e-16 | -4.25e-01 | -0.1561 |
| Page: 1 2 3 4 5 6 7 8 9 |
| Tissue | Expression Dynamics | Abbreviation |
| Cervix |  | CC: Cervix cancer |
| HSIL_HPV: HPV-infected high-grade squamous intraepithelial lesions | ||
| N_HPV: HPV-infected normal cervix | ||
| Colorectum (GSE201348) |  | FAP: Familial adenomatous polyposis |
| CRC: Colorectal cancer | ||
| Colorectum (HTA11) |  | AD: Adenomas |
| SER: Sessile serrated lesions | ||
| MSI-H: Microsatellite-high colorectal cancer | ||
| MSS: Microsatellite stable colorectal cancer | ||
| Endometrium | 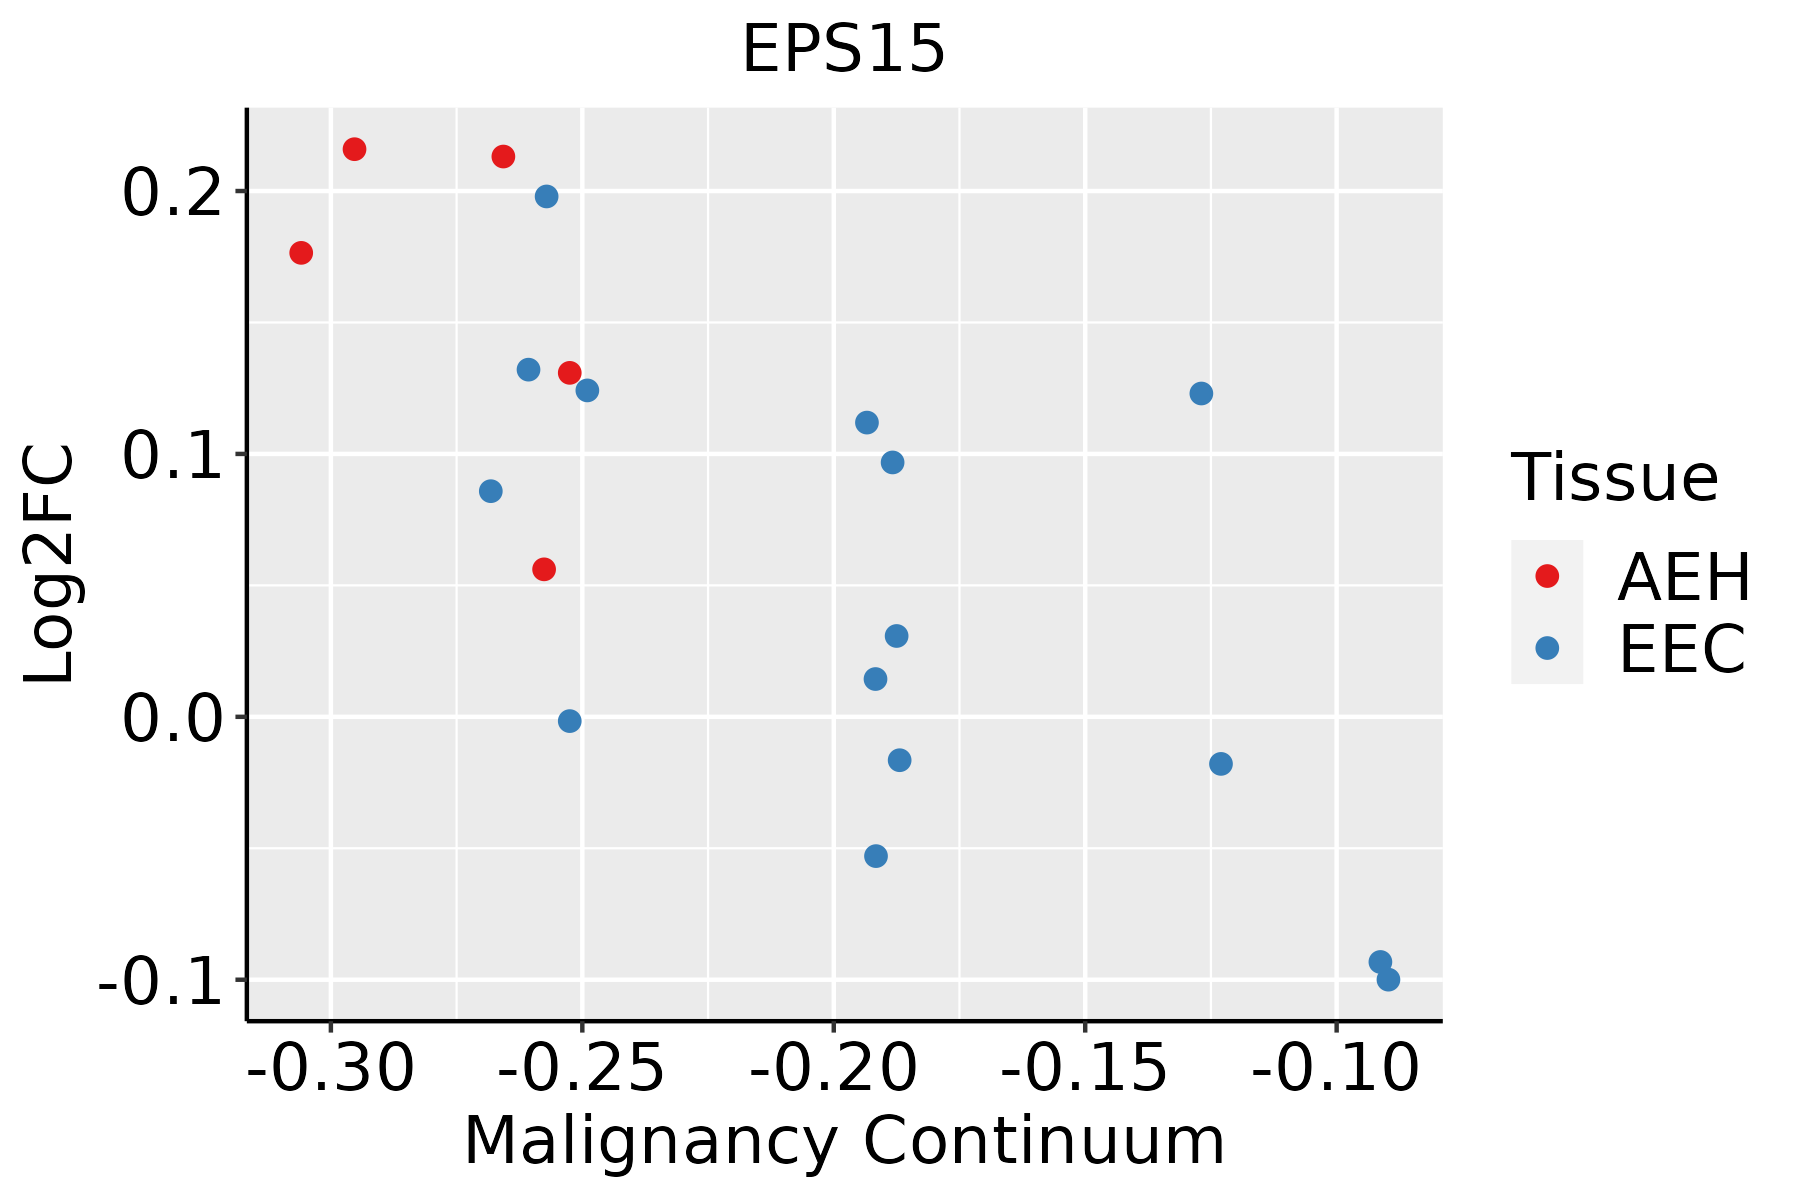 | AEH: Atypical endometrial hyperplasia |
| EEC: Endometrioid Cancer | ||
| Esophagus |  | ESCC: Esophageal squamous cell carcinoma |
| HGIN: High-grade intraepithelial neoplasias | ||
| LGIN: Low-grade intraepithelial neoplasias | ||
| Liver |  | HCC: Hepatocellular carcinoma |
| NAFLD: Non-alcoholic fatty liver disease | ||
| Lung | 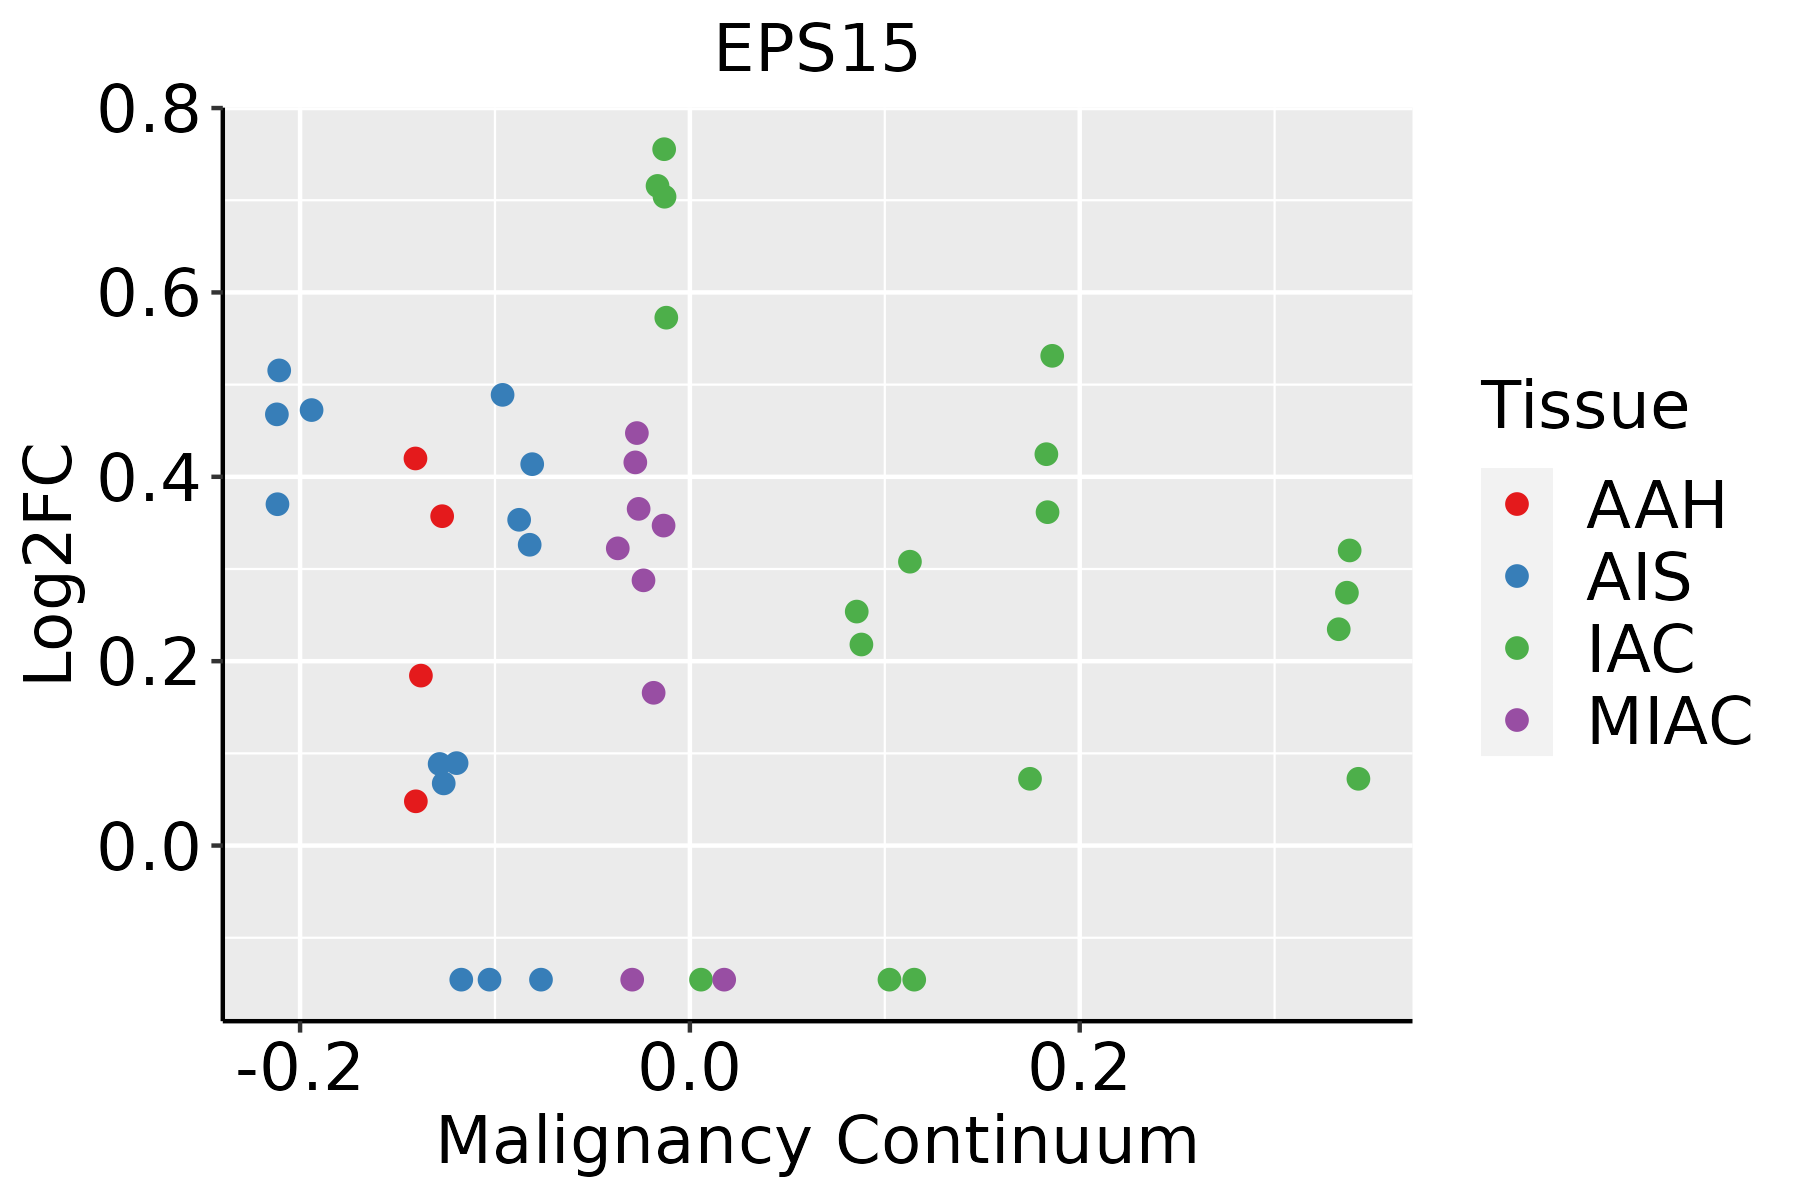 | AAH: Atypical adenomatous hyperplasia |
| AIS: Adenocarcinoma in situ | ||
| IAC: Invasive lung adenocarcinoma | ||
| MIA: Minimally invasive adenocarcinoma | ||
| Oral Cavity |  | EOLP: Erosive Oral lichen planus |
| LP: leukoplakia | ||
| NEOLP: Non-erosive oral lichen planus | ||
| OSCC: Oral squamous cell carcinoma | ||
| Prostate | 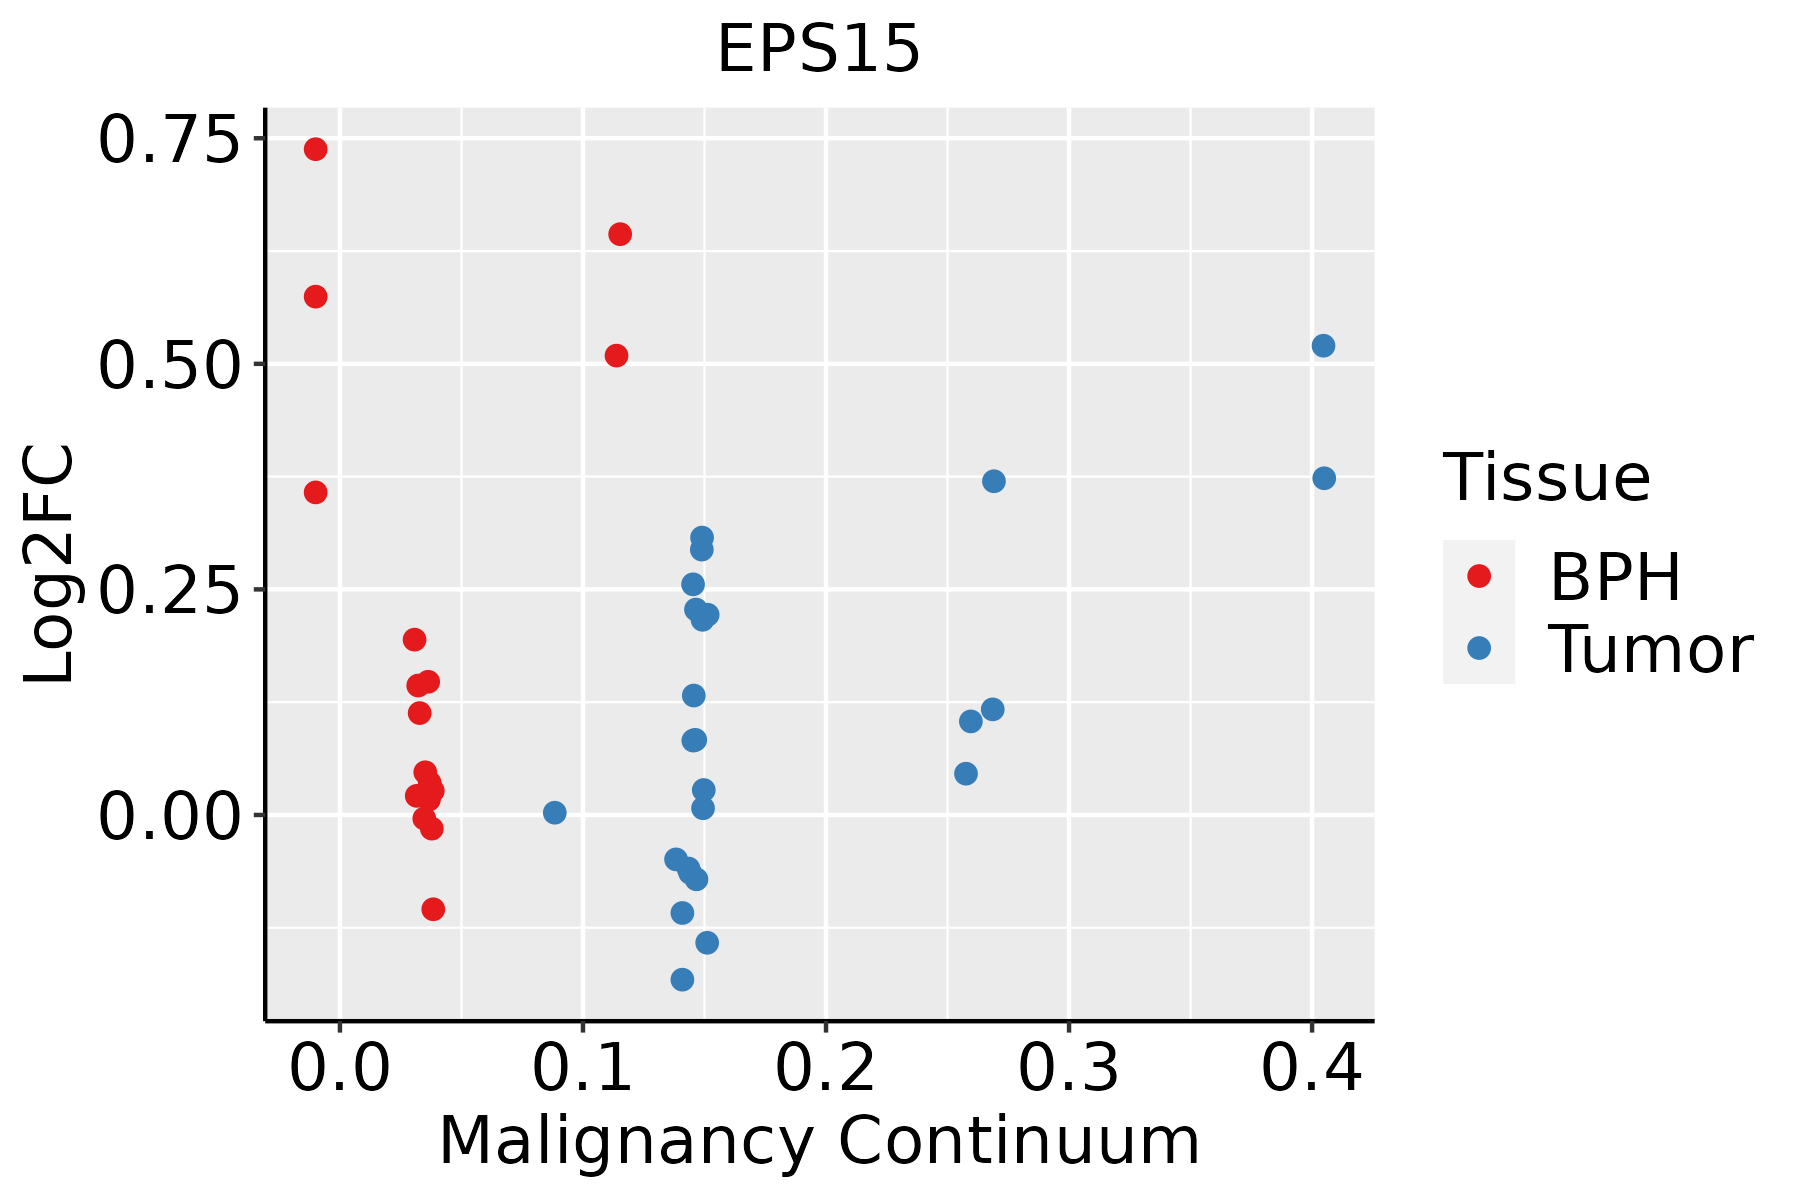 | BPH: Benign Prostatic Hyperplasia |
| Thyroid | 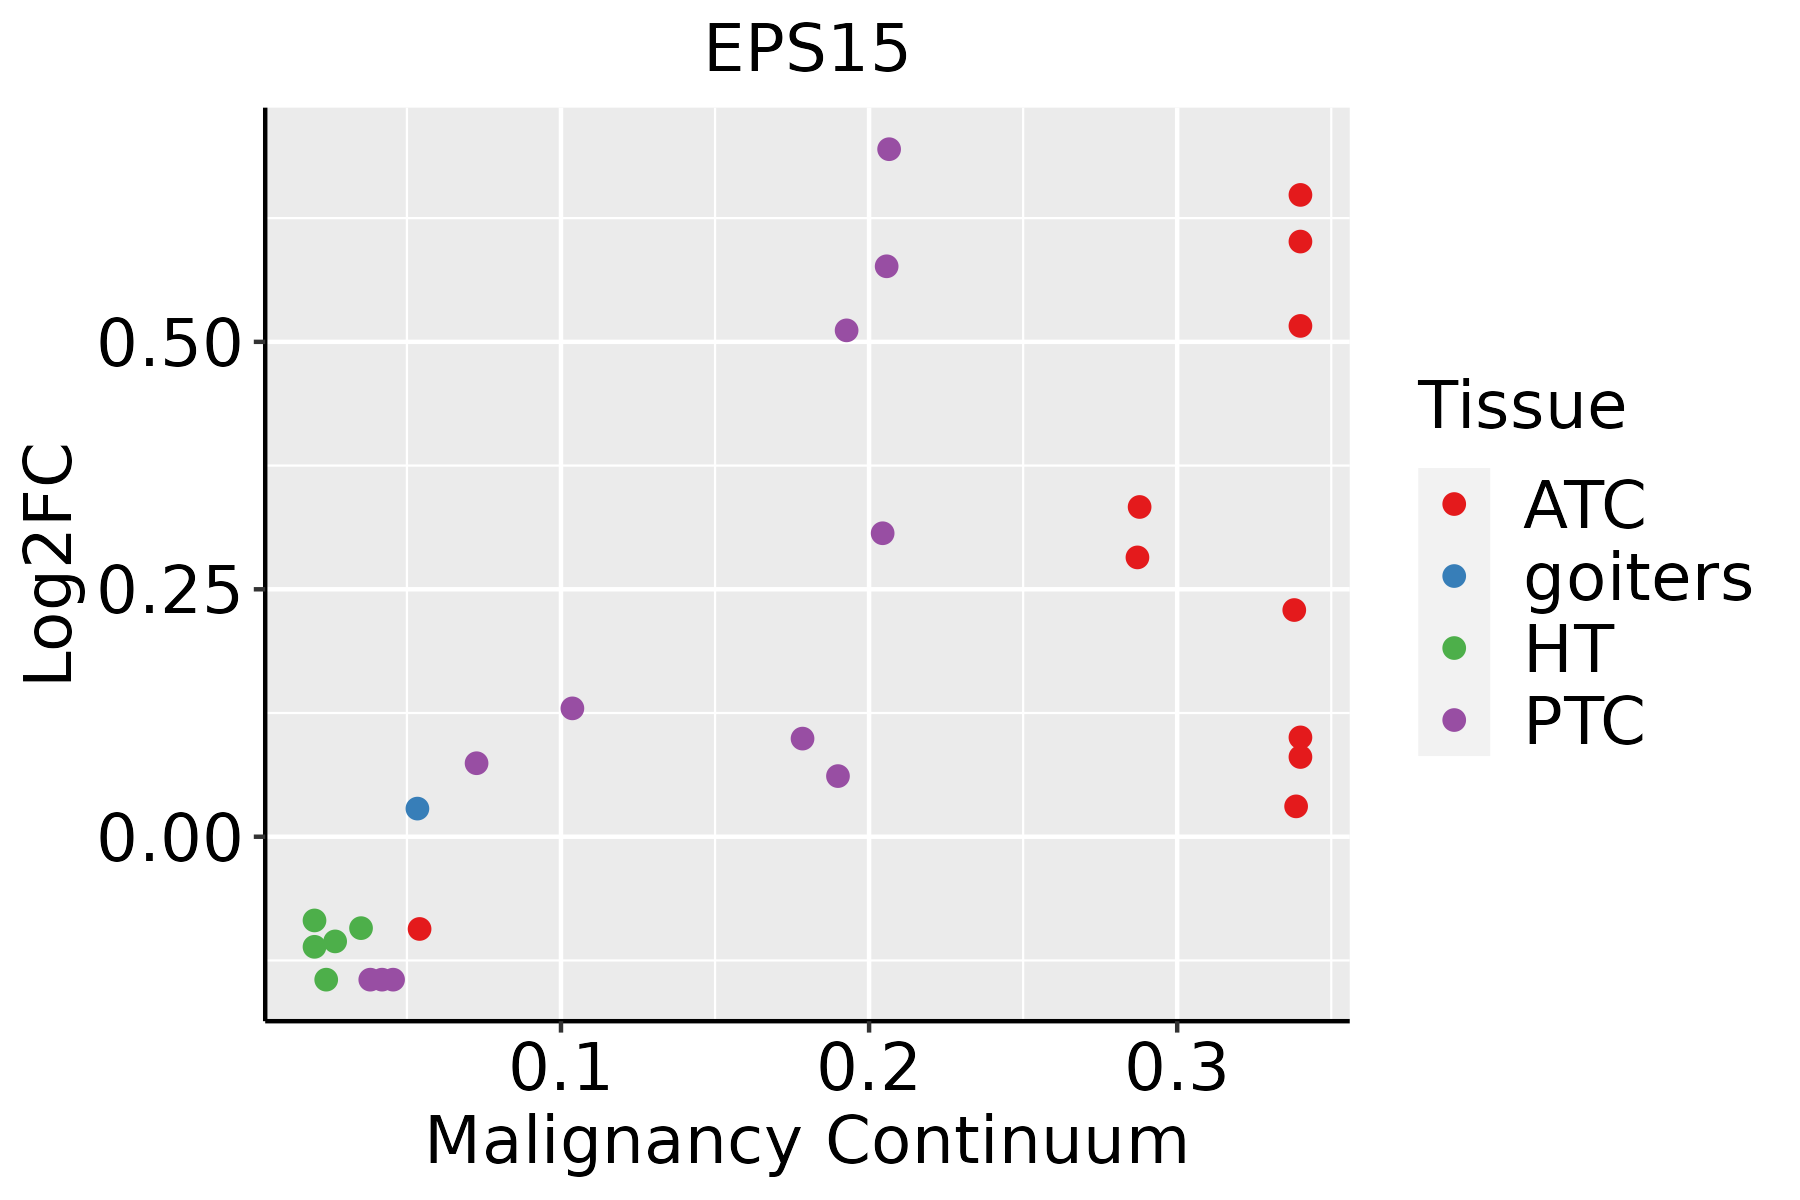 | ATC: Anaplastic thyroid cancer |
| HT: Hashimoto's thyroiditis | ||
| PTC: Papillary thyroid cancer |
| ∗log2FC in expression of this searched gene in stem-like cells from each diseased tissue sample relative to stem-like cells in normal samples in each tissue plotted against the malignancy continuum. Samples are colored based on if they are from different disease stage. |
Top |
Malignant transformation related pathway analysis |
| Find out the enriched GO biological processes and KEGG pathways involved in transition from healthy to precancer to cancer |
| Tissue | Disease Stage | Enriched GO biological Processes |
| Colorectum | AD |  |
| Colorectum | SER |  |
| Colorectum | MSS |  |
| Colorectum | MSI-H |  |
| Colorectum | FAP |  |
| ∗Top 15 enriched GO BP terms are showed in the bar plot of each disease state in each tissue. Each row represents a significant GO biological process which is colored according to the -log10(p.adjust). |
| Page: 1 2 3 4 5 6 7 8 9 |
| GO ID | Tissue | Disease Stage | Description | Gene Ratio | Bg Ratio | pvalue | p.adjust | Count |
| GO:001603210 | Cervix | CC | viral process | 109/2311 | 415/18723 | 5.40e-15 | 6.46e-12 | 109 |
| GO:001905810 | Cervix | CC | viral life cycle | 87/2311 | 317/18723 | 2.20e-13 | 1.20e-10 | 87 |
| GO:005212610 | Cervix | CC | movement in host environment | 52/2311 | 175/18723 | 7.03e-10 | 8.76e-08 | 52 |
| GO:004440910 | Cervix | CC | entry into host | 47/2311 | 151/18723 | 8.45e-10 | 1.03e-07 | 47 |
| GO:005170110 | Cervix | CC | biological process involved in interaction with host | 57/2311 | 203/18723 | 1.18e-09 | 1.41e-07 | 57 |
| GO:004671810 | Cervix | CC | viral entry into host cell | 44/2311 | 144/18723 | 5.47e-09 | 5.03e-07 | 44 |
| GO:004440310 | Cervix | CC | biological process involved in symbiotic interaction | 71/2311 | 290/18723 | 7.94e-09 | 6.98e-07 | 71 |
| GO:00068987 | Cervix | CC | receptor-mediated endocytosis | 53/2311 | 244/18723 | 2.52e-05 | 4.29e-04 | 53 |
| GO:00988767 | Cervix | CC | vesicle-mediated transport to the plasma membrane | 34/2311 | 136/18723 | 3.75e-05 | 5.91e-04 | 34 |
| GO:00068927 | Cervix | CC | post-Golgi vesicle-mediated transport | 28/2311 | 104/18723 | 4.31e-05 | 6.61e-04 | 28 |
| GO:00161977 | Cervix | CC | endosomal transport | 48/2311 | 230/18723 | 1.65e-04 | 1.97e-03 | 48 |
| GO:00481938 | Cervix | CC | Golgi vesicle transport | 58/2311 | 296/18723 | 2.24e-04 | 2.54e-03 | 58 |
| GO:00431127 | Cervix | CC | receptor metabolic process | 37/2311 | 166/18723 | 2.31e-04 | 2.58e-03 | 37 |
| GO:00160506 | Cervix | CC | vesicle organization | 54/2311 | 300/18723 | 2.71e-03 | 1.85e-02 | 54 |
| GO:00482686 | Cervix | CC | clathrin coat assembly | 7/2311 | 18/18723 | 3.99e-03 | 2.48e-02 | 7 |
| GO:00164827 | Cervix | CC | cytosolic transport | 33/2311 | 168/18723 | 4.43e-03 | 2.70e-02 | 33 |
| GO:00316236 | Cervix | CC | receptor internalization | 24/2311 | 113/18723 | 5.18e-03 | 3.05e-02 | 24 |
| GO:00447662 | Cervix | CC | multi-organism transport | 7/2311 | 21/18723 | 1.04e-02 | 4.97e-02 | 7 |
| GO:19025792 | Cervix | CC | multi-organism localization | 7/2311 | 21/18723 | 1.04e-02 | 4.97e-02 | 7 |
| GO:0016032 | Colorectum | AD | viral process | 168/3918 | 415/18723 | 4.67e-20 | 3.66e-17 | 168 |
| Page: 1 2 3 4 5 6 7 8 9 10 11 12 13 14 15 16 17 18 19 |
| Pathway ID | Tissue | Disease Stage | Description | Gene Ratio | Bg Ratio | pvalue | p.adjust | qvalue | Count |
| hsa0414418 | Cervix | CC | Endocytosis | 64/1267 | 251/8465 | 6.97e-06 | 6.10e-05 | 3.61e-05 | 64 |
| hsa0414419 | Cervix | CC | Endocytosis | 64/1267 | 251/8465 | 6.97e-06 | 6.10e-05 | 3.61e-05 | 64 |
| hsa04144 | Colorectum | AD | Endocytosis | 111/2092 | 251/8465 | 5.95e-12 | 1.42e-10 | 9.08e-11 | 111 |
| hsa041441 | Colorectum | AD | Endocytosis | 111/2092 | 251/8465 | 5.95e-12 | 1.42e-10 | 9.08e-11 | 111 |
| hsa041444 | Colorectum | MSS | Endocytosis | 102/1875 | 251/8465 | 1.85e-11 | 4.43e-10 | 2.71e-10 | 102 |
| hsa041445 | Colorectum | MSS | Endocytosis | 102/1875 | 251/8465 | 1.85e-11 | 4.43e-10 | 2.71e-10 | 102 |
| hsa041446 | Colorectum | FAP | Endocytosis | 78/1404 | 251/8465 | 6.20e-09 | 2.96e-07 | 1.80e-07 | 78 |
| hsa041447 | Colorectum | FAP | Endocytosis | 78/1404 | 251/8465 | 6.20e-09 | 2.96e-07 | 1.80e-07 | 78 |
| hsa041448 | Colorectum | CRC | Endocytosis | 65/1091 | 251/8465 | 1.27e-08 | 1.06e-06 | 7.19e-07 | 65 |
| hsa041449 | Colorectum | CRC | Endocytosis | 65/1091 | 251/8465 | 1.27e-08 | 1.06e-06 | 7.19e-07 | 65 |
| hsa0414420 | Endometrium | AEH | Endocytosis | 56/1197 | 251/8465 | 2.58e-04 | 2.15e-03 | 1.57e-03 | 56 |
| hsa04144110 | Endometrium | AEH | Endocytosis | 56/1197 | 251/8465 | 2.58e-04 | 2.15e-03 | 1.57e-03 | 56 |
| hsa0414424 | Endometrium | EEC | Endocytosis | 57/1237 | 251/8465 | 3.34e-04 | 2.82e-03 | 2.10e-03 | 57 |
| hsa0414434 | Endometrium | EEC | Endocytosis | 57/1237 | 251/8465 | 3.34e-04 | 2.82e-03 | 2.10e-03 | 57 |
| hsa04144210 | Esophagus | ESCC | Endocytosis | 186/4205 | 251/8465 | 9.74e-16 | 4.66e-14 | 2.39e-14 | 186 |
| hsa0414437 | Esophagus | ESCC | Endocytosis | 186/4205 | 251/8465 | 9.74e-16 | 4.66e-14 | 2.39e-14 | 186 |
| hsa0414422 | Liver | HCC | Endocytosis | 178/4020 | 251/8465 | 2.03e-14 | 5.22e-13 | 2.91e-13 | 178 |
| hsa0414432 | Liver | HCC | Endocytosis | 178/4020 | 251/8465 | 2.03e-14 | 5.22e-13 | 2.91e-13 | 178 |
| hsa0414414 | Lung | IAC | Endocytosis | 51/1053 | 251/8465 | 2.25e-04 | 2.54e-03 | 1.68e-03 | 51 |
| hsa0414415 | Lung | IAC | Endocytosis | 51/1053 | 251/8465 | 2.25e-04 | 2.54e-03 | 1.68e-03 | 51 |
| Page: 1 2 |
Top |
Cell-cell communication analysis |
| Identification of potential cell-cell interactions between two cell types and their ligand-receptor pairs for different disease states |
| Ligand | Receptor | LRpair | Pathway | Tissue | Disease Stage |
| Page: 1 |
Top |
Single-cell gene regulatory network inference analysis |
| Find out the significant the regulons (TFs) and the target genes of each regulon across cell types for different disease states |
| TF | Cell Type | Tissue | Disease Stage | Target Gene | RSS | Regulon Activity |
| ∗The dot plots of a searched regulon are shown for all cell subpopulations in each disease state of each tissue based on the regulon specific score inferred using pySCENIC and by calculating the average expression. |
| Page: 1 |
Top |
Somatic mutation of malignant transformation related genes |
| Annotation of somatic variants for genes involved in malignant transformation |
| Hugo Symbol | Variant Class | Variant Classification | dbSNP RS | HGVSc | HGVSp | HGVSp Short | SWISSPROT | BIOTYPE | SIFT | PolyPhen | Tumor Sample Barcode | Tissue | Histology | Sex | Age | Stage | Therapy Types | Drugs | Outcome |
| EPS15 | SNV | Missense_Mutation | c.932N>T | p.Ser311Leu | p.S311L | P42566 | protein_coding | deleterious(0) | benign(0.266) | TCGA-3C-AALI-01 | Breast | breast invasive carcinoma | Female | <65 | I/II | Unspecific | Poly E | Complete Response | |
| EPS15 | SNV | Missense_Mutation | c.742N>T | p.Val248Phe | p.V248F | P42566 | protein_coding | deleterious(0) | possibly_damaging(0.851) | TCGA-A7-A0DA-01 | Breast | breast invasive carcinoma | Female | <65 | I/II | Chemotherapy | adriamycin | SD | |
| EPS15 | SNV | Missense_Mutation | c.1931G>T | p.Gly644Val | p.G644V | P42566 | protein_coding | deleterious(0) | probably_damaging(0.964) | TCGA-AR-A1AT-01 | Breast | breast invasive carcinoma | Female | <65 | I/II | Hormone Therapy | anastrozole | SD | |
| EPS15 | SNV | Missense_Mutation | c.1903N>A | p.Pro635Thr | p.P635T | P42566 | protein_coding | deleterious(0) | probably_damaging(0.999) | TCGA-D8-A1XK-01 | Breast | breast invasive carcinoma | Female | <65 | I/II | Chemotherapy | doxorubicine+cyclophosphamide | SD | |
| EPS15 | SNV | Missense_Mutation | c.1278C>G | p.Ile426Met | p.I426M | P42566 | protein_coding | deleterious(0.01) | probably_damaging(0.949) | TCGA-EW-A1OV-01 | Breast | breast invasive carcinoma | Female | <65 | I/II | Chemotherapy | epirubicin | SD | |
| EPS15 | SNV | Missense_Mutation | novel | c.967T>C | p.Ser323Pro | p.S323P | P42566 | protein_coding | tolerated(0.07) | benign(0.001) | TCGA-OL-A66H-01 | Breast | breast invasive carcinoma | Female | >=65 | I/II | Unknown | Unknown | SD |
| EPS15 | insertion | Nonsense_Mutation | novel | c.671_672insCAAACCTTGTAATTTGAGATAGGTGGTGGTGTTTCTG | p.Glu224AspfsTer8 | p.E224Dfs*8 | P42566 | protein_coding | TCGA-A8-A06X-01 | Breast | breast invasive carcinoma | Female | >=65 | I/II | Unknown | Unknown | SD | ||
| EPS15 | insertion | Nonsense_Mutation | novel | c.2179_2180insAATTACCTTAATACTGGCCCTAACAACC | p.Phe727Ter | p.F727* | P42566 | protein_coding | TCGA-AR-A0U0-01 | Breast | breast invasive carcinoma | Female | >=65 | I/II | Unknown | Unknown | SD | ||
| EPS15 | SNV | Missense_Mutation | novel | c.1634G>A | p.Gly545Asp | p.G545D | P42566 | protein_coding | tolerated(0.13) | benign(0.225) | TCGA-2W-A8YY-01 | Cervix | cervical & endocervical cancer | Female | <65 | I/II | Chemotherapy | cisplatin | CR |
| EPS15 | SNV | Missense_Mutation | c.776N>G | p.Ser259Cys | p.S259C | P42566 | protein_coding | deleterious(0) | probably_damaging(0.999) | TCGA-C5-A1BJ-01 | Cervix | cervical & endocervical cancer | Female | <65 | I/II | Unknown | Unknown | SD |
| Page: 1 2 3 4 5 6 7 8 9 10 |
Top |
Related drugs of malignant transformation related genes |
| Identification of chemicals and drugs interact with genes involved in malignant transfromation |
| (DGIdb 4.0) |
| Entrez ID | Symbol | Category | Interaction Types | Drug Claim Name | Drug Name | PMIDs |
| Page: 1 |

Copyright 2023-Present -The University of Texas Health Science Center at Houston |