
|
|||||
|
 | |
| |
| |
| |
| |
| |
|
Gene: EPPK1 |
Gene summary for EPPK1 |
| Gene information | Species | Human | Gene symbol | EPPK1 | Gene ID | 83481 |
| Gene name | epiplakin 1 | |
| Gene Alias | EPIPL | |
| Cytomap | 8q24.3 | |
| Gene Type | protein-coding | GO ID | GO:0001667 | UniProtAcc | A0A087X1U6 |
Top |
Malignant transformation analysis |
| Identification of the aberrant gene expression in precancerous and cancerous lesions by comparing the gene expression of stem-like cells in diseased tissues with normal stem cells |
| Entrez ID | Symbol | Replicates | Species | Organ | Tissue | Adj P-value | Log2FC | Malignancy |
| 83481 | EPPK1 | HTA11_2487_2000001011 | Human | Colorectum | SER | 4.77e-02 | 2.34e-01 | -0.1808 |
| 83481 | EPPK1 | HTA11_1938_2000001011 | Human | Colorectum | AD | 2.65e-08 | 4.95e-01 | -0.0811 |
| 83481 | EPPK1 | HTA11_78_2000001011 | Human | Colorectum | AD | 6.17e-08 | 3.25e-01 | -0.1088 |
| 83481 | EPPK1 | HTA11_347_2000001011 | Human | Colorectum | AD | 1.10e-11 | 4.34e-01 | -0.1954 |
| 83481 | EPPK1 | HTA11_866_2000001011 | Human | Colorectum | AD | 3.87e-04 | 2.34e-01 | -0.1001 |
| 83481 | EPPK1 | HTA11_1391_2000001011 | Human | Colorectum | AD | 2.08e-16 | 5.93e-01 | -0.059 |
| 83481 | EPPK1 | HTA11_866_3004761011 | Human | Colorectum | AD | 3.30e-09 | 4.13e-01 | 0.096 |
| 83481 | EPPK1 | HTA11_10623_2000001011 | Human | Colorectum | AD | 1.37e-05 | 4.45e-01 | -0.0177 |
| 83481 | EPPK1 | HTA11_6801_2000001011 | Human | Colorectum | SER | 1.72e-03 | 5.56e-01 | 0.0171 |
| 83481 | EPPK1 | HTA11_7696_3000711011 | Human | Colorectum | AD | 1.27e-03 | 2.00e-01 | 0.0674 |
| 83481 | EPPK1 | HTA11_7469_2000001011 | Human | Colorectum | AD | 5.95e-03 | 4.52e-01 | -0.0124 |
| 83481 | EPPK1 | HTA11_6818_2000001021 | Human | Colorectum | AD | 1.14e-02 | 3.03e-01 | 0.0588 |
| 83481 | EPPK1 | HTA11_99999970781_79442 | Human | Colorectum | MSS | 1.85e-17 | 5.45e-01 | 0.294 |
| 83481 | EPPK1 | HTA11_99999965104_69814 | Human | Colorectum | MSS | 5.05e-05 | 2.99e-01 | 0.281 |
| 83481 | EPPK1 | HTA11_99999971662_82457 | Human | Colorectum | MSS | 2.62e-15 | 5.32e-01 | 0.3859 |
| 83481 | EPPK1 | HTA11_99999973899_84307 | Human | Colorectum | MSS | 3.83e-02 | 3.58e-01 | 0.2585 |
| 83481 | EPPK1 | HTA11_99999974143_84620 | Human | Colorectum | MSS | 8.29e-09 | 3.20e-01 | 0.3005 |
| 83481 | EPPK1 | CRC-3-11773 | Human | Colorectum | CRC | 3.04e-05 | 4.12e-01 | 0.2564 |
| 83481 | EPPK1 | LZE4T | Human | Esophagus | ESCC | 2.23e-04 | -2.14e-02 | 0.0811 |
| 83481 | EPPK1 | LZE5T | Human | Esophagus | ESCC | 2.32e-04 | 1.77e-01 | 0.0514 |
| Page: 1 2 3 4 |
| Tissue | Expression Dynamics | Abbreviation |
| Colorectum (GSE201348) | 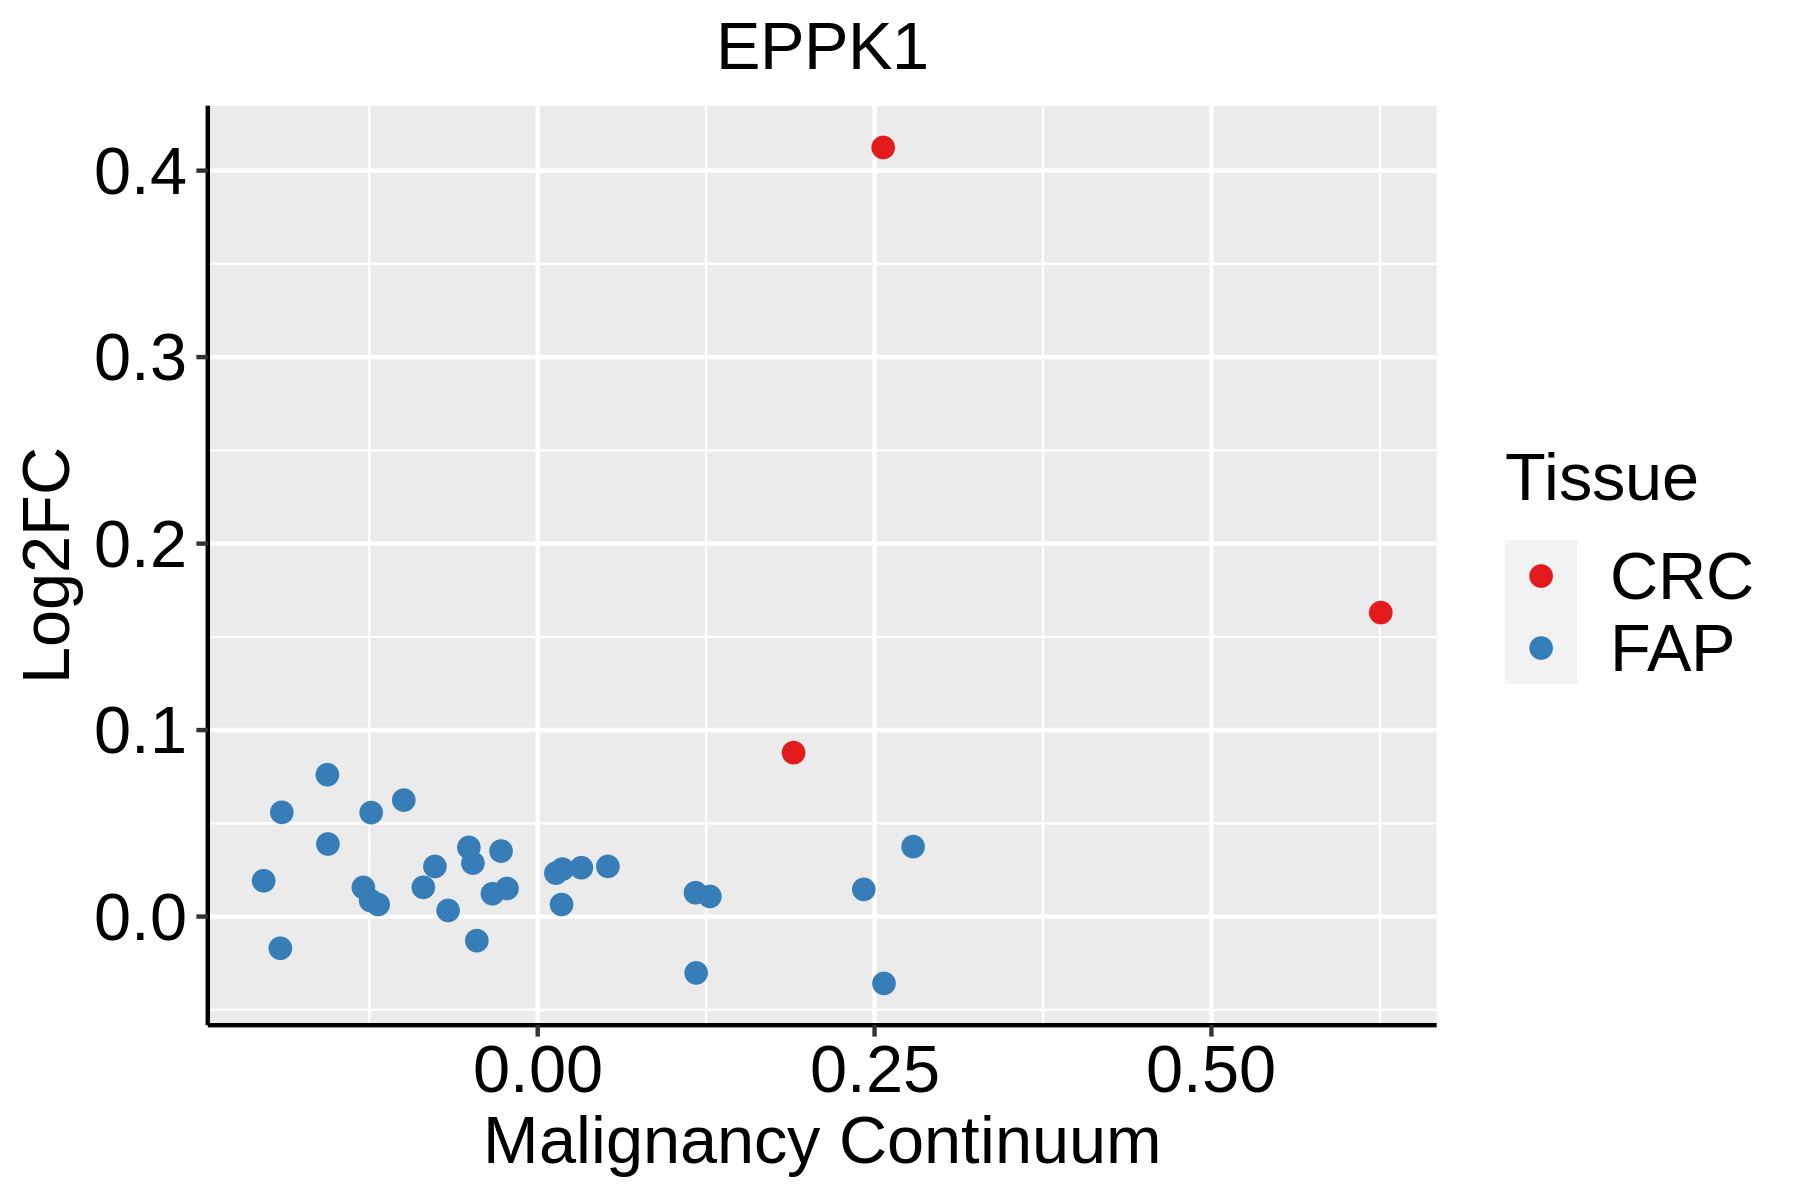 | FAP: Familial adenomatous polyposis |
| CRC: Colorectal cancer | ||
| Colorectum (HTA11) |  | AD: Adenomas |
| SER: Sessile serrated lesions | ||
| MSI-H: Microsatellite-high colorectal cancer | ||
| MSS: Microsatellite stable colorectal cancer | ||
| Esophagus | 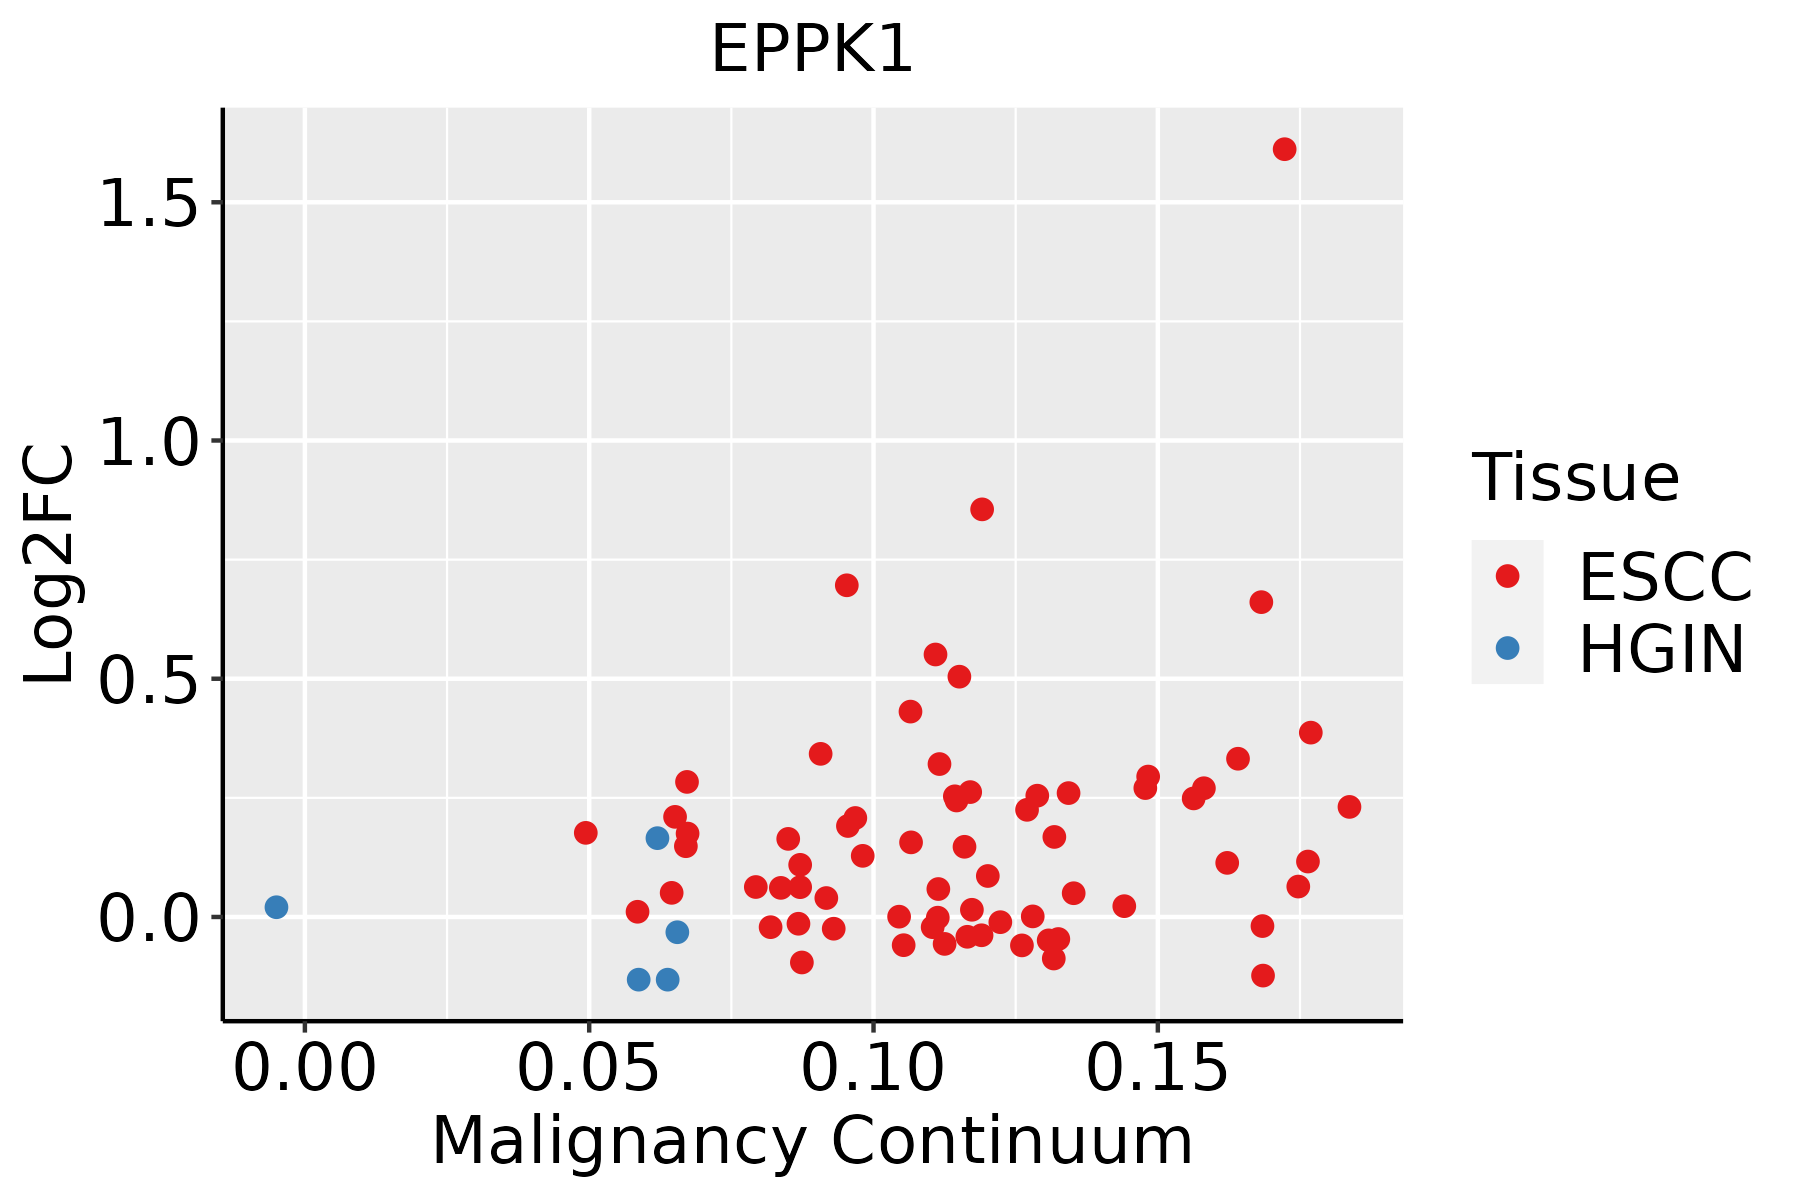 | ESCC: Esophageal squamous cell carcinoma |
| HGIN: High-grade intraepithelial neoplasias | ||
| LGIN: Low-grade intraepithelial neoplasias | ||
| Oral Cavity | 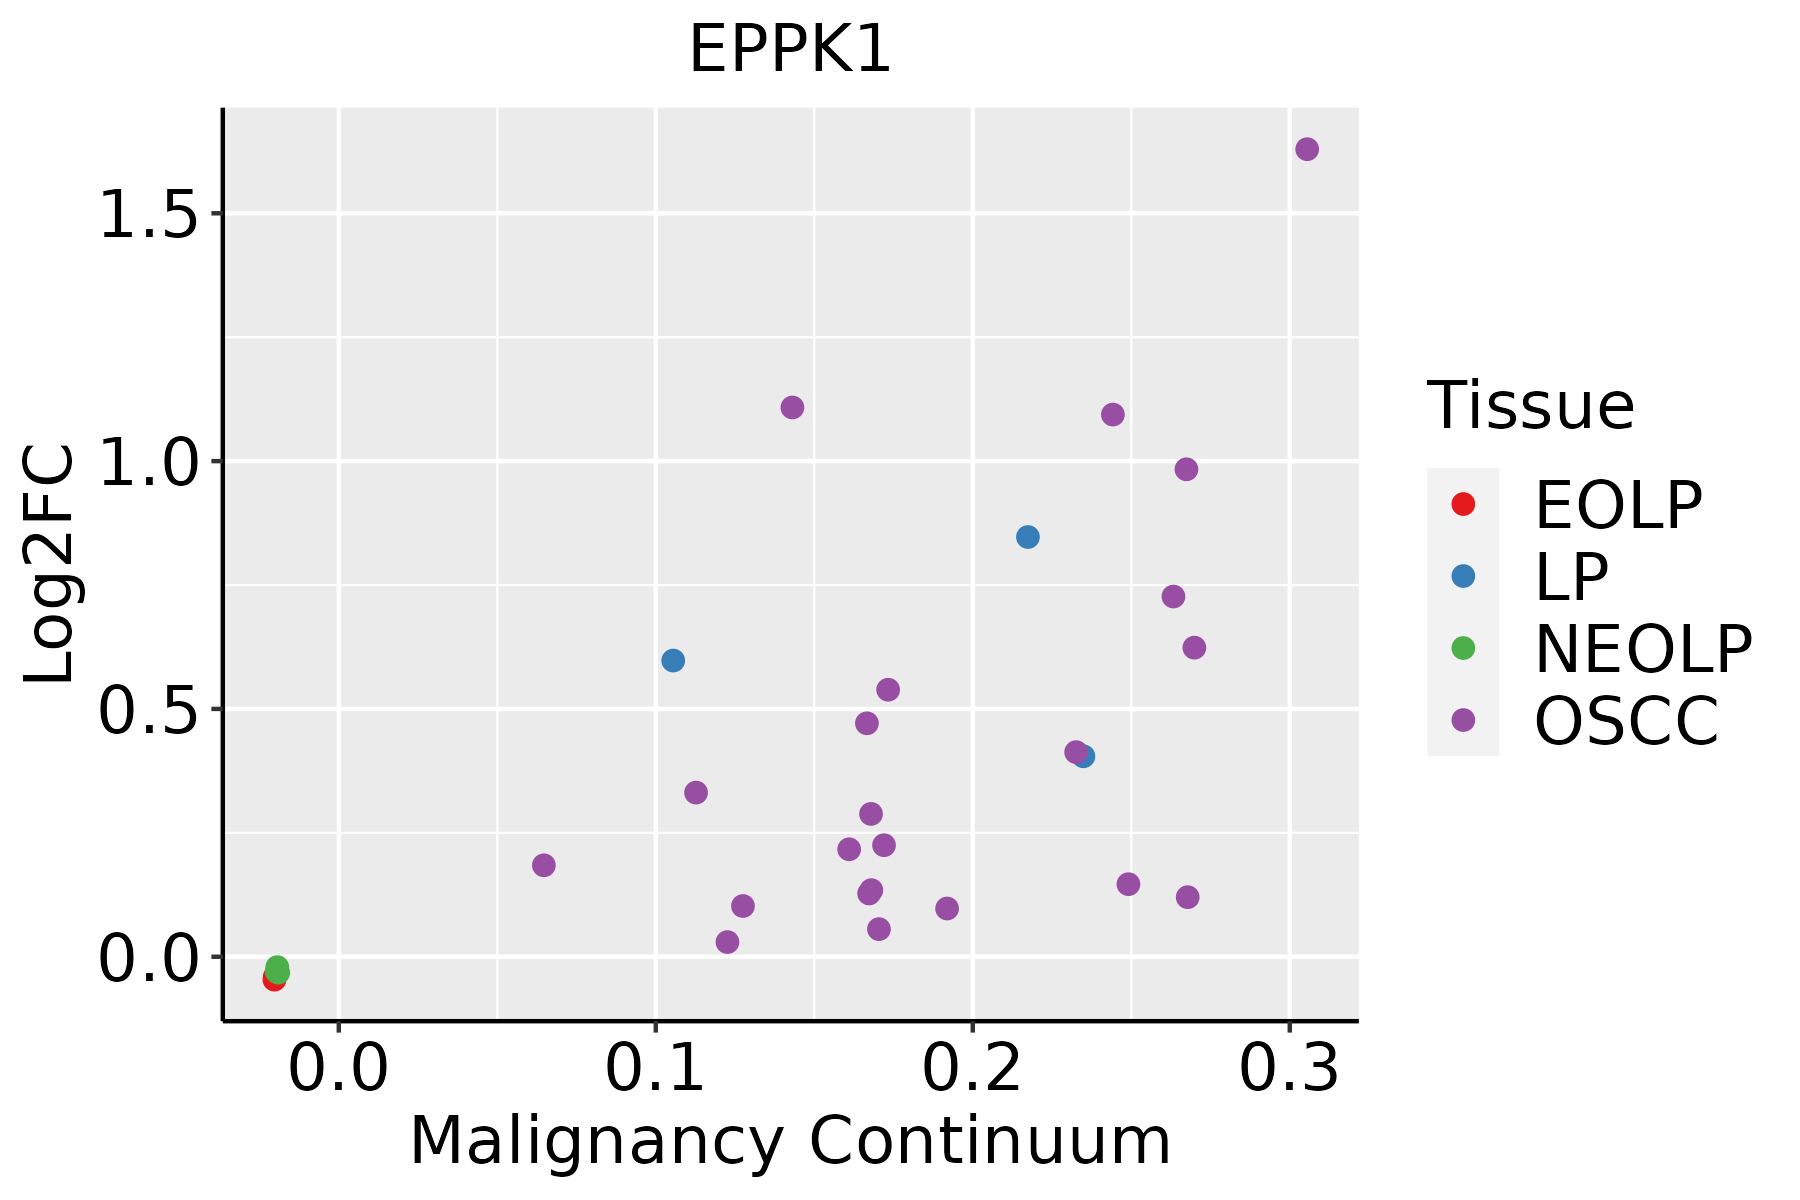 | EOLP: Erosive Oral lichen planus |
| LP: leukoplakia | ||
| NEOLP: Non-erosive oral lichen planus | ||
| OSCC: Oral squamous cell carcinoma | ||
| Skin | 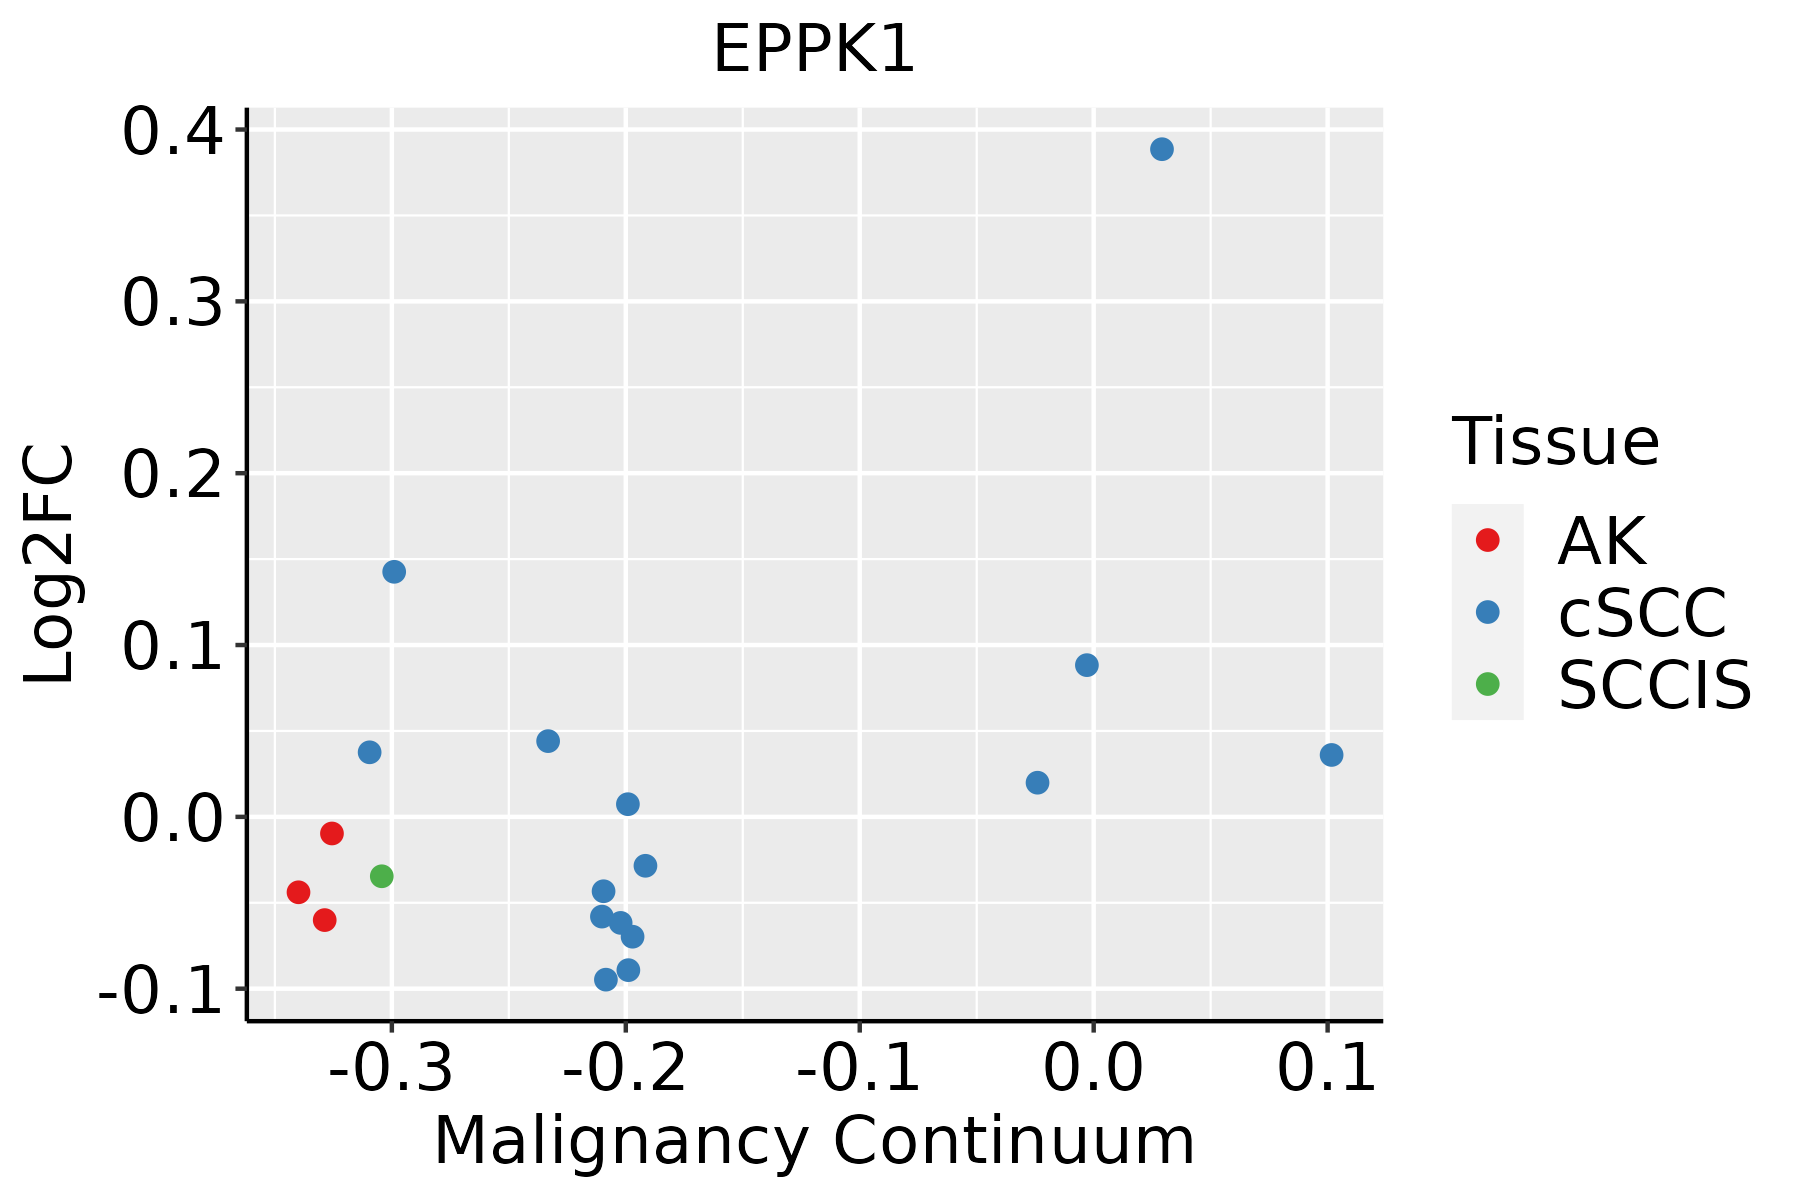 | AK: Actinic keratosis |
| cSCC: Cutaneous squamous cell carcinoma | ||
| SCCIS:squamous cell carcinoma in situ |
| ∗log2FC in expression of this searched gene in stem-like cells from each diseased tissue sample relative to stem-like cells in normal samples in each tissue plotted against the malignancy continuum. Samples are colored based on if they are from different disease stage. |
Top |
Malignant transformation related pathway analysis |
| Find out the enriched GO biological processes and KEGG pathways involved in transition from healthy to precancer to cancer |
| Tissue | Disease Stage | Enriched GO biological Processes |
| Colorectum | AD |  |
| Colorectum | SER |  |
| Colorectum | MSS |  |
| Colorectum | MSI-H |  |
| Colorectum | FAP |  |
| ∗Top 15 enriched GO BP terms are showed in the bar plot of each disease state in each tissue. Each row represents a significant GO biological process which is colored according to the -log10(p.adjust). |
| Page: 1 2 3 4 5 6 7 8 9 |
| GO ID | Tissue | Disease Stage | Description | Gene Ratio | Bg Ratio | pvalue | p.adjust | Count |
| GO:0042060 | Colorectum | AD | wound healing | 128/3918 | 422/18723 | 2.73e-06 | 7.89e-05 | 128 |
| GO:0001667 | Colorectum | AD | ameboidal-type cell migration | 137/3918 | 475/18723 | 2.17e-05 | 4.33e-04 | 137 |
| GO:0090132 | Colorectum | AD | epithelium migration | 105/3918 | 360/18723 | 1.18e-04 | 1.73e-03 | 105 |
| GO:0010632 | Colorectum | AD | regulation of epithelial cell migration | 88/3918 | 292/18723 | 1.19e-04 | 1.75e-03 | 88 |
| GO:0010631 | Colorectum | AD | epithelial cell migration | 104/3918 | 357/18723 | 1.33e-04 | 1.90e-03 | 104 |
| GO:0090130 | Colorectum | AD | tissue migration | 105/3918 | 365/18723 | 2.10e-04 | 2.77e-03 | 105 |
| GO:0050673 | Colorectum | AD | epithelial cell proliferation | 119/3918 | 437/18723 | 8.75e-04 | 8.51e-03 | 119 |
| GO:0043616 | Colorectum | AD | keratinocyte proliferation | 19/3918 | 46/18723 | 1.36e-03 | 1.19e-02 | 19 |
| GO:0048638 | Colorectum | AD | regulation of developmental growth | 92/3918 | 330/18723 | 1.48e-03 | 1.25e-02 | 92 |
| GO:0010837 | Colorectum | AD | regulation of keratinocyte proliferation | 15/3918 | 35/18723 | 2.78e-03 | 2.09e-02 | 15 |
| GO:00420601 | Colorectum | SER | wound healing | 97/2897 | 422/18723 | 2.69e-05 | 7.30e-04 | 97 |
| GO:00016671 | Colorectum | SER | ameboidal-type cell migration | 105/2897 | 475/18723 | 6.97e-05 | 1.59e-03 | 105 |
| GO:00901321 | Colorectum | SER | epithelium migration | 82/2897 | 360/18723 | 1.50e-04 | 2.93e-03 | 82 |
| GO:00106311 | Colorectum | SER | epithelial cell migration | 81/2897 | 357/18723 | 1.87e-04 | 3.44e-03 | 81 |
| GO:00901301 | Colorectum | SER | tissue migration | 82/2897 | 365/18723 | 2.40e-04 | 4.12e-03 | 82 |
| GO:00106321 | Colorectum | SER | regulation of epithelial cell migration | 68/2897 | 292/18723 | 2.72e-04 | 4.53e-03 | 68 |
| GO:0061041 | Colorectum | SER | regulation of wound healing | 33/2897 | 134/18723 | 3.78e-03 | 3.13e-02 | 33 |
| GO:1903034 | Colorectum | SER | regulation of response to wounding | 39/2897 | 167/18723 | 4.73e-03 | 3.72e-02 | 39 |
| GO:00420602 | Colorectum | MSS | wound healing | 119/3467 | 422/18723 | 5.93e-07 | 2.24e-05 | 119 |
| GO:00436161 | Colorectum | MSS | keratinocyte proliferation | 20/3467 | 46/18723 | 8.26e-05 | 1.35e-03 | 20 |
| Page: 1 2 3 4 |
| Pathway ID | Tissue | Disease Stage | Description | Gene Ratio | Bg Ratio | pvalue | p.adjust | qvalue | Count |
| Page: 1 |
Top |
Cell-cell communication analysis |
| Identification of potential cell-cell interactions between two cell types and their ligand-receptor pairs for different disease states |
| Ligand | Receptor | LRpair | Pathway | Tissue | Disease Stage |
| Page: 1 |
Top |
Single-cell gene regulatory network inference analysis |
| Find out the significant the regulons (TFs) and the target genes of each regulon across cell types for different disease states |
| TF | Cell Type | Tissue | Disease Stage | Target Gene | RSS | Regulon Activity |
| ∗The dot plots of a searched regulon are shown for all cell subpopulations in each disease state of each tissue based on the regulon specific score inferred using pySCENIC and by calculating the average expression. |
| Page: 1 |
Top |
Somatic mutation of malignant transformation related genes |
| Annotation of somatic variants for genes involved in malignant transformation |
| Hugo Symbol | Variant Class | Variant Classification | dbSNP RS | HGVSc | HGVSp | HGVSp Short | SWISSPROT | BIOTYPE | SIFT | PolyPhen | Tumor Sample Barcode | Tissue | Histology | Sex | Age | Stage | Therapy Types | Drugs | Outcome |
| EPPK1 | SNV | Missense_Mutation | novel | c.15259C>G | p.Leu5087Val | p.L5087V | protein_coding | tolerated_low_confidence(0.63) | benign(0.14) | TCGA-A1-A0SI-01 | Breast | breast invasive carcinoma | Female | <65 | I/II | Unknown | Unknown | SD | |
| EPPK1 | SNV | Missense_Mutation | rs781870609 | c.5539N>A | p.Val1847Met | p.V1847M | protein_coding | deleterious(0.03) | benign(0.177) | TCGA-A2-A0YG-01 | Breast | breast invasive carcinoma | Female | <65 | III/IV | Chemotherapy | cytoxan | SD | |
| EPPK1 | SNV | Missense_Mutation | novel | c.2611G>C | p.Glu871Gln | p.E871Q | protein_coding | deleterious(0.01) | possibly_damaging(0.663) | TCGA-AC-A5XS-01 | Breast | breast invasive carcinoma | Female | >=65 | I/II | Hormone Therapy | femara | SD | |
| EPPK1 | SNV | Missense_Mutation | rs781930002 | c.15098N>A | p.Arg5033His | p.R5033H | protein_coding | deleterious(0.02) | possibly_damaging(0.826) | TCGA-AO-A128-01 | Breast | breast invasive carcinoma | Female | <65 | I/II | Chemotherapy | doxorubicin | SD | |
| EPPK1 | SNV | Missense_Mutation | rs782690497 | c.15109N>A | p.Asp5037Asn | p.D5037N | protein_coding | tolerated(0.1) | probably_damaging(0.911) | TCGA-B6-A0RH-01 | Breast | breast invasive carcinoma | Female | <65 | I/II | Unknown | Unknown | PD | |
| EPPK1 | SNV | Missense_Mutation | novel | c.3242N>G | p.Ser1081Cys | p.S1081C | protein_coding | deleterious(0.04) | benign(0.011) | TCGA-C8-A12Q-01 | Breast | breast invasive carcinoma | Female | >=65 | III/IV | Unknown | Unknown | PD | |
| EPPK1 | SNV | Missense_Mutation | rs372213876 | c.5620C>T | p.Arg1874Cys | p.R1874C | protein_coding | tolerated(0.2) | benign(0.001) | TCGA-E2-A1B4-01 | Breast | breast invasive carcinoma | Female | >=65 | III/IV | Hormone Therapy | arimidex | SD | |
| EPPK1 | SNV | Missense_Mutation | novel | c.2234N>C | p.Arg745Pro | p.R745P | protein_coding | deleterious(0.01) | benign(0.224) | TCGA-E2-A1IU-01 | Breast | breast invasive carcinoma | Female | <65 | I/II | Hormone Therapy | arimidex | SD | |
| EPPK1 | deletion | Frame_Shift_Del | novel | c.6044delN | p.Gly2015ValfsTer36 | p.G2015Vfs*36 | protein_coding | TCGA-D8-A1Y1-01 | Breast | breast invasive carcinoma | Female | >=65 | III/IV | Hormone Therapy | tamoxiphen | PD | |||
| EPPK1 | deletion | Frame_Shift_Del | novel | c.3492delC | p.Asp1164GlufsTer13 | p.D1164Efs*13 | protein_coding | TCGA-EW-A2FV-01 | Breast | breast invasive carcinoma | Female | <65 | III/IV | Chemotherapy | docetaxel | SD |
| Page: 1 2 3 4 5 6 7 8 9 10 11 12 13 14 15 16 17 18 19 20 21 22 |
Top |
Related drugs of malignant transformation related genes |
| Identification of chemicals and drugs interact with genes involved in malignant transfromation |
| (DGIdb 4.0) |
| Entrez ID | Symbol | Category | Interaction Types | Drug Claim Name | Drug Name | PMIDs |
| Page: 1 |

Copyright 2023-Present -The University of Texas Health Science Center at Houston |