
|
|||||
|
 | |
| |
| |
| |
| |
| |
|
Gene: EPO |
Gene summary for EPO |
| Gene information | Species | Human | Gene symbol | EPO | Gene ID | 2056 |
| Gene name | erythropoietin | |
| Gene Alias | DBAL | |
| Cytomap | 7q22.1 | |
| Gene Type | protein-coding | GO ID | GO:0000003 | UniProtAcc | G9JKG7 |
Top |
Malignant transformation analysis |
| Identification of the aberrant gene expression in precancerous and cancerous lesions by comparing the gene expression of stem-like cells in diseased tissues with normal stem cells |
| Entrez ID | Symbol | Replicates | Species | Organ | Tissue | Adj P-value | Log2FC | Malignancy |
| 2056 | EPO | HCC1_Meng | Human | Liver | HCC | 5.37e-17 | 1.34e-01 | 0.0246 |
| 2056 | EPO | S027 | Human | Liver | HCC | 4.18e-09 | 2.07e+00 | 0.2446 |
| 2056 | EPO | S028 | Human | Liver | HCC | 1.67e-05 | 5.13e-01 | 0.2503 |
| 2056 | EPO | S029 | Human | Liver | HCC | 5.29e-11 | 1.41e+00 | 0.2581 |
| Page: 1 |
| Tissue | Expression Dynamics | Abbreviation |
| Liver | 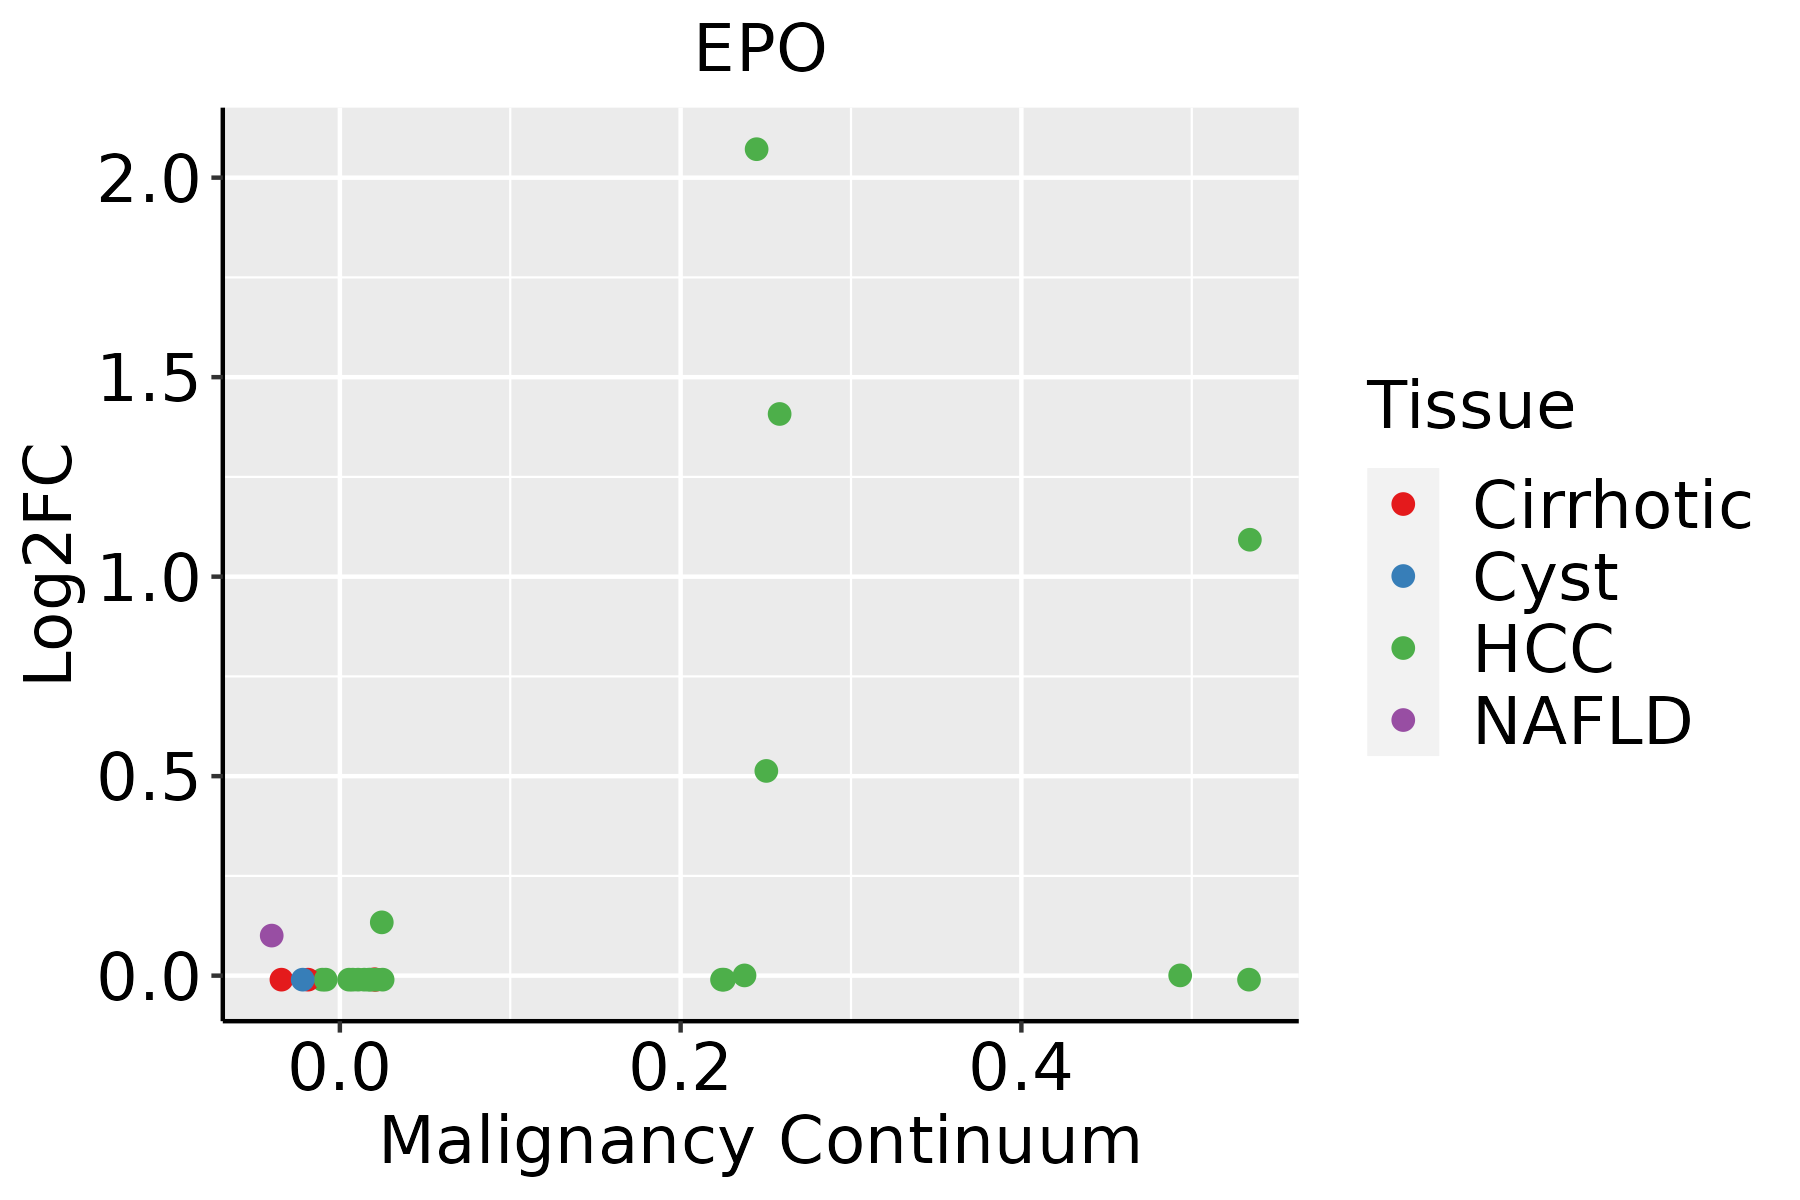 | HCC: Hepatocellular carcinoma |
| NAFLD: Non-alcoholic fatty liver disease |
| ∗log2FC in expression of this searched gene in stem-like cells from each diseased tissue sample relative to stem-like cells in normal samples in each tissue plotted against the malignancy continuum. Samples are colored based on if they are from different disease stage. |
Top |
Malignant transformation related pathway analysis |
| Find out the enriched GO biological processes and KEGG pathways involved in transition from healthy to precancer to cancer |
| Tissue | Disease Stage | Enriched GO biological Processes |
| Colorectum | AD |  |
| Colorectum | SER |  |
| Colorectum | MSS |  |
| Colorectum | MSI-H |  |
| Colorectum | FAP |  |
| ∗Top 15 enriched GO BP terms are showed in the bar plot of each disease state in each tissue. Each row represents a significant GO biological process which is colored according to the -log10(p.adjust). |
| Page: 1 2 3 4 5 6 7 8 9 |
| GO ID | Tissue | Disease Stage | Description | Gene Ratio | Bg Ratio | pvalue | p.adjust | Count |
| GO:006219722 | Liver | HCC | cellular response to chemical stress | 216/7958 | 337/18723 | 6.86e-16 | 5.44e-14 | 216 |
| GO:200123322 | Liver | HCC | regulation of apoptotic signaling pathway | 226/7958 | 356/18723 | 7.26e-16 | 5.68e-14 | 226 |
| GO:009719322 | Liver | HCC | intrinsic apoptotic signaling pathway | 184/7958 | 288/18723 | 1.50e-13 | 8.32e-12 | 184 |
| GO:003166722 | Liver | HCC | response to nutrient levels | 276/7958 | 474/18723 | 2.30e-12 | 1.08e-10 | 276 |
| GO:004854522 | Liver | HCC | response to steroid hormone | 206/7958 | 339/18723 | 6.81e-12 | 2.92e-10 | 206 |
| GO:200123412 | Liver | HCC | negative regulation of apoptotic signaling pathway | 145/7958 | 224/18723 | 1.33e-11 | 5.36e-10 | 145 |
| GO:200124212 | Liver | HCC | regulation of intrinsic apoptotic signaling pathway | 109/7958 | 164/18723 | 4.52e-10 | 1.45e-08 | 109 |
| GO:000758421 | Liver | HCC | response to nutrient | 111/7958 | 174/18723 | 1.10e-08 | 2.73e-07 | 111 |
| GO:190165422 | Liver | HCC | response to ketone | 119/7958 | 194/18723 | 8.65e-08 | 1.72e-06 | 119 |
| GO:007099722 | Liver | HCC | neuron death | 202/7958 | 361/18723 | 1.44e-07 | 2.70e-06 | 202 |
| GO:200124312 | Liver | HCC | negative regulation of intrinsic apoptotic signaling pathway | 67/7958 | 98/18723 | 1.97e-07 | 3.55e-06 | 67 |
| GO:190121412 | Liver | HCC | regulation of neuron death | 179/7958 | 319/18723 | 5.65e-07 | 9.01e-06 | 179 |
| GO:000726521 | Liver | HCC | Ras protein signal transduction | 187/7958 | 337/18723 | 8.89e-07 | 1.35e-05 | 187 |
| GO:000166612 | Liver | HCC | response to hypoxia | 172/7958 | 307/18723 | 1.06e-06 | 1.59e-05 | 172 |
| GO:003629312 | Liver | HCC | response to decreased oxygen levels | 179/7958 | 322/18723 | 1.29e-06 | 1.87e-05 | 179 |
| GO:007048212 | Liver | HCC | response to oxygen levels | 191/7958 | 347/18723 | 1.42e-06 | 2.03e-05 | 191 |
| GO:007121421 | Liver | HCC | cellular response to abiotic stimulus | 183/7958 | 331/18723 | 1.59e-06 | 2.26e-05 | 183 |
| GO:010400421 | Liver | HCC | cellular response to environmental stimulus | 183/7958 | 331/18723 | 1.59e-06 | 2.26e-05 | 183 |
| GO:003134611 | Liver | HCC | positive regulation of cell projection organization | 193/7958 | 353/18723 | 2.28e-06 | 3.08e-05 | 193 |
| GO:000756822 | Liver | HCC | aging | 185/7958 | 339/18723 | 4.28e-06 | 5.50e-05 | 185 |
| Page: 1 2 3 4 |
| Pathway ID | Tissue | Disease Stage | Description | Gene Ratio | Bg Ratio | pvalue | p.adjust | qvalue | Count |
| hsa0406622 | Liver | HCC | HIF-1 signaling pathway | 70/4020 | 109/8465 | 2.96e-04 | 1.36e-03 | 7.57e-04 | 70 |
| hsa0406632 | Liver | HCC | HIF-1 signaling pathway | 70/4020 | 109/8465 | 2.96e-04 | 1.36e-03 | 7.57e-04 | 70 |
| Page: 1 |
Top |
Cell-cell communication analysis |
| Identification of potential cell-cell interactions between two cell types and their ligand-receptor pairs for different disease states |
| Ligand | Receptor | LRpair | Pathway | Tissue | Disease Stage |
| Page: 1 |
Top |
Single-cell gene regulatory network inference analysis |
| Find out the significant the regulons (TFs) and the target genes of each regulon across cell types for different disease states |
| TF | Cell Type | Tissue | Disease Stage | Target Gene | RSS | Regulon Activity |
| ∗The dot plots of a searched regulon are shown for all cell subpopulations in each disease state of each tissue based on the regulon specific score inferred using pySCENIC and by calculating the average expression. |
| Page: 1 |
Top |
Somatic mutation of malignant transformation related genes |
| Annotation of somatic variants for genes involved in malignant transformation |
| Hugo Symbol | Variant Class | Variant Classification | dbSNP RS | HGVSc | HGVSp | HGVSp Short | SWISSPROT | BIOTYPE | SIFT | PolyPhen | Tumor Sample Barcode | Tissue | Histology | Sex | Age | Stage | Therapy Types | Drugs | Outcome |
| EPO | SNV | Missense_Mutation | c.246G>T | p.Glu82Asp | p.E82D | P01588 | protein_coding | tolerated(0.33) | benign(0.001) | TCGA-AP-A051-01 | Endometrium | uterine corpus endometrioid carcinoma | Female | >=65 | I/II | Unknown | Unknown | SD | |
| EPO | SNV | Missense_Mutation | novel | c.92N>A | p.Arg31His | p.R31H | P01588 | protein_coding | tolerated(0.1) | benign(0) | TCGA-AP-A1DV-01 | Endometrium | uterine corpus endometrioid carcinoma | Female | <65 | I/II | Unknown | Unknown | SD |
| EPO | SNV | Missense_Mutation | c.529N>T | p.Arg177Trp | p.R177W | P01588 | protein_coding | deleterious(0) | probably_damaging(1) | TCGA-AX-A1C8-01 | Endometrium | uterine corpus endometrioid carcinoma | Female | >=65 | III/IV | Unspecific | Carboplatin | SD | |
| EPO | SNV | Missense_Mutation | rs750589543 | c.91N>T | p.Arg31Cys | p.R31C | P01588 | protein_coding | deleterious(0) | possibly_damaging(0.542) | TCGA-AX-A1CE-01 | Endometrium | uterine corpus endometrioid carcinoma | Female | <65 | I/II | Unspecific | Paclitaxel | SD |
| EPO | SNV | Missense_Mutation | rs765261245 | c.293C>T | p.Ser98Leu | p.S98L | P01588 | protein_coding | deleterious(0) | benign(0.053) | TCGA-AX-A2HC-01 | Endometrium | uterine corpus endometrioid carcinoma | Female | <65 | III/IV | Chemotherapy | paclitaxel | PD |
| EPO | SNV | Missense_Mutation | novel | c.92N>A | p.Arg31His | p.R31H | P01588 | protein_coding | tolerated(0.1) | benign(0) | TCGA-AX-A2HD-01 | Endometrium | uterine corpus endometrioid carcinoma | Female | >=65 | III/IV | Unknown | Unknown | SD |
| EPO | SNV | Missense_Mutation | novel | c.22N>A | p.Ala8Thr | p.A8T | P01588 | protein_coding | tolerated_low_confidence(0.5) | benign(0.003) | TCGA-D1-A1O7-01 | Endometrium | uterine corpus endometrioid carcinoma | Female | <65 | I/II | Unknown | Unknown | SD |
| EPO | SNV | Missense_Mutation | novel | c.466N>T | p.Pro156Ser | p.P156S | P01588 | protein_coding | tolerated(0.07) | possibly_damaging(0.8) | TCGA-78-7537-01 | Lung | lung adenocarcinoma | Male | >=65 | I/II | Unknown | Unknown | SD |
| EPO | SNV | Missense_Mutation | novel | c.526N>A | p.Leu176Ile | p.L176I | P01588 | protein_coding | deleterious(0.03) | benign(0.238) | TCGA-86-8673-01 | Lung | lung adenocarcinoma | Male | <65 | I/II | Unknown | Unknown | PD |
| EPO | SNV | Missense_Mutation | novel | c.527N>A | p.Leu176His | p.L176H | P01588 | protein_coding | deleterious(0) | probably_damaging(0.998) | TCGA-86-8673-01 | Lung | lung adenocarcinoma | Male | <65 | I/II | Unknown | Unknown | PD |
| Page: 1 2 |
Top |
Related drugs of malignant transformation related genes |
| Identification of chemicals and drugs interact with genes involved in malignant transfromation |
| (DGIdb 4.0) |
| Entrez ID | Symbol | Category | Interaction Types | Drug Claim Name | Drug Name | PMIDs |
| 2056 | EPO | HORMONE ACTIVITY, CELL SURFACE, DRUGGABLE GENOME | ALPHA INTERFERON | CETUXIMAB | 2016633 | |
| 2056 | EPO | HORMONE ACTIVITY, CELL SURFACE, DRUGGABLE GENOME | MYCOPHENOLATE MOFETIL | 11750393 | ||
| 2056 | EPO | HORMONE ACTIVITY, CELL SURFACE, DRUGGABLE GENOME | INTERLEUKIN-1-ALPHA | 8321378 | ||
| 2056 | EPO | HORMONE ACTIVITY, CELL SURFACE, DRUGGABLE GENOME | ARSENIC TRIOXIDE | 15690072 | ||
| 2056 | EPO | HORMONE ACTIVITY, CELL SURFACE, DRUGGABLE GENOME | OXYMETHOLONE | OXYMETHOLONE | 1009362 | |
| 2056 | EPO | HORMONE ACTIVITY, CELL SURFACE, DRUGGABLE GENOME | HUMAN CHORIONIC GONADOTROPIN | 11585432 | ||
| 2056 | EPO | HORMONE ACTIVITY, CELL SURFACE, DRUGGABLE GENOME | MK-2578 | |||
| 2056 | EPO | HORMONE ACTIVITY, CELL SURFACE, DRUGGABLE GENOME | GC-1113 | |||
| 2056 | EPO | HORMONE ACTIVITY, CELL SURFACE, DRUGGABLE GENOME | Long-acting erythropoietin conjugate | |||
| 2056 | EPO | HORMONE ACTIVITY, CELL SURFACE, DRUGGABLE GENOME | Erythropoietin-transfected autologous cell therapy |
| Page: 1 2 |

Copyright 2023-Present -The University of Texas Health Science Center at Houston |