
|
|||||
|
 | |
| |
| |
| |
| |
| |
|
Gene: EPN3 |
Gene summary for EPN3 |
| Gene information | Species | Human | Gene symbol | EPN3 | Gene ID | 55040 |
| Gene name | epsin 3 | |
| Gene Alias | EPN3 | |
| Cytomap | 17q21.33 | |
| Gene Type | protein-coding | GO ID | GO:0006810 | UniProtAcc | Q9H201 |
Top |
Malignant transformation analysis |
| Identification of the aberrant gene expression in precancerous and cancerous lesions by comparing the gene expression of stem-like cells in diseased tissues with normal stem cells |
| Entrez ID | Symbol | Replicates | Species | Organ | Tissue | Adj P-value | Log2FC | Malignancy |
| 55040 | EPN3 | LZE24T | Human | Esophagus | ESCC | 1.10e-04 | 2.21e-01 | 0.0596 |
| 55040 | EPN3 | LZE21T | Human | Esophagus | ESCC | 3.16e-02 | 1.71e-01 | 0.0655 |
| 55040 | EPN3 | P1T-E | Human | Esophagus | ESCC | 9.51e-05 | 2.84e-01 | 0.0875 |
| 55040 | EPN3 | P2T-E | Human | Esophagus | ESCC | 2.86e-04 | 1.01e-01 | 0.1177 |
| 55040 | EPN3 | P4T-E | Human | Esophagus | ESCC | 2.71e-13 | 3.17e-01 | 0.1323 |
| 55040 | EPN3 | P5T-E | Human | Esophagus | ESCC | 5.66e-05 | 1.51e-01 | 0.1327 |
| 55040 | EPN3 | P8T-E | Human | Esophagus | ESCC | 1.20e-29 | 5.39e-01 | 0.0889 |
| 55040 | EPN3 | P9T-E | Human | Esophagus | ESCC | 7.69e-03 | 9.69e-02 | 0.1131 |
| 55040 | EPN3 | P10T-E | Human | Esophagus | ESCC | 1.31e-03 | 4.63e-02 | 0.116 |
| 55040 | EPN3 | P12T-E | Human | Esophagus | ESCC | 3.49e-12 | 2.78e-01 | 0.1122 |
| 55040 | EPN3 | P15T-E | Human | Esophagus | ESCC | 2.64e-10 | 2.73e-01 | 0.1149 |
| 55040 | EPN3 | P16T-E | Human | Esophagus | ESCC | 1.62e-03 | 7.64e-02 | 0.1153 |
| 55040 | EPN3 | P20T-E | Human | Esophagus | ESCC | 1.01e-06 | 1.10e-01 | 0.1124 |
| 55040 | EPN3 | P21T-E | Human | Esophagus | ESCC | 6.00e-15 | 1.62e-01 | 0.1617 |
| 55040 | EPN3 | P22T-E | Human | Esophagus | ESCC | 2.24e-10 | 1.95e-01 | 0.1236 |
| 55040 | EPN3 | P23T-E | Human | Esophagus | ESCC | 7.78e-09 | 2.59e-01 | 0.108 |
| 55040 | EPN3 | P24T-E | Human | Esophagus | ESCC | 2.88e-03 | 9.82e-02 | 0.1287 |
| 55040 | EPN3 | P26T-E | Human | Esophagus | ESCC | 1.41e-15 | 3.28e-01 | 0.1276 |
| 55040 | EPN3 | P27T-E | Human | Esophagus | ESCC | 8.26e-12 | 2.99e-01 | 0.1055 |
| 55040 | EPN3 | P28T-E | Human | Esophagus | ESCC | 5.58e-09 | 1.71e-01 | 0.1149 |
| Page: 1 2 3 |
| Tissue | Expression Dynamics | Abbreviation |
| Esophagus | 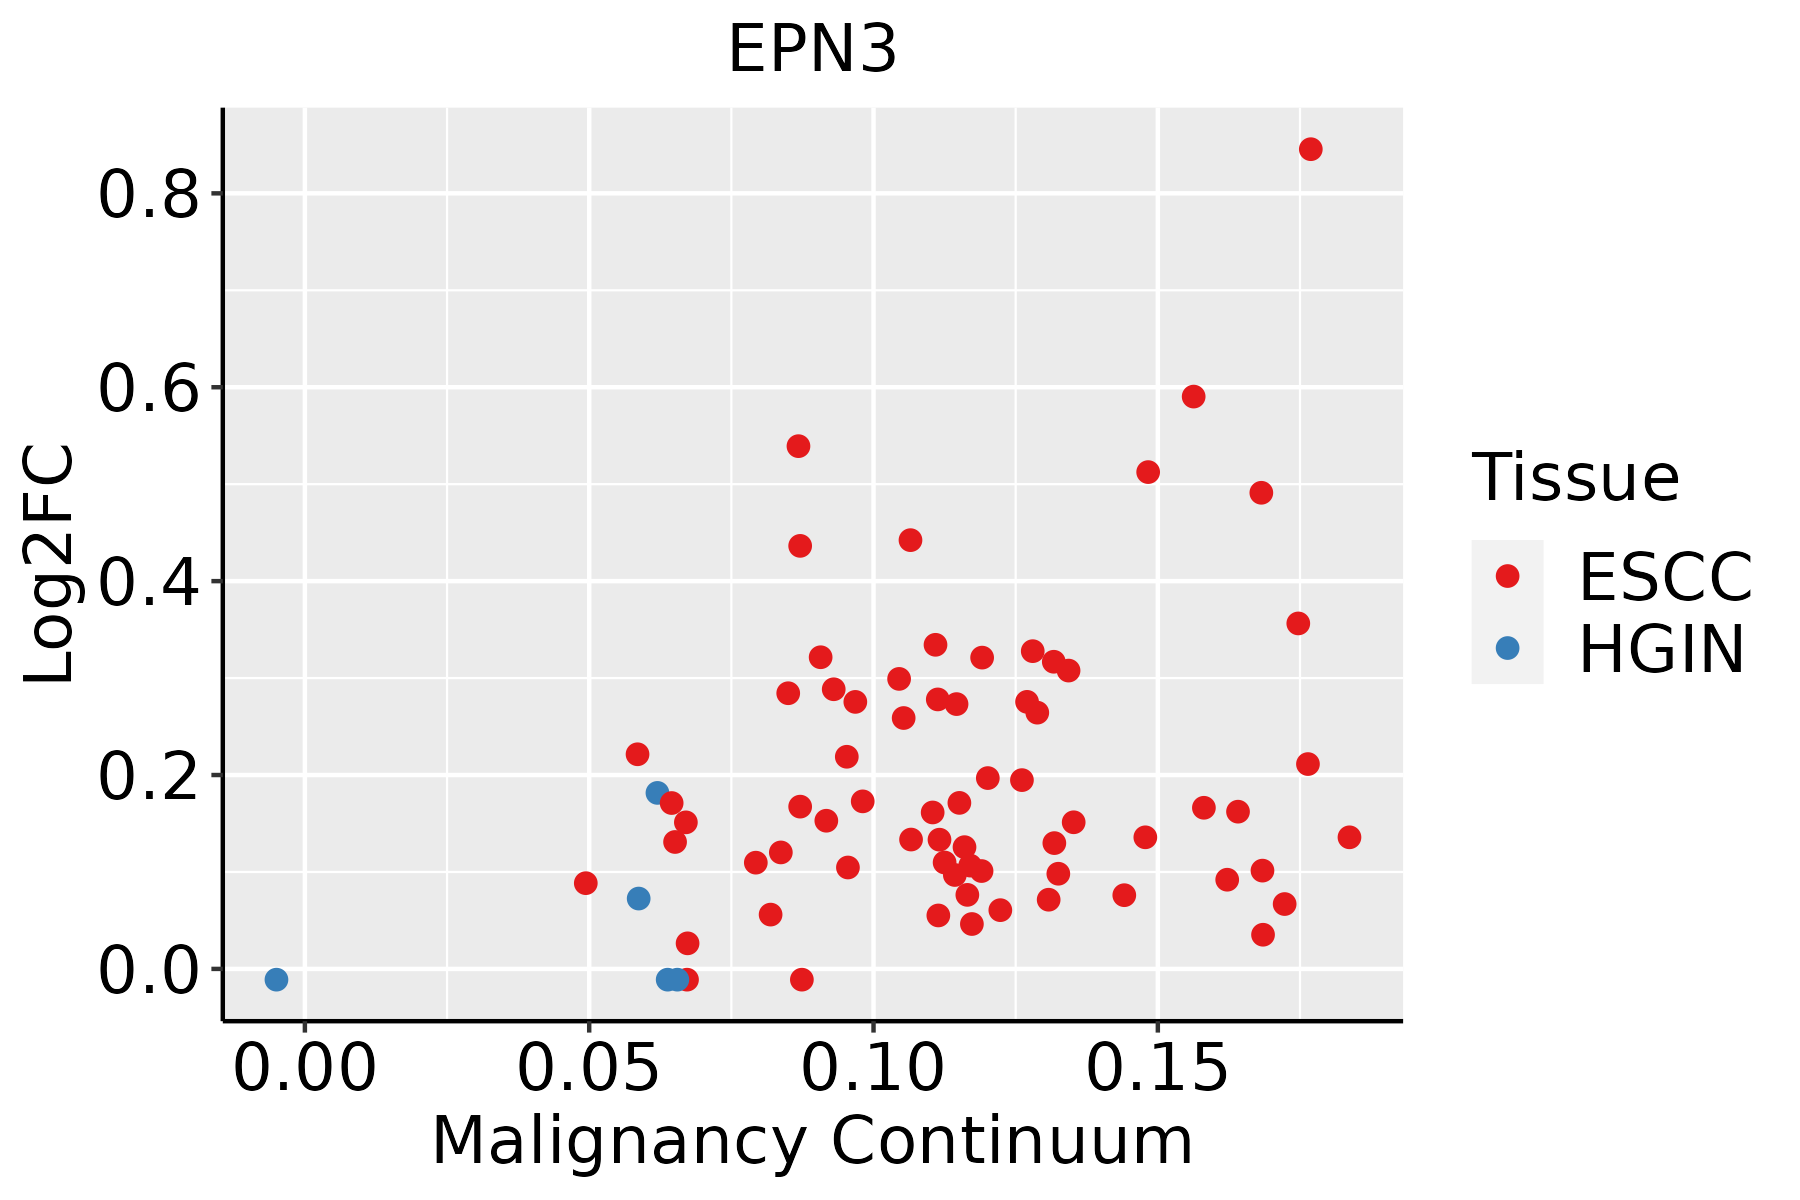 | ESCC: Esophageal squamous cell carcinoma |
| HGIN: High-grade intraepithelial neoplasias | ||
| LGIN: Low-grade intraepithelial neoplasias | ||
| Oral Cavity |  | EOLP: Erosive Oral lichen planus |
| LP: leukoplakia | ||
| NEOLP: Non-erosive oral lichen planus | ||
| OSCC: Oral squamous cell carcinoma |
| ∗log2FC in expression of this searched gene in stem-like cells from each diseased tissue sample relative to stem-like cells in normal samples in each tissue plotted against the malignancy continuum. Samples are colored based on if they are from different disease stage. |
Top |
Malignant transformation related pathway analysis |
| Find out the enriched GO biological processes and KEGG pathways involved in transition from healthy to precancer to cancer |
| Tissue | Disease Stage | Enriched GO biological Processes |
| Colorectum | AD |  |
| Colorectum | SER |  |
| Colorectum | MSS |  |
| Colorectum | MSI-H |  |
| Colorectum | FAP |  |
| ∗Top 15 enriched GO BP terms are showed in the bar plot of each disease state in each tissue. Each row represents a significant GO biological process which is colored according to the -log10(p.adjust). |
| Page: 1 2 3 4 5 6 7 8 9 |
| GO ID | Tissue | Disease Stage | Description | Gene Ratio | Bg Ratio | pvalue | p.adjust | Count |
| Page: 1 |
| Pathway ID | Tissue | Disease Stage | Description | Gene Ratio | Bg Ratio | pvalue | p.adjust | qvalue | Count |
| hsa04144210 | Esophagus | ESCC | Endocytosis | 186/4205 | 251/8465 | 9.74e-16 | 4.66e-14 | 2.39e-14 | 186 |
| hsa0414437 | Esophagus | ESCC | Endocytosis | 186/4205 | 251/8465 | 9.74e-16 | 4.66e-14 | 2.39e-14 | 186 |
| hsa0414427 | Oral cavity | OSCC | Endocytosis | 174/3704 | 251/8465 | 9.42e-17 | 4.51e-15 | 2.29e-15 | 174 |
| hsa04144112 | Oral cavity | OSCC | Endocytosis | 174/3704 | 251/8465 | 9.42e-17 | 4.51e-15 | 2.29e-15 | 174 |
| Page: 1 |
Top |
Cell-cell communication analysis |
| Identification of potential cell-cell interactions between two cell types and their ligand-receptor pairs for different disease states |
| Ligand | Receptor | LRpair | Pathway | Tissue | Disease Stage |
| Page: 1 |
Top |
Single-cell gene regulatory network inference analysis |
| Find out the significant the regulons (TFs) and the target genes of each regulon across cell types for different disease states |
| TF | Cell Type | Tissue | Disease Stage | Target Gene | RSS | Regulon Activity |
| ∗The dot plots of a searched regulon are shown for all cell subpopulations in each disease state of each tissue based on the regulon specific score inferred using pySCENIC and by calculating the average expression. |
| Page: 1 |
Top |
Somatic mutation of malignant transformation related genes |
| Annotation of somatic variants for genes involved in malignant transformation |
| Hugo Symbol | Variant Class | Variant Classification | dbSNP RS | HGVSc | HGVSp | HGVSp Short | SWISSPROT | BIOTYPE | SIFT | PolyPhen | Tumor Sample Barcode | Tissue | Histology | Sex | Age | Stage | Therapy Types | Drugs | Outcome |
| EPN3 | SNV | Missense_Mutation | c.113N>T | p.Ser38Leu | p.S38L | Q9H201 | protein_coding | deleterious(0) | probably_damaging(0.99) | TCGA-A2-A0T0-01 | Breast | breast invasive carcinoma | Female | <65 | I/II | Chemotherapy | taxotere | SD | |
| EPN3 | SNV | Missense_Mutation | c.1052N>T | p.Ser351Leu | p.S351L | Q9H201 | protein_coding | deleterious(0.01) | benign(0.007) | TCGA-AC-A23H-01 | Breast | breast invasive carcinoma | Female | >=65 | I/II | Unknown | Unknown | PD | |
| EPN3 | SNV | Missense_Mutation | c.1060N>A | p.Val354Ile | p.V354I | Q9H201 | protein_coding | tolerated(0.59) | benign(0) | TCGA-EX-A3L1-01 | Cervix | cervical & endocervical cancer | Female | <65 | I/II | Chemotherapy | cisplatin | CR | |
| EPN3 | SNV | Missense_Mutation | c.1220G>C | p.Gly407Ala | p.G407A | Q9H201 | protein_coding | tolerated(0.36) | benign(0.062) | TCGA-IR-A3LK-01 | Cervix | cervical & endocervical cancer | Female | >=65 | I/II | Chemotherapy | cisplatin | PD | |
| EPN3 | SNV | Missense_Mutation | novel | c.1281N>C | p.Lys427Asn | p.K427N | Q9H201 | protein_coding | tolerated(0.79) | benign(0.001) | TCGA-A6-2686-01 | Colorectum | colon adenocarcinoma | Female | >=65 | I/II | Unknown | Unknown | SD |
| EPN3 | SNV | Missense_Mutation | rs774659036 | c.580N>T | p.Arg194Cys | p.R194C | Q9H201 | protein_coding | tolerated(0.09) | probably_damaging(0.917) | TCGA-A6-6140-01 | Colorectum | colon adenocarcinoma | Male | <65 | I/II | Chemotherapy | oxaliplatin | SD |
| EPN3 | SNV | Missense_Mutation | c.1327N>T | p.Pro443Ser | p.P443S | Q9H201 | protein_coding | tolerated(0.48) | benign(0.007) | TCGA-AA-3864-01 | Colorectum | colon adenocarcinoma | Male | >=65 | I/II | Unknown | Unknown | SD | |
| EPN3 | SNV | Missense_Mutation | rs141972412 | c.373G>A | p.Glu125Lys | p.E125K | Q9H201 | protein_coding | deleterious(0) | probably_damaging(0.999) | TCGA-AA-3877-01 | Colorectum | colon adenocarcinoma | Female | >=65 | I/II | Unknown | Unknown | SD |
| EPN3 | SNV | Missense_Mutation | c.43C>T | p.His15Tyr | p.H15Y | Q9H201 | protein_coding | deleterious(0) | benign(0.114) | TCGA-AZ-4313-01 | Colorectum | colon adenocarcinoma | Female | <65 | I/II | Unknown | Unknown | SD | |
| EPN3 | SNV | Missense_Mutation | c.1376N>A | p.Pro459His | p.P459H | Q9H201 | protein_coding | tolerated(0.43) | benign(0.005) | TCGA-AZ-6598-01 | Colorectum | colon adenocarcinoma | Female | >=65 | I/II | Unknown | Unknown | SD |
| Page: 1 2 3 4 5 |
Top |
Related drugs of malignant transformation related genes |
| Identification of chemicals and drugs interact with genes involved in malignant transfromation |
| (DGIdb 4.0) |
| Entrez ID | Symbol | Category | Interaction Types | Drug Claim Name | Drug Name | PMIDs |
| Page: 1 |

Copyright 2023-Present -The University of Texas Health Science Center at Houston |