
|
|||||
|
 | |
| |
| |
| |
| |
| |
|
Gene: EPN2 |
Gene summary for EPN2 |
| Gene information | Species | Human | Gene symbol | EPN2 | Gene ID | 22905 |
| Gene name | epsin 2 | |
| Gene Alias | EHB21 | |
| Cytomap | 17p11.2 | |
| Gene Type | protein-coding | GO ID | GO:0001525 | UniProtAcc | O95208 |
Top |
Malignant transformation analysis |
| Identification of the aberrant gene expression in precancerous and cancerous lesions by comparing the gene expression of stem-like cells in diseased tissues with normal stem cells |
| Entrez ID | Symbol | Replicates | Species | Organ | Tissue | Adj P-value | Log2FC | Malignancy |
| 22905 | EPN2 | CA_HPV_1 | Human | Cervix | CC | 2.20e-03 | -1.65e-01 | 0.0264 |
| 22905 | EPN2 | CA_HPV_3 | Human | Cervix | CC | 3.64e-03 | 1.72e-01 | 0.0414 |
| 22905 | EPN2 | CCI_1 | Human | Cervix | CC | 9.29e-05 | 8.11e-01 | 0.528 |
| 22905 | EPN2 | CCI_2 | Human | Cervix | CC | 1.94e-03 | 6.59e-01 | 0.5249 |
| 22905 | EPN2 | CCI_3 | Human | Cervix | CC | 1.54e-02 | 4.32e-01 | 0.516 |
| 22905 | EPN2 | LZE4T | Human | Esophagus | ESCC | 2.56e-09 | 3.50e-01 | 0.0811 |
| 22905 | EPN2 | LZE7T | Human | Esophagus | ESCC | 4.39e-02 | 2.93e-01 | 0.0667 |
| 22905 | EPN2 | LZE21D1 | Human | Esophagus | HGIN | 1.53e-04 | 4.69e-01 | 0.0632 |
| 22905 | EPN2 | LZE24T | Human | Esophagus | ESCC | 9.66e-14 | 4.27e-01 | 0.0596 |
| 22905 | EPN2 | LZE21T | Human | Esophagus | ESCC | 4.69e-03 | 3.13e-01 | 0.0655 |
| 22905 | EPN2 | P1T-E | Human | Esophagus | ESCC | 4.50e-11 | 6.37e-01 | 0.0875 |
| 22905 | EPN2 | P2T-E | Human | Esophagus | ESCC | 8.92e-26 | 4.61e-01 | 0.1177 |
| 22905 | EPN2 | P4T-E | Human | Esophagus | ESCC | 3.50e-18 | 5.31e-01 | 0.1323 |
| 22905 | EPN2 | P5T-E | Human | Esophagus | ESCC | 4.27e-08 | 1.39e-01 | 0.1327 |
| 22905 | EPN2 | P8T-E | Human | Esophagus | ESCC | 2.34e-10 | 2.43e-01 | 0.0889 |
| 22905 | EPN2 | P9T-E | Human | Esophagus | ESCC | 1.37e-14 | 4.16e-01 | 0.1131 |
| 22905 | EPN2 | P10T-E | Human | Esophagus | ESCC | 5.08e-38 | 6.83e-01 | 0.116 |
| 22905 | EPN2 | P11T-E | Human | Esophagus | ESCC | 1.43e-08 | 3.54e-01 | 0.1426 |
| 22905 | EPN2 | P12T-E | Human | Esophagus | ESCC | 5.80e-23 | 4.51e-01 | 0.1122 |
| 22905 | EPN2 | P15T-E | Human | Esophagus | ESCC | 1.96e-16 | 4.11e-01 | 0.1149 |
| Page: 1 2 3 4 5 6 7 |
| Tissue | Expression Dynamics | Abbreviation |
| Cervix | 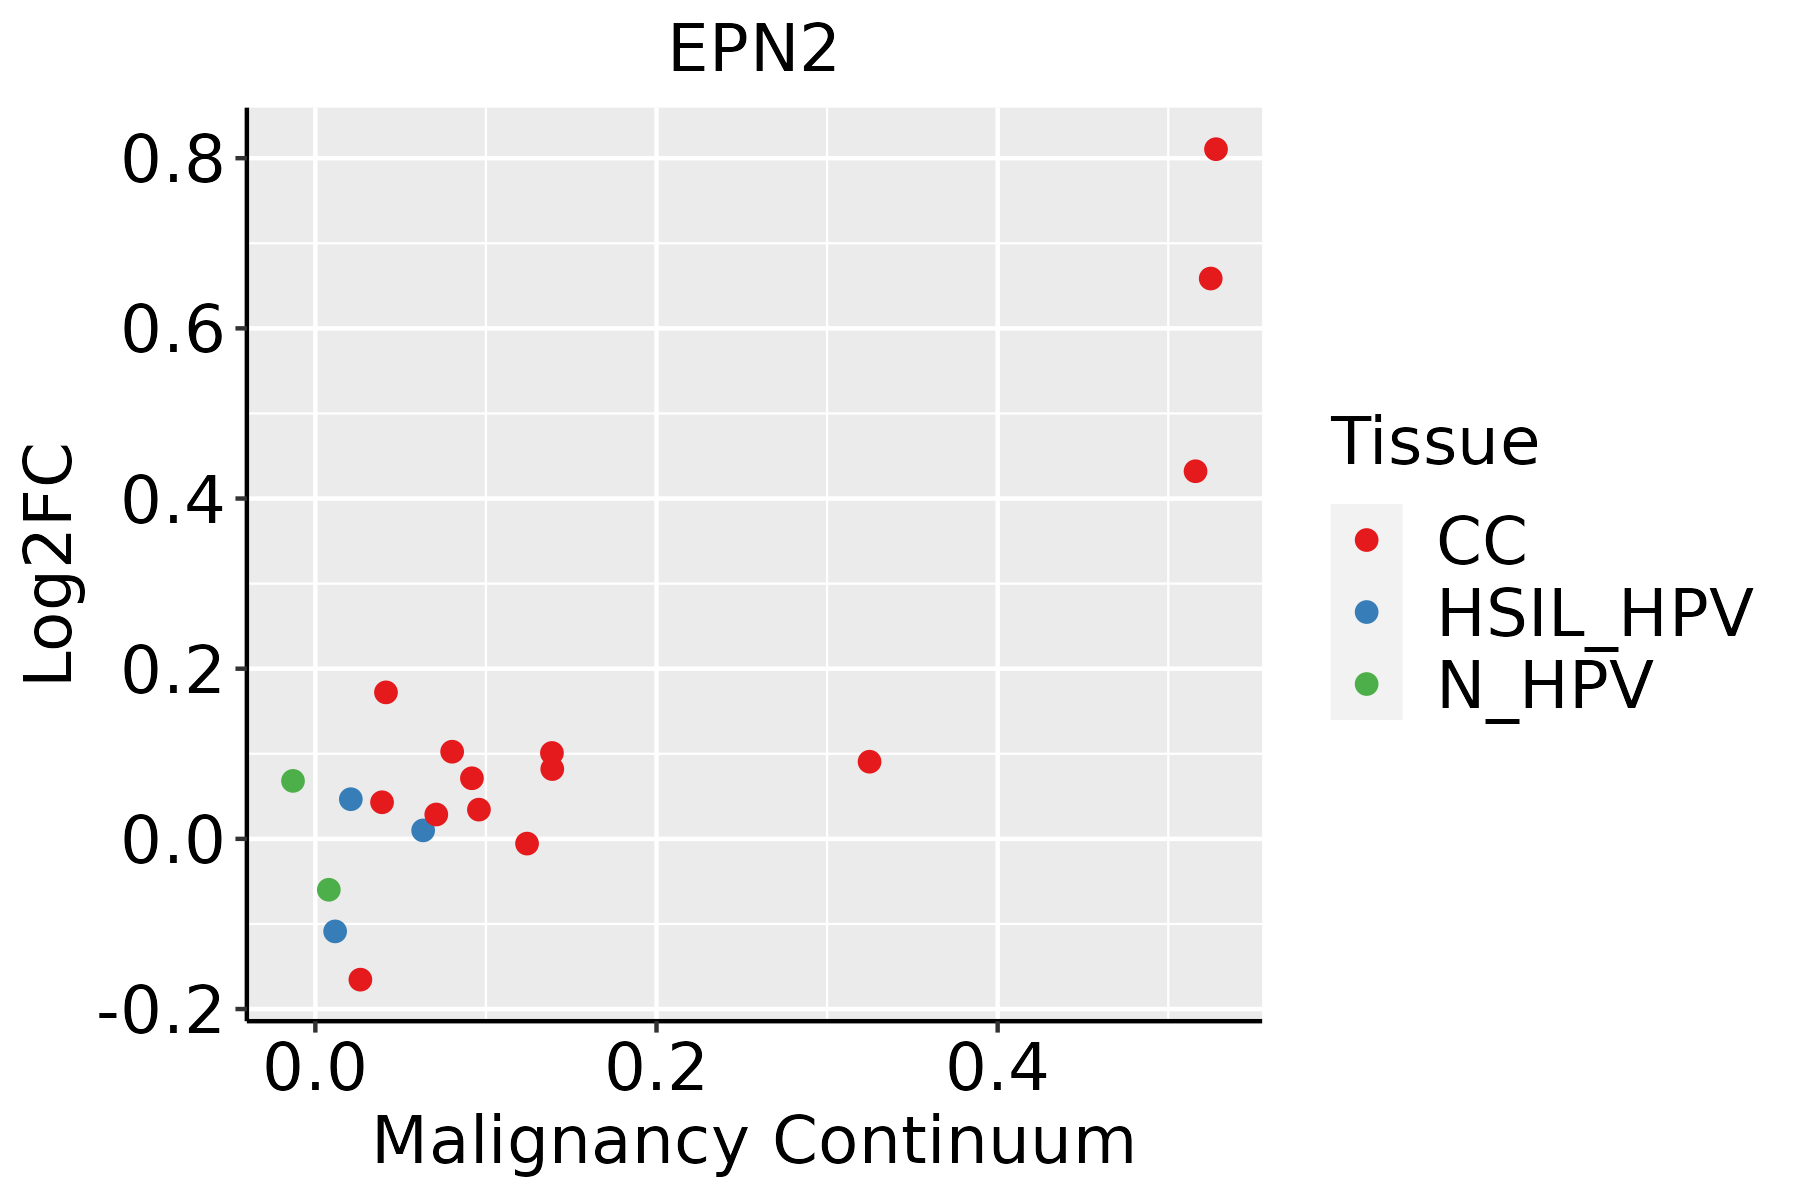 | CC: Cervix cancer |
| HSIL_HPV: HPV-infected high-grade squamous intraepithelial lesions | ||
| N_HPV: HPV-infected normal cervix | ||
| Esophagus |  | ESCC: Esophageal squamous cell carcinoma |
| HGIN: High-grade intraepithelial neoplasias | ||
| LGIN: Low-grade intraepithelial neoplasias | ||
| Liver | 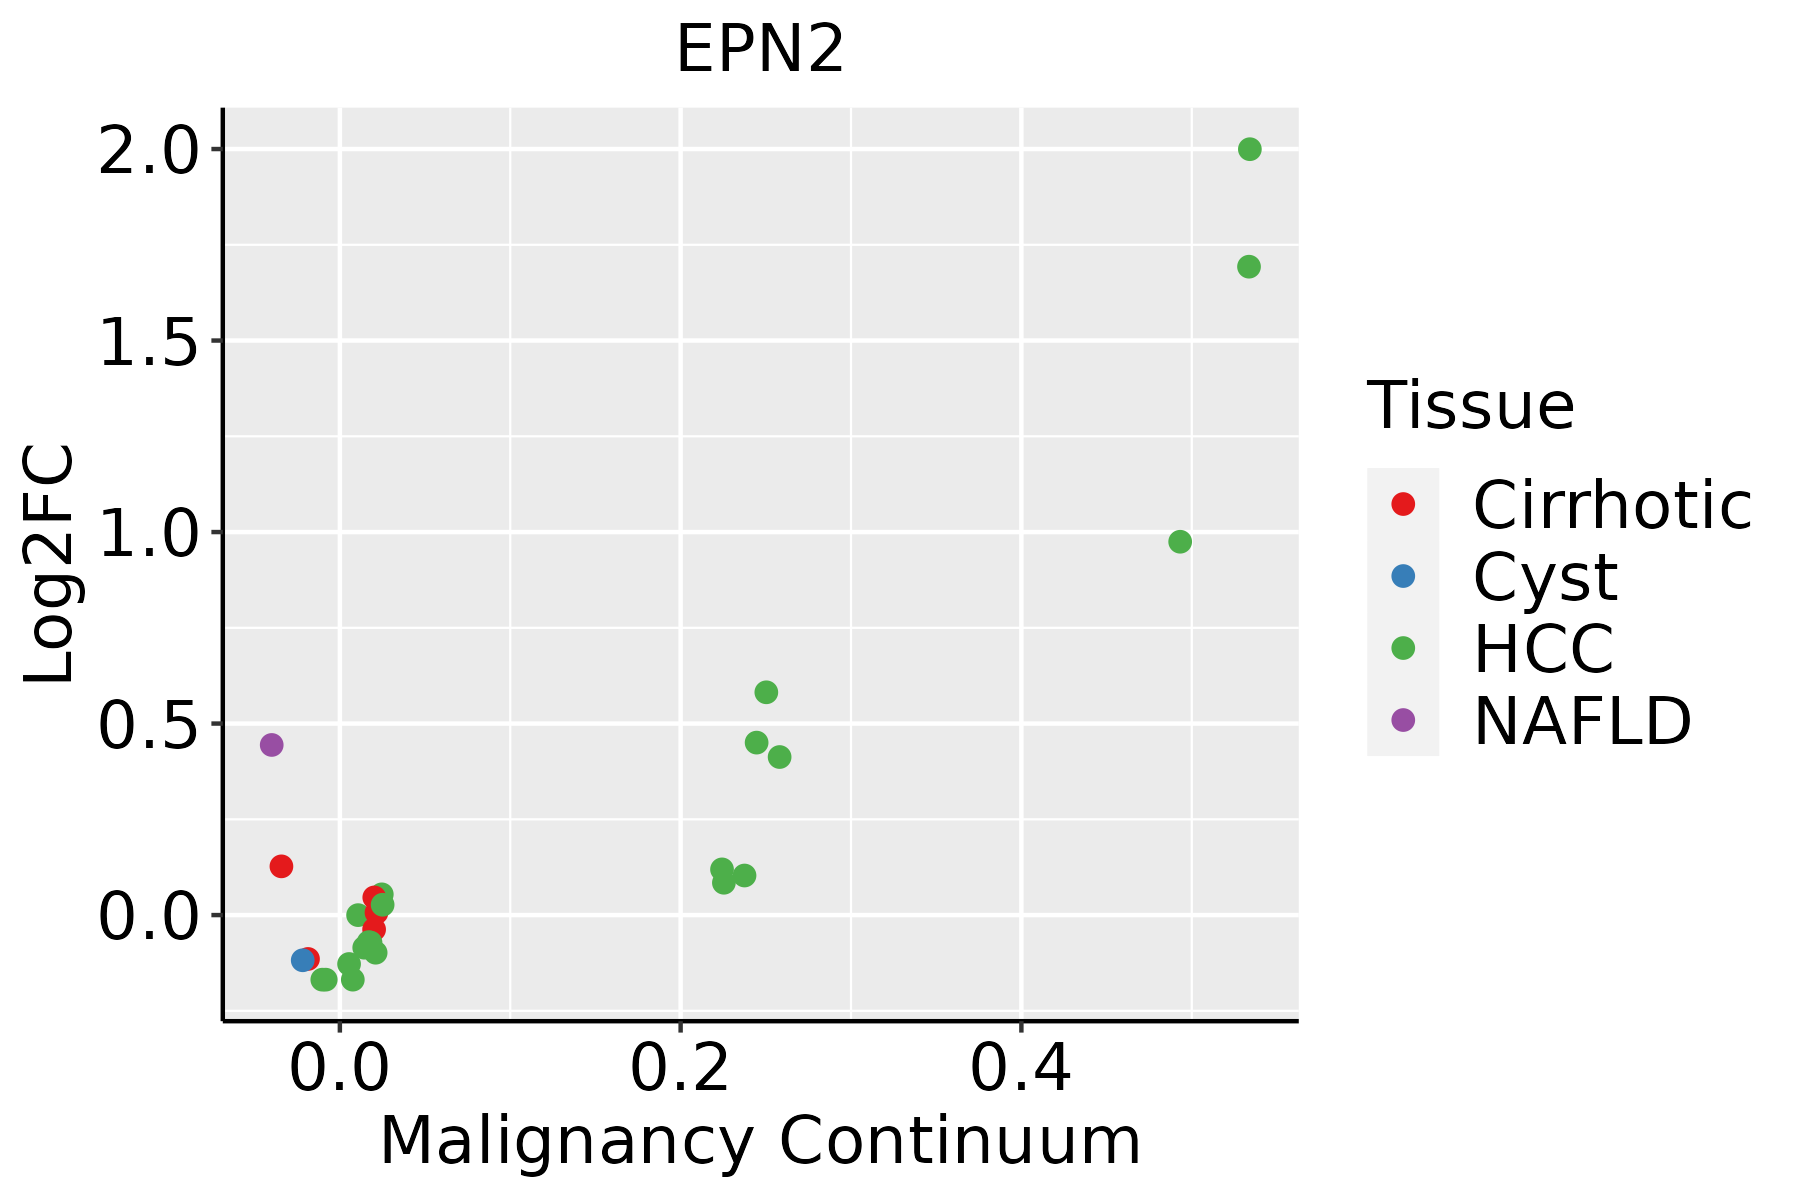 | HCC: Hepatocellular carcinoma |
| NAFLD: Non-alcoholic fatty liver disease | ||
| Lung | 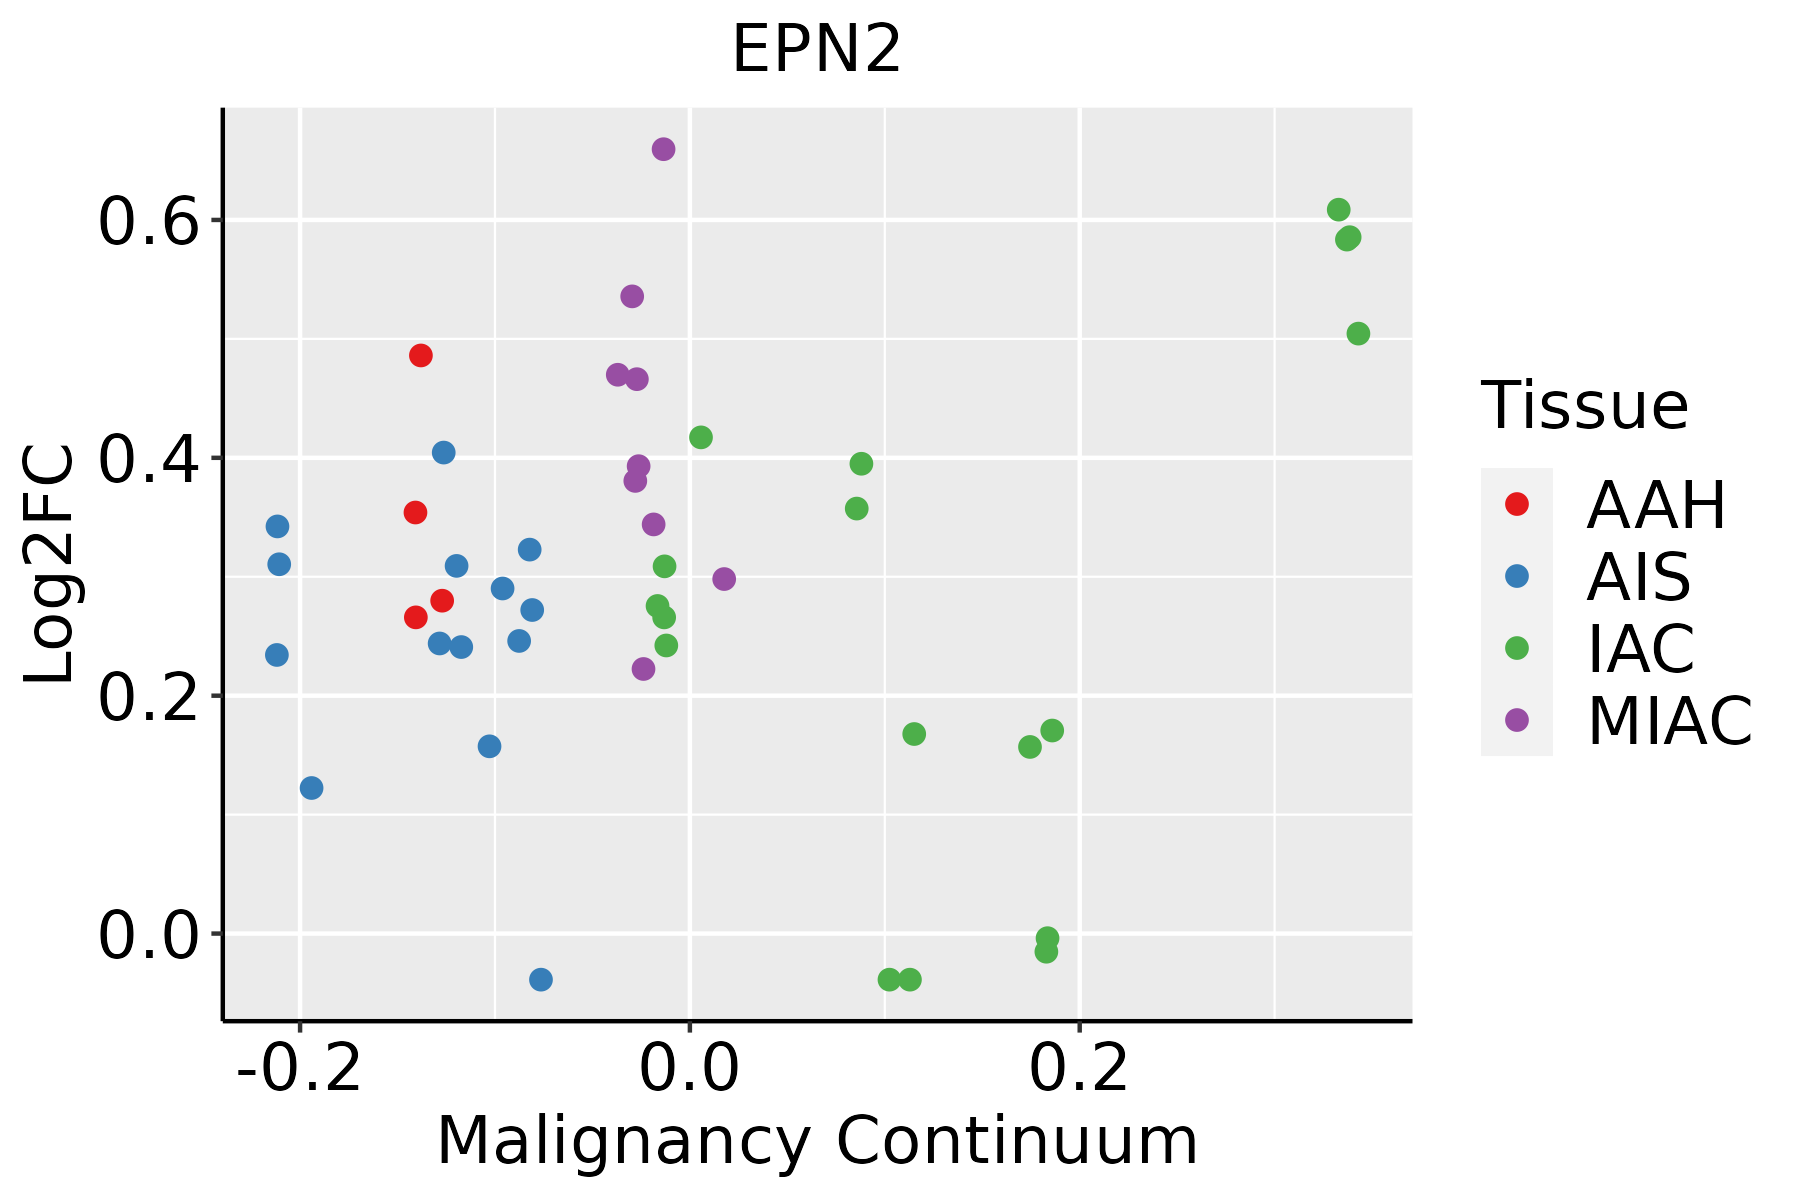 | AAH: Atypical adenomatous hyperplasia |
| AIS: Adenocarcinoma in situ | ||
| IAC: Invasive lung adenocarcinoma | ||
| MIA: Minimally invasive adenocarcinoma | ||
| Oral Cavity |  | EOLP: Erosive Oral lichen planus |
| LP: leukoplakia | ||
| NEOLP: Non-erosive oral lichen planus | ||
| OSCC: Oral squamous cell carcinoma | ||
| Skin | 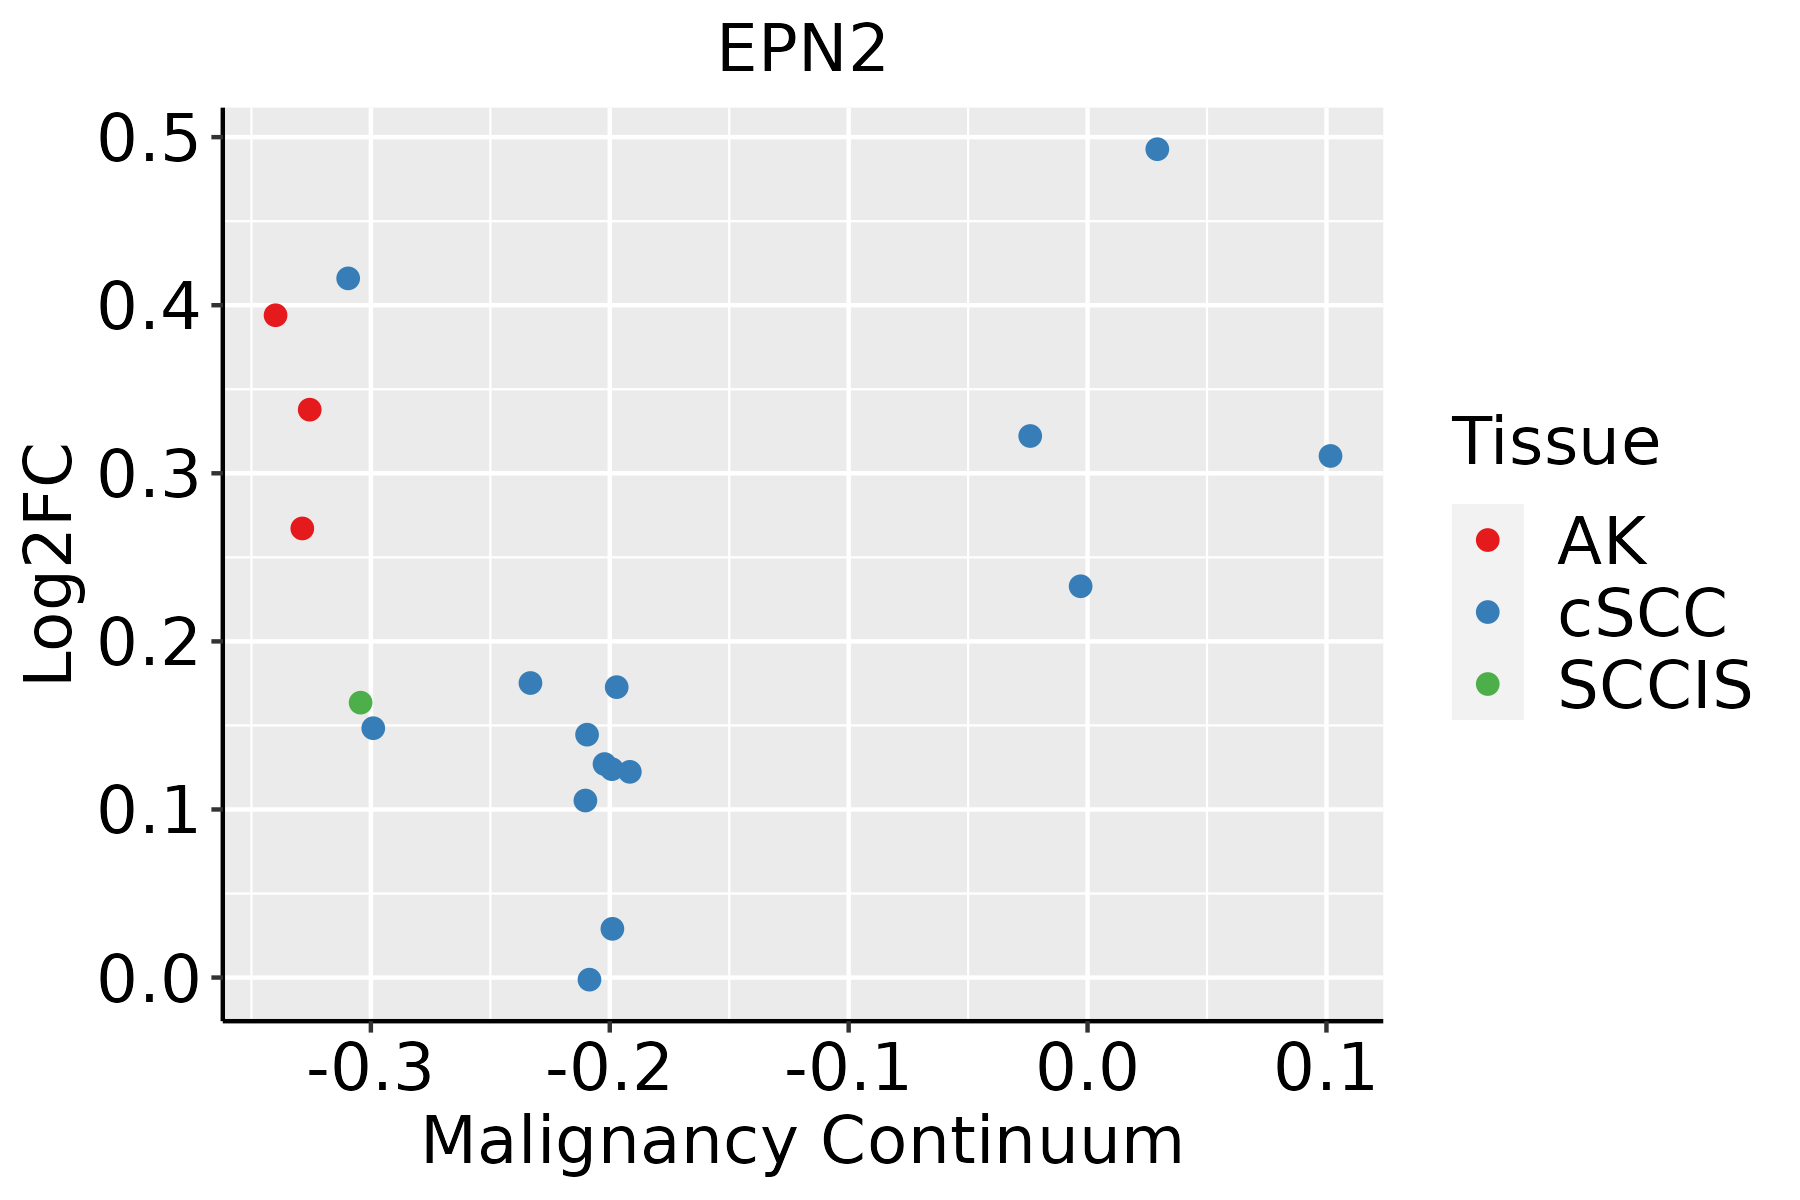 | AK: Actinic keratosis |
| cSCC: Cutaneous squamous cell carcinoma | ||
| SCCIS:squamous cell carcinoma in situ | ||
| Thyroid | 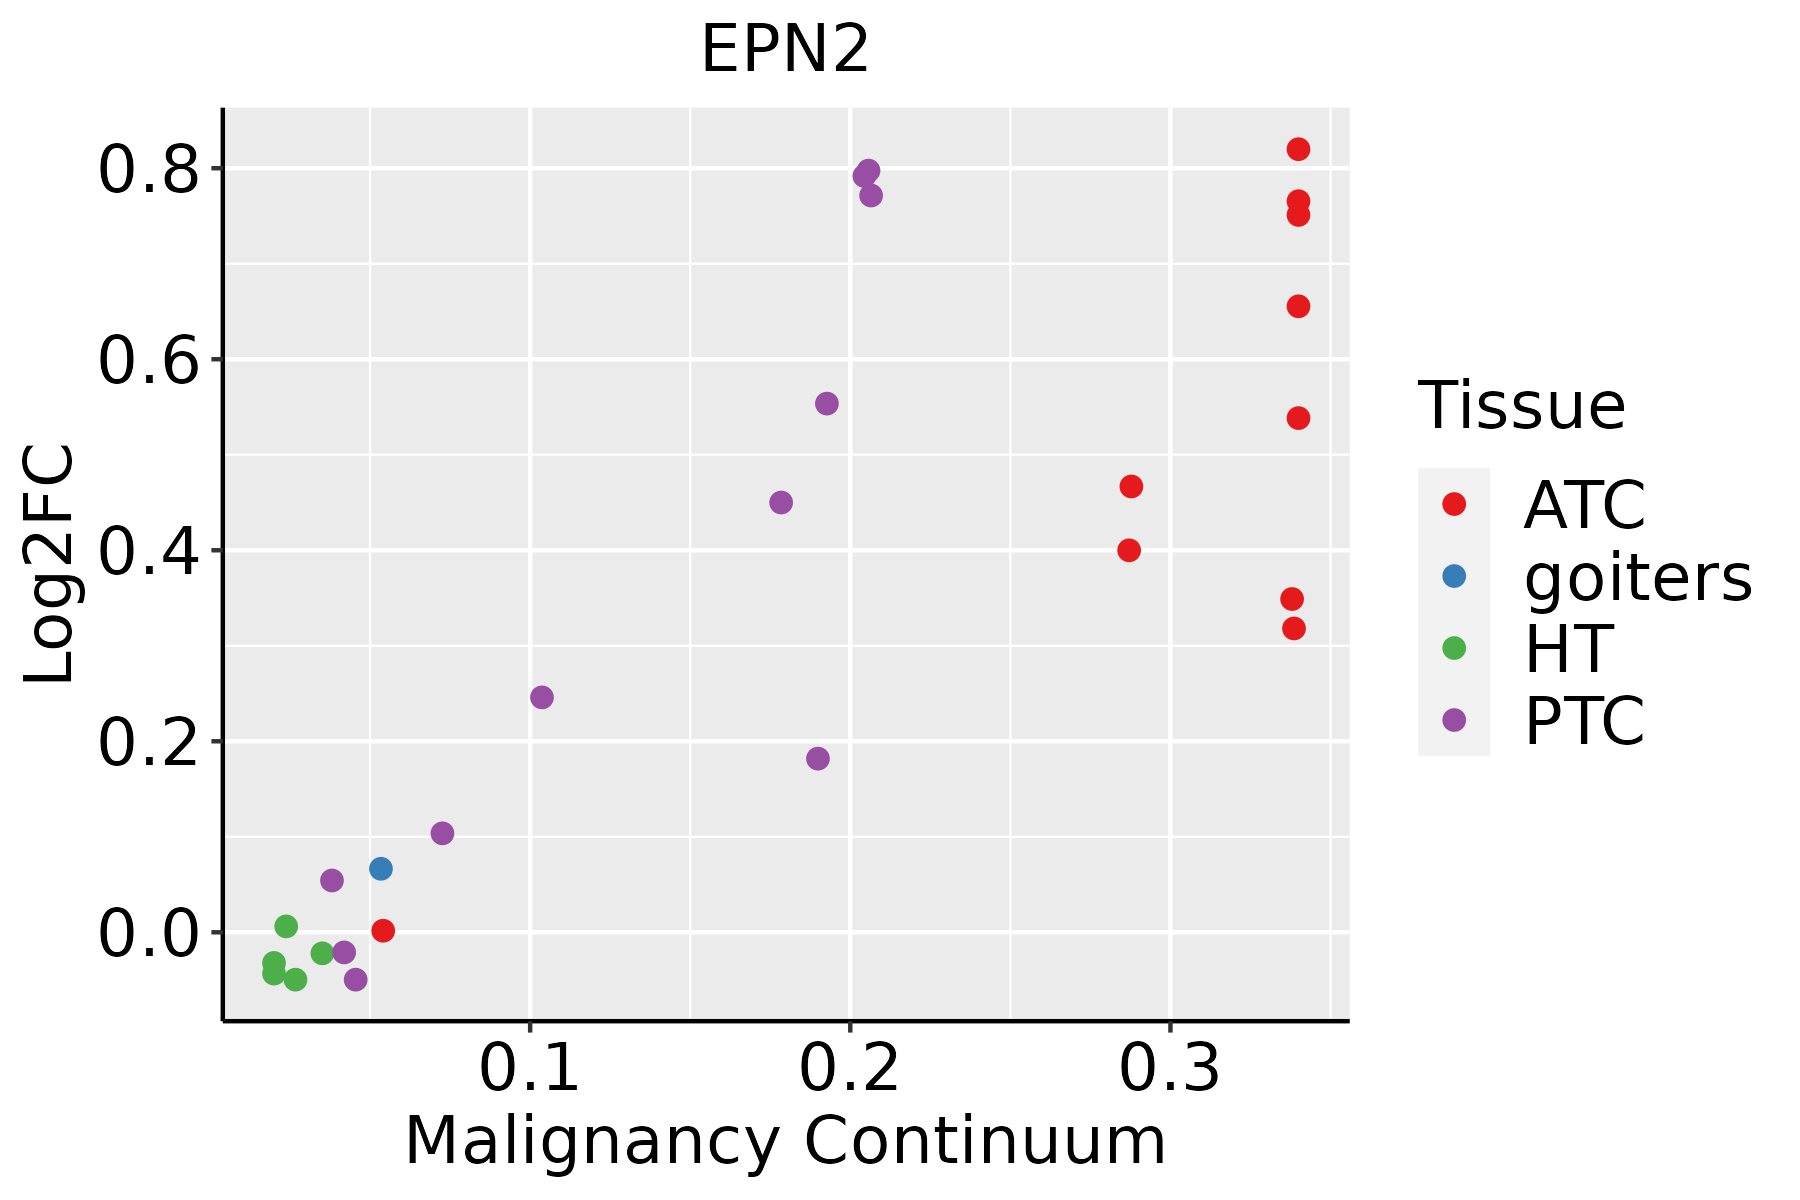 | ATC: Anaplastic thyroid cancer |
| HT: Hashimoto's thyroiditis | ||
| PTC: Papillary thyroid cancer |
| ∗log2FC in expression of this searched gene in stem-like cells from each diseased tissue sample relative to stem-like cells in normal samples in each tissue plotted against the malignancy continuum. Samples are colored based on if they are from different disease stage. |
Top |
Malignant transformation related pathway analysis |
| Find out the enriched GO biological processes and KEGG pathways involved in transition from healthy to precancer to cancer |
| Tissue | Disease Stage | Enriched GO biological Processes |
| Colorectum | AD |  |
| Colorectum | SER |  |
| Colorectum | MSS |  |
| Colorectum | MSI-H |  |
| Colorectum | FAP |  |
| ∗Top 15 enriched GO BP terms are showed in the bar plot of each disease state in each tissue. Each row represents a significant GO biological process which is colored according to the -log10(p.adjust). |
| Page: 1 2 3 4 5 6 7 8 9 |
| GO ID | Tissue | Disease Stage | Description | Gene Ratio | Bg Ratio | pvalue | p.adjust | Count |
| GO:00072194 | Cervix | CC | Notch signaling pathway | 39/2311 | 172/18723 | 1.08e-04 | 1.38e-03 | 39 |
| GO:00085933 | Cervix | CC | regulation of Notch signaling pathway | 25/2311 | 95/18723 | 1.61e-04 | 1.93e-03 | 25 |
| GO:0045747 | Cervix | CC | positive regulation of Notch signaling pathway | 13/2311 | 47/18723 | 3.62e-03 | 2.31e-02 | 13 |
| GO:19013423 | Cervix | CC | regulation of vasculature development | 60/2311 | 348/18723 | 4.48e-03 | 2.72e-02 | 60 |
| GO:00457653 | Cervix | CC | regulation of angiogenesis | 59/2311 | 342/18723 | 4.73e-03 | 2.83e-02 | 59 |
| GO:00072197 | Esophagus | ESCC | Notch signaling pathway | 106/8552 | 172/18723 | 1.74e-05 | 1.55e-04 | 106 |
| GO:00085935 | Esophagus | ESCC | regulation of Notch signaling pathway | 59/8552 | 95/18723 | 9.12e-04 | 4.65e-03 | 59 |
| GO:0048010 | Lung | IAC | vascular endothelial growth factor receptor signaling pathway | 15/2061 | 59/18723 | 1.45e-03 | 1.56e-02 | 15 |
| GO:00085932 | Lung | IAC | regulation of Notch signaling pathway | 20/2061 | 95/18723 | 3.15e-03 | 2.75e-02 | 20 |
| GO:00085931 | Lung | AIS | regulation of Notch signaling pathway | 20/1849 | 95/18723 | 8.52e-04 | 1.17e-02 | 20 |
| GO:00072193 | Lung | AIS | Notch signaling pathway | 29/1849 | 172/18723 | 2.93e-03 | 2.92e-02 | 29 |
| GO:00072196 | Oral cavity | OSCC | Notch signaling pathway | 92/7305 | 172/18723 | 7.84e-05 | 6.08e-04 | 92 |
| GO:00085934 | Oral cavity | OSCC | regulation of Notch signaling pathway | 53/7305 | 95/18723 | 6.64e-04 | 3.72e-03 | 53 |
| GO:000859311 | Oral cavity | LP | regulation of Notch signaling pathway | 35/4623 | 95/18723 | 5.53e-03 | 3.34e-02 | 35 |
| GO:000721913 | Oral cavity | LP | Notch signaling pathway | 57/4623 | 172/18723 | 7.60e-03 | 4.18e-02 | 57 |
| GO:009028711 | Oral cavity | NEOLP | regulation of cellular response to growth factor stimulus | 56/2005 | 304/18723 | 3.55e-05 | 5.20e-04 | 56 |
| GO:190134213 | Oral cavity | NEOLP | regulation of vasculature development | 59/2005 | 348/18723 | 2.42e-04 | 2.52e-03 | 59 |
| GO:00457655 | Oral cavity | NEOLP | regulation of angiogenesis | 58/2005 | 342/18723 | 2.70e-04 | 2.72e-03 | 58 |
| GO:00480101 | Oral cavity | NEOLP | vascular endothelial growth factor receptor signaling pathway | 16/2005 | 59/18723 | 3.48e-04 | 3.36e-03 | 16 |
| GO:000721921 | Oral cavity | NEOLP | Notch signaling pathway | 32/2005 | 172/18723 | 1.31e-03 | 9.48e-03 | 32 |
| Page: 1 2 |
| Pathway ID | Tissue | Disease Stage | Description | Gene Ratio | Bg Ratio | pvalue | p.adjust | qvalue | Count |
| hsa0414418 | Cervix | CC | Endocytosis | 64/1267 | 251/8465 | 6.97e-06 | 6.10e-05 | 3.61e-05 | 64 |
| hsa0414419 | Cervix | CC | Endocytosis | 64/1267 | 251/8465 | 6.97e-06 | 6.10e-05 | 3.61e-05 | 64 |
| hsa0414429 | Esophagus | HGIN | Endocytosis | 76/1383 | 251/8465 | 1.74e-08 | 3.34e-07 | 2.65e-07 | 76 |
| hsa04144113 | Esophagus | HGIN | Endocytosis | 76/1383 | 251/8465 | 1.74e-08 | 3.34e-07 | 2.65e-07 | 76 |
| hsa04144210 | Esophagus | ESCC | Endocytosis | 186/4205 | 251/8465 | 9.74e-16 | 4.66e-14 | 2.39e-14 | 186 |
| hsa0414437 | Esophagus | ESCC | Endocytosis | 186/4205 | 251/8465 | 9.74e-16 | 4.66e-14 | 2.39e-14 | 186 |
| hsa0414422 | Liver | HCC | Endocytosis | 178/4020 | 251/8465 | 2.03e-14 | 5.22e-13 | 2.91e-13 | 178 |
| hsa0414432 | Liver | HCC | Endocytosis | 178/4020 | 251/8465 | 2.03e-14 | 5.22e-13 | 2.91e-13 | 178 |
| hsa0414414 | Lung | IAC | Endocytosis | 51/1053 | 251/8465 | 2.25e-04 | 2.54e-03 | 1.68e-03 | 51 |
| hsa0414415 | Lung | IAC | Endocytosis | 51/1053 | 251/8465 | 2.25e-04 | 2.54e-03 | 1.68e-03 | 51 |
| hsa0414423 | Lung | AIS | Endocytosis | 52/961 | 251/8465 | 9.74e-06 | 3.04e-04 | 1.95e-04 | 52 |
| hsa0414433 | Lung | AIS | Endocytosis | 52/961 | 251/8465 | 9.74e-06 | 3.04e-04 | 1.95e-04 | 52 |
| hsa0414427 | Oral cavity | OSCC | Endocytosis | 174/3704 | 251/8465 | 9.42e-17 | 4.51e-15 | 2.29e-15 | 174 |
| hsa04144112 | Oral cavity | OSCC | Endocytosis | 174/3704 | 251/8465 | 9.42e-17 | 4.51e-15 | 2.29e-15 | 174 |
| hsa0414428 | Oral cavity | LP | Endocytosis | 121/2418 | 251/8465 | 1.89e-11 | 3.70e-10 | 2.38e-10 | 121 |
| hsa0414436 | Oral cavity | LP | Endocytosis | 121/2418 | 251/8465 | 1.89e-11 | 3.70e-10 | 2.38e-10 | 121 |
| hsa0414461 | Oral cavity | NEOLP | Endocytosis | 62/1112 | 251/8465 | 3.56e-07 | 4.92e-06 | 3.09e-06 | 62 |
| hsa0414471 | Oral cavity | NEOLP | Endocytosis | 62/1112 | 251/8465 | 3.56e-07 | 4.92e-06 | 3.09e-06 | 62 |
| Page: 1 |
Top |
Cell-cell communication analysis |
| Identification of potential cell-cell interactions between two cell types and their ligand-receptor pairs for different disease states |
| Ligand | Receptor | LRpair | Pathway | Tissue | Disease Stage |
| Page: 1 |
Top |
Single-cell gene regulatory network inference analysis |
| Find out the significant the regulons (TFs) and the target genes of each regulon across cell types for different disease states |
| TF | Cell Type | Tissue | Disease Stage | Target Gene | RSS | Regulon Activity |
| ∗The dot plots of a searched regulon are shown for all cell subpopulations in each disease state of each tissue based on the regulon specific score inferred using pySCENIC and by calculating the average expression. |
| Page: 1 |
Top |
Somatic mutation of malignant transformation related genes |
| Annotation of somatic variants for genes involved in malignant transformation |
| Hugo Symbol | Variant Class | Variant Classification | dbSNP RS | HGVSc | HGVSp | HGVSp Short | SWISSPROT | BIOTYPE | SIFT | PolyPhen | Tumor Sample Barcode | Tissue | Histology | Sex | Age | Stage | Therapy Types | Drugs | Outcome |
| EPN2 | insertion | Nonsense_Mutation | novel | c.310_311insCCAGTGGAAGTGTTTTGAAAATAGAGCAATAGTCATG | p.Gln104ProfsTer11 | p.Q104Pfs*11 | O95208 | protein_coding | TCGA-A2-A0EM-01 | Breast | breast invasive carcinoma | Female | >=65 | I/II | Hormone Therapy | tamoxiphen | SD | ||
| EPN2 | SNV | Missense_Mutation | novel | c.1162N>A | p.Ala388Thr | p.A388T | O95208 | protein_coding | tolerated(0.55) | benign(0.031) | TCGA-EA-A3HS-01 | Cervix | cervical & endocervical cancer | Female | <65 | I/II | Unknown | Unknown | SD |
| EPN2 | SNV | Missense_Mutation | c.1289N>A | p.Gly430Asp | p.G430D | O95208 | protein_coding | deleterious(0.02) | possibly_damaging(0.674) | TCGA-A6-3809-01 | Colorectum | colon adenocarcinoma | Female | >=65 | I/II | Unknown | Unknown | SD | |
| EPN2 | SNV | Missense_Mutation | c.1460C>A | p.Pro487His | p.P487H | O95208 | protein_coding | deleterious(0.01) | probably_damaging(0.99) | TCGA-AA-3663-01 | Colorectum | colon adenocarcinoma | Male | <65 | I/II | Unknown | Unknown | SD | |
| EPN2 | SNV | Missense_Mutation | c.1341C>A | p.Phe447Leu | p.F447L | O95208 | protein_coding | tolerated(0.06) | benign(0.012) | TCGA-AA-3712-01 | Colorectum | colon adenocarcinoma | Male | >=65 | III/IV | Unknown | Unknown | SD | |
| EPN2 | SNV | Missense_Mutation | novel | c.101G>A | p.Gly34Asp | p.G34D | O95208 | protein_coding | deleterious(0) | probably_damaging(1) | TCGA-AA-3947-01 | Colorectum | colon adenocarcinoma | Female | <65 | I/II | Unknown | Unknown | SD |
| EPN2 | SNV | Missense_Mutation | rs567144915 | c.755N>A | p.Arg252His | p.R252H | O95208 | protein_coding | tolerated(0.07) | benign(0.063) | TCGA-AD-6889-01 | Colorectum | colon adenocarcinoma | Male | >=65 | I/II | Chemotherapy | xeloda | PD |
| EPN2 | SNV | Missense_Mutation | rs772339966 | c.596N>T | p.Ser199Leu | p.S199L | O95208 | protein_coding | tolerated(0.09) | benign(0.035) | TCGA-CM-6166-01 | Colorectum | colon adenocarcinoma | Female | <65 | I/II | Unknown | Unknown | SD |
| EPN2 | SNV | Missense_Mutation | c.1186N>T | p.Pro396Ser | p.P396S | O95208 | protein_coding | tolerated(0.15) | benign(0.01) | TCGA-AG-A02N-01 | Colorectum | rectum adenocarcinoma | Male | >=65 | I/II | Chemotherapy | folinic | CR | |
| EPN2 | insertion | Frame_Shift_Ins | rs764529271 | c.1400_1401insA | p.Thr470AsnfsTer19 | p.T470Nfs*19 | O95208 | protein_coding | TCGA-G4-6586-01 | Colorectum | colon adenocarcinoma | Female | >=65 | I/II | Unknown | Unknown | SD |
| Page: 1 2 3 4 5 6 7 |
Top |
Related drugs of malignant transformation related genes |
| Identification of chemicals and drugs interact with genes involved in malignant transfromation |
| (DGIdb 4.0) |
| Entrez ID | Symbol | Category | Interaction Types | Drug Claim Name | Drug Name | PMIDs |
| Page: 1 |

Copyright 2023-Present -The University of Texas Health Science Center at Houston |