
|
|||||
|
 | |
| |
| |
| |
| |
| |
|
Gene: EPN1 |
Gene summary for EPN1 |
| Gene information | Species | Human | Gene symbol | EPN1 | Gene ID | 29924 |
| Gene name | epsin 1 | |
| Gene Alias | EPN1 | |
| Cytomap | 19q13.42 | |
| Gene Type | protein-coding | GO ID | GO:0000003 | UniProtAcc | Q9Y6I3 |
Top |
Malignant transformation analysis |
| Identification of the aberrant gene expression in precancerous and cancerous lesions by comparing the gene expression of stem-like cells in diseased tissues with normal stem cells |
| Entrez ID | Symbol | Replicates | Species | Organ | Tissue | Adj P-value | Log2FC | Malignancy |
| 29924 | EPN1 | HTA11_3410_2000001011 | Human | Colorectum | AD | 3.15e-03 | 3.46e-02 | 0.0155 |
| 29924 | EPN1 | HTA11_2487_2000001011 | Human | Colorectum | SER | 1.74e-09 | 5.38e-01 | -0.1808 |
| 29924 | EPN1 | HTA11_347_2000001011 | Human | Colorectum | AD | 3.62e-20 | 6.19e-01 | -0.1954 |
| 29924 | EPN1 | HTA11_411_2000001011 | Human | Colorectum | SER | 7.98e-05 | 9.86e-01 | -0.2602 |
| 29924 | EPN1 | HTA11_3361_2000001011 | Human | Colorectum | AD | 7.54e-03 | 3.72e-01 | -0.1207 |
| 29924 | EPN1 | HTA11_696_2000001011 | Human | Colorectum | AD | 4.71e-07 | 3.84e-01 | -0.1464 |
| 29924 | EPN1 | HTA11_1391_2000001011 | Human | Colorectum | AD | 3.07e-06 | 4.76e-01 | -0.059 |
| 29924 | EPN1 | HTA11_2992_2000001011 | Human | Colorectum | SER | 2.20e-06 | 7.35e-01 | -0.1706 |
| 29924 | EPN1 | HTA11_5216_2000001011 | Human | Colorectum | SER | 2.55e-02 | 7.27e-01 | -0.1462 |
| 29924 | EPN1 | HTA11_546_2000001011 | Human | Colorectum | AD | 2.88e-09 | 5.82e-01 | -0.0842 |
| 29924 | EPN1 | HTA11_7696_3000711011 | Human | Colorectum | AD | 3.83e-05 | 3.29e-01 | 0.0674 |
| 29924 | EPN1 | A015-C-203 | Human | Colorectum | FAP | 9.35e-08 | 6.67e-02 | -0.1294 |
| 29924 | EPN1 | A001-C-108 | Human | Colorectum | FAP | 4.29e-02 | -2.48e-02 | -0.0272 |
| 29924 | EPN1 | A002-C-205 | Human | Colorectum | FAP | 1.87e-04 | 2.10e-02 | -0.1236 |
| 29924 | EPN1 | A015-C-006 | Human | Colorectum | FAP | 4.90e-02 | -1.02e-01 | -0.0994 |
| 29924 | EPN1 | A002-C-114 | Human | Colorectum | FAP | 1.04e-02 | -1.65e-02 | -0.1561 |
| 29924 | EPN1 | A015-C-104 | Human | Colorectum | FAP | 2.60e-06 | -1.47e-01 | -0.1899 |
| 29924 | EPN1 | A015-C-202 | Human | Colorectum | FAP | 1.94e-04 | 3.86e-01 | -0.0849 |
| 29924 | EPN1 | A002-C-016 | Human | Colorectum | FAP | 8.51e-05 | 1.30e-01 | 0.0521 |
| 29924 | EPN1 | A002-C-116 | Human | Colorectum | FAP | 1.08e-08 | -6.00e-03 | -0.0452 |
| Page: 1 2 3 4 5 6 7 8 |
| Tissue | Expression Dynamics | Abbreviation |
| Colorectum (GSE201348) | 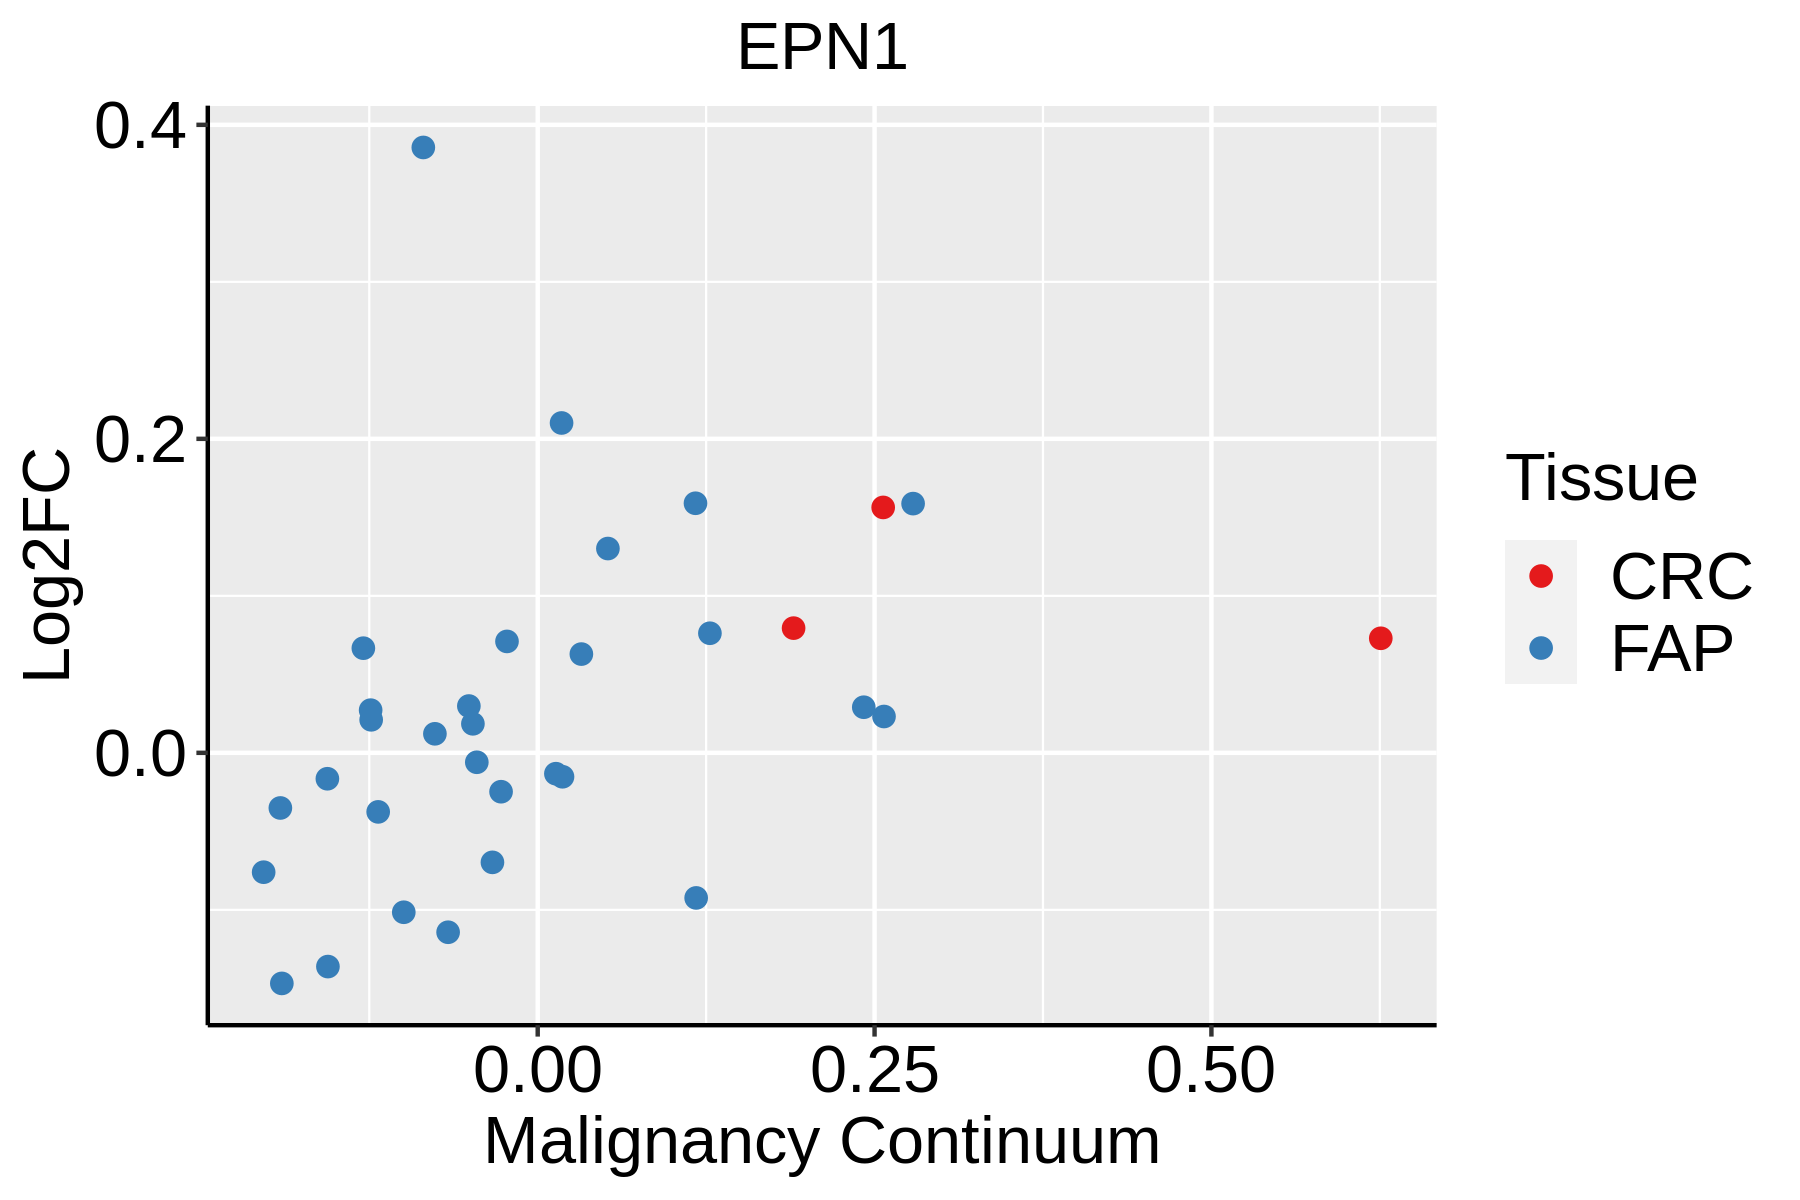 | FAP: Familial adenomatous polyposis |
| CRC: Colorectal cancer | ||
| Colorectum (HTA11) |  | AD: Adenomas |
| SER: Sessile serrated lesions | ||
| MSI-H: Microsatellite-high colorectal cancer | ||
| MSS: Microsatellite stable colorectal cancer | ||
| Esophagus | 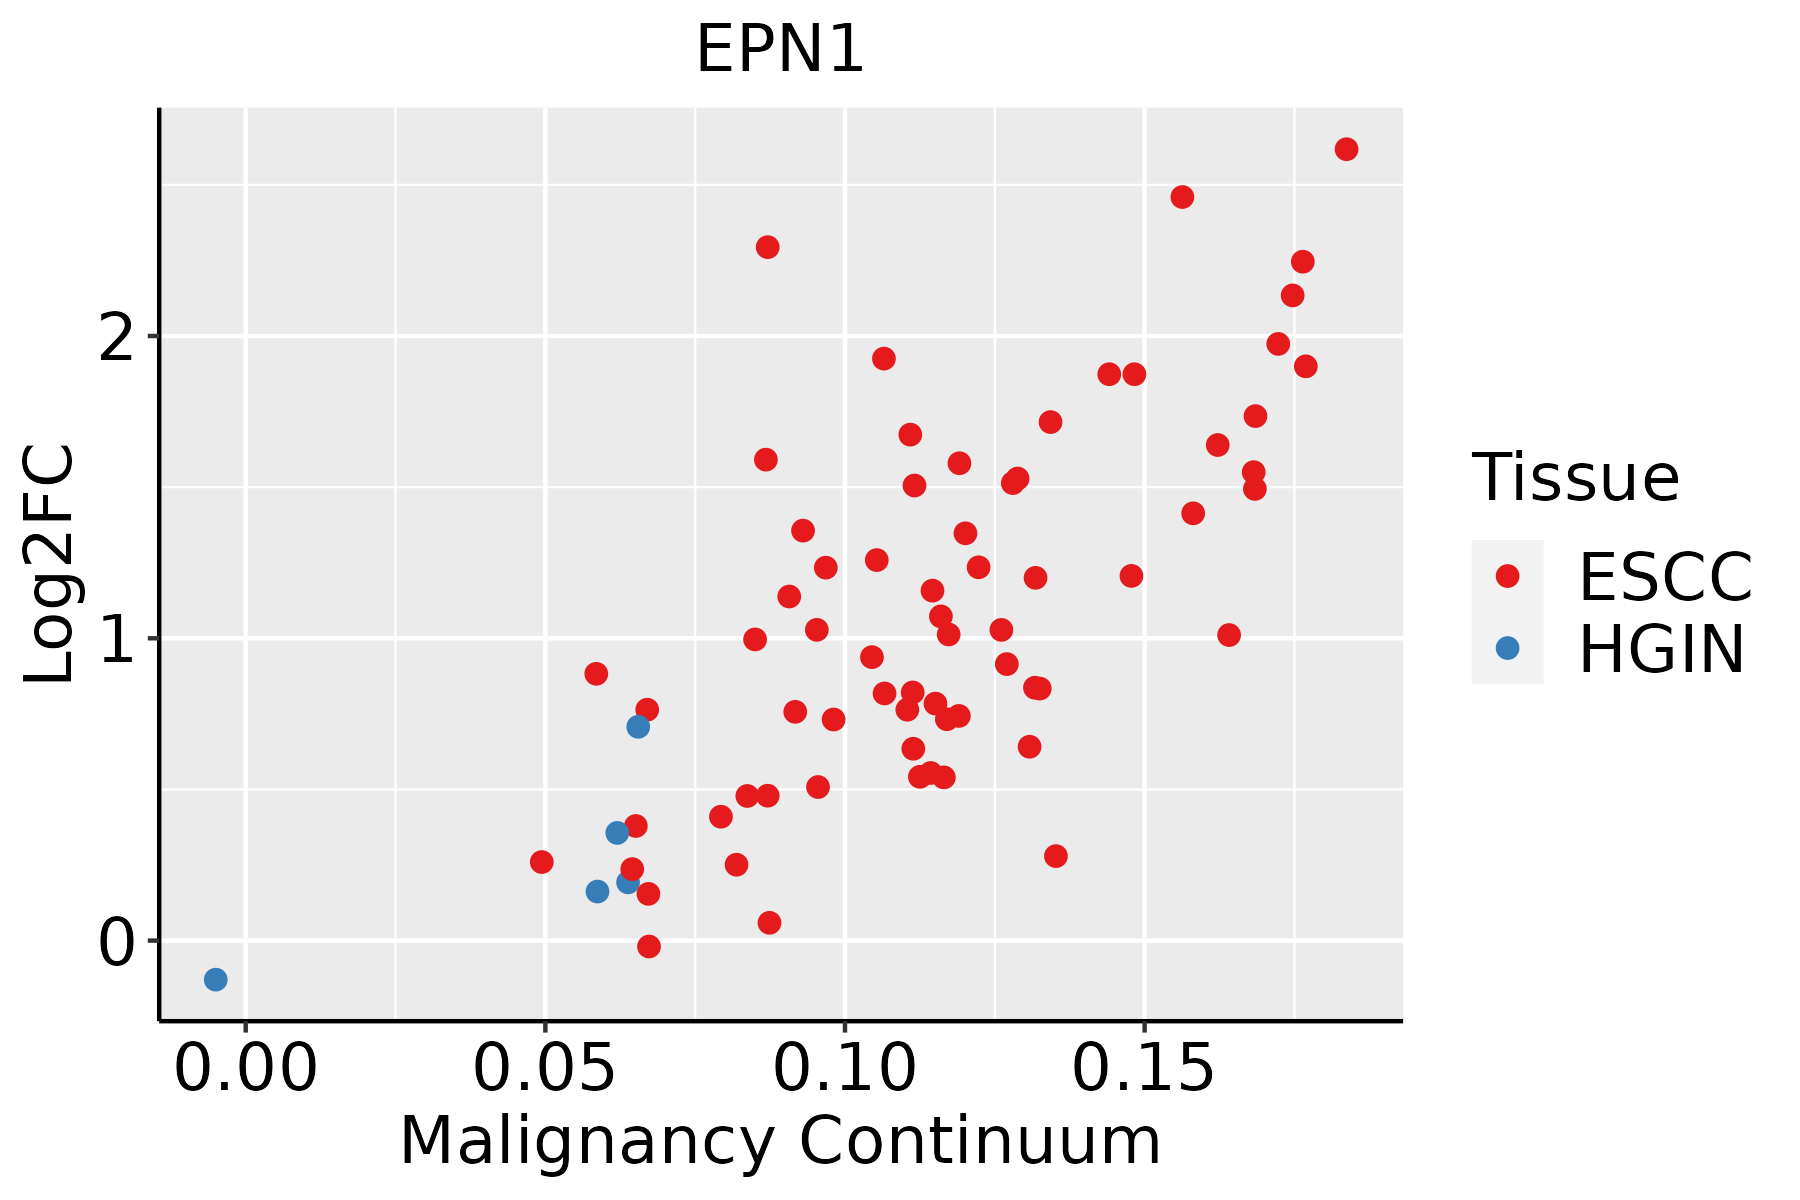 | ESCC: Esophageal squamous cell carcinoma |
| HGIN: High-grade intraepithelial neoplasias | ||
| LGIN: Low-grade intraepithelial neoplasias | ||
| Liver | 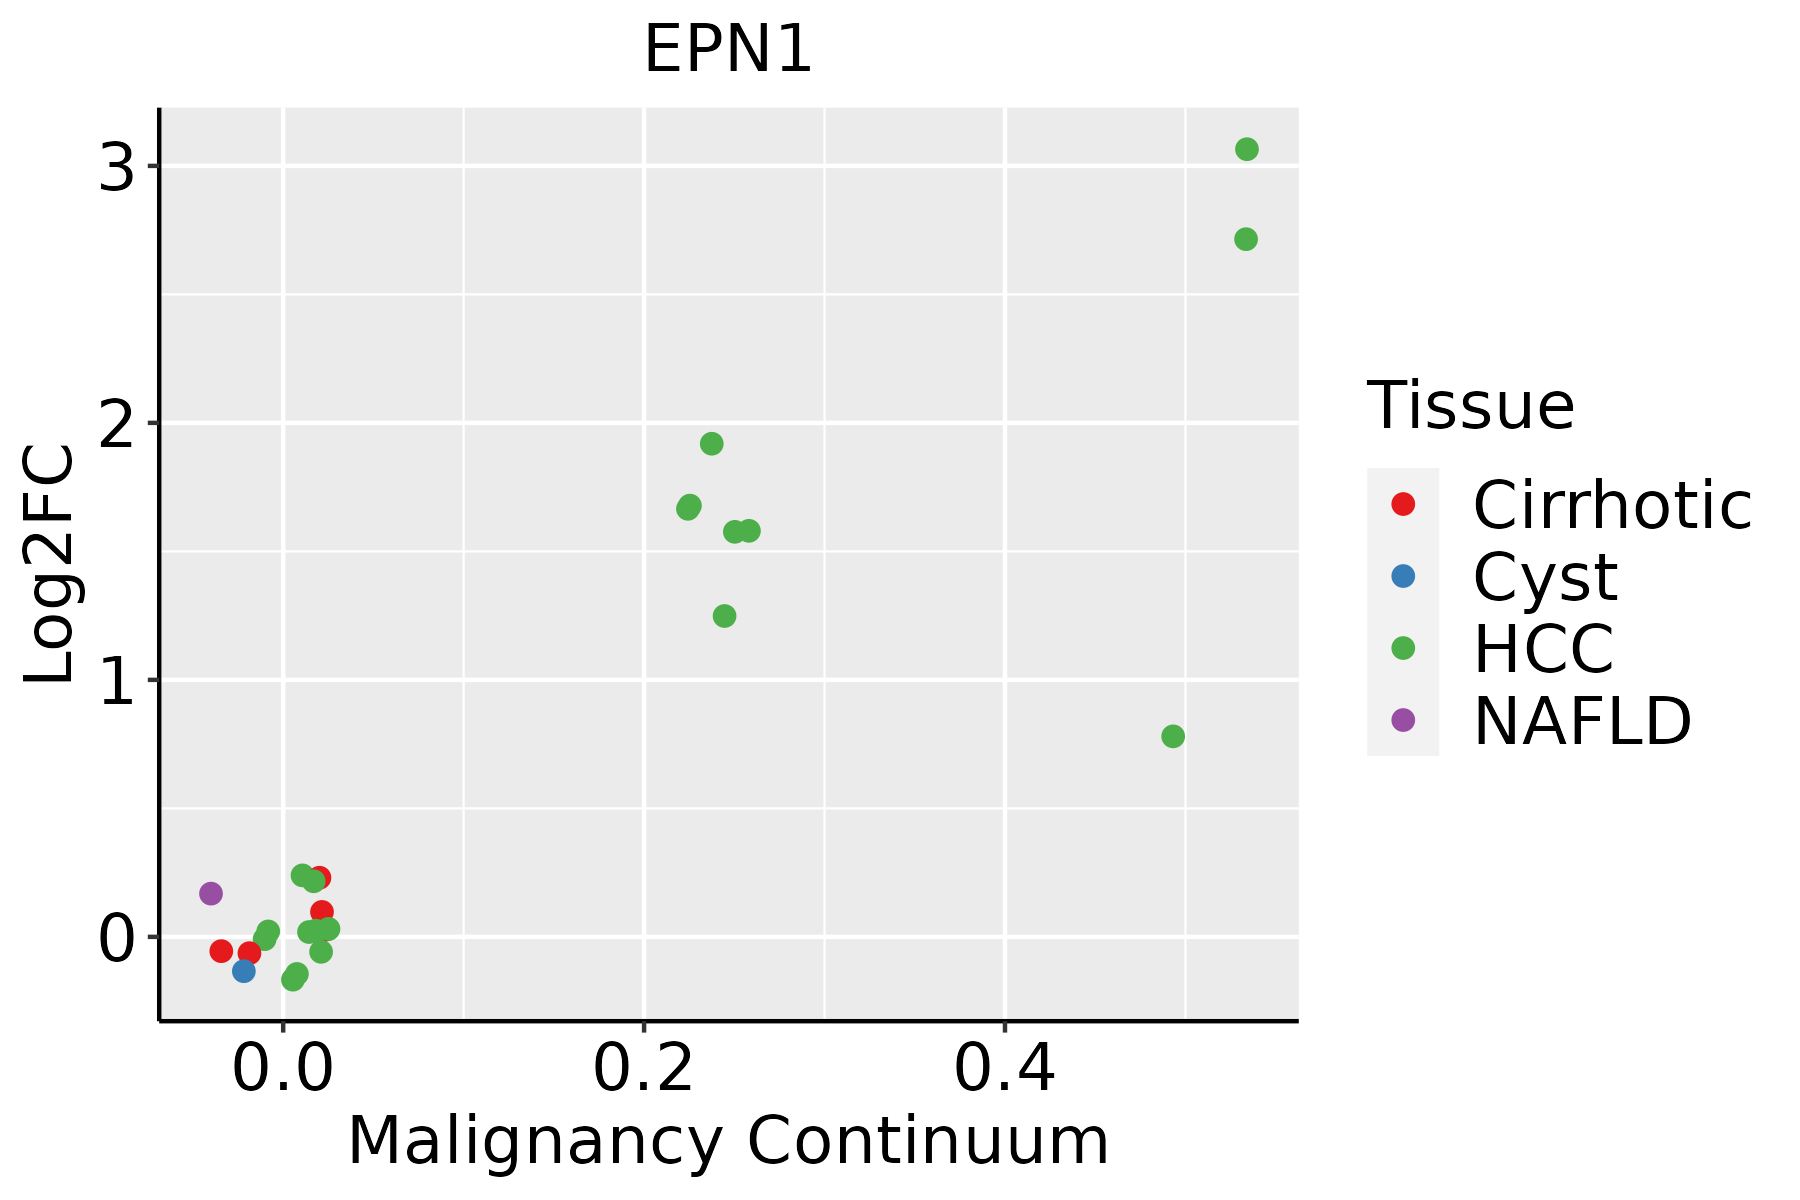 | HCC: Hepatocellular carcinoma |
| NAFLD: Non-alcoholic fatty liver disease | ||
| Oral Cavity | 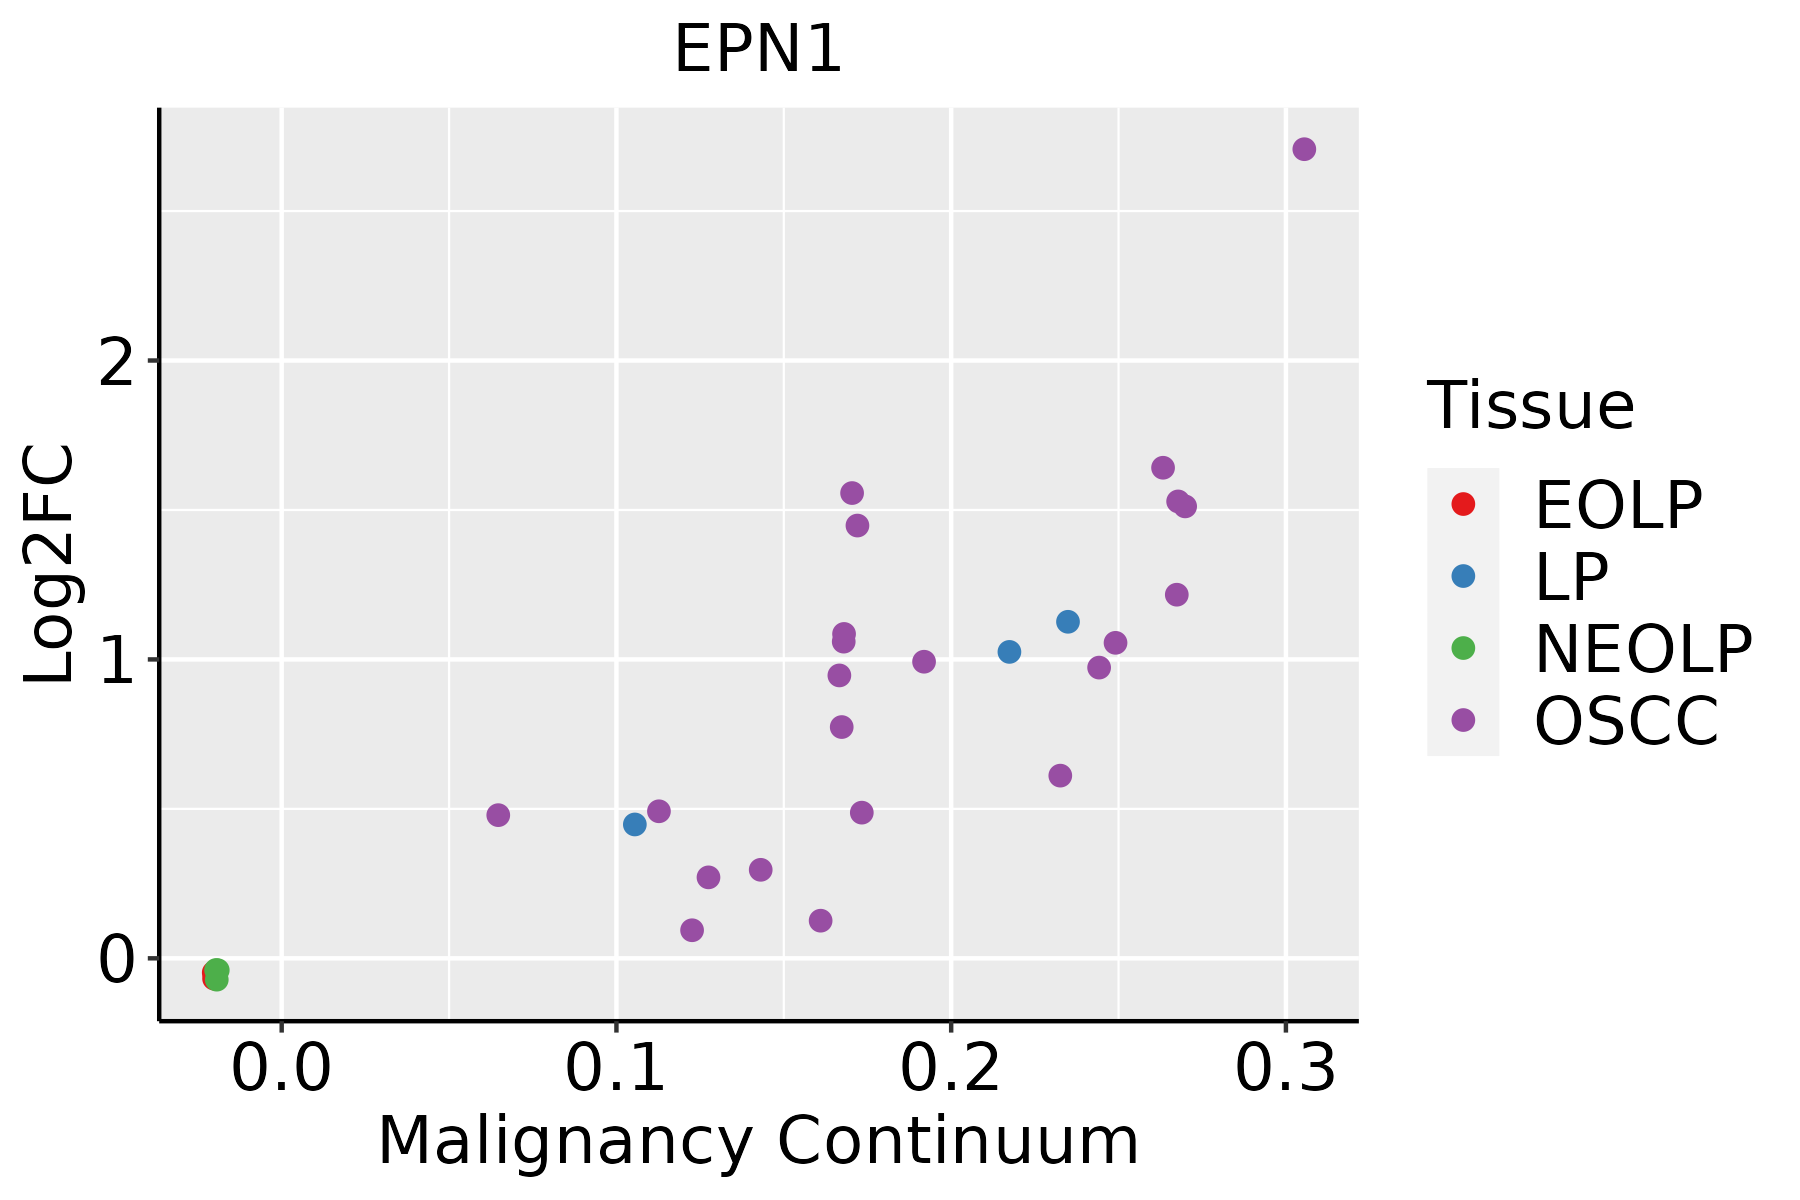 | EOLP: Erosive Oral lichen planus |
| LP: leukoplakia | ||
| NEOLP: Non-erosive oral lichen planus | ||
| OSCC: Oral squamous cell carcinoma | ||
| Skin | 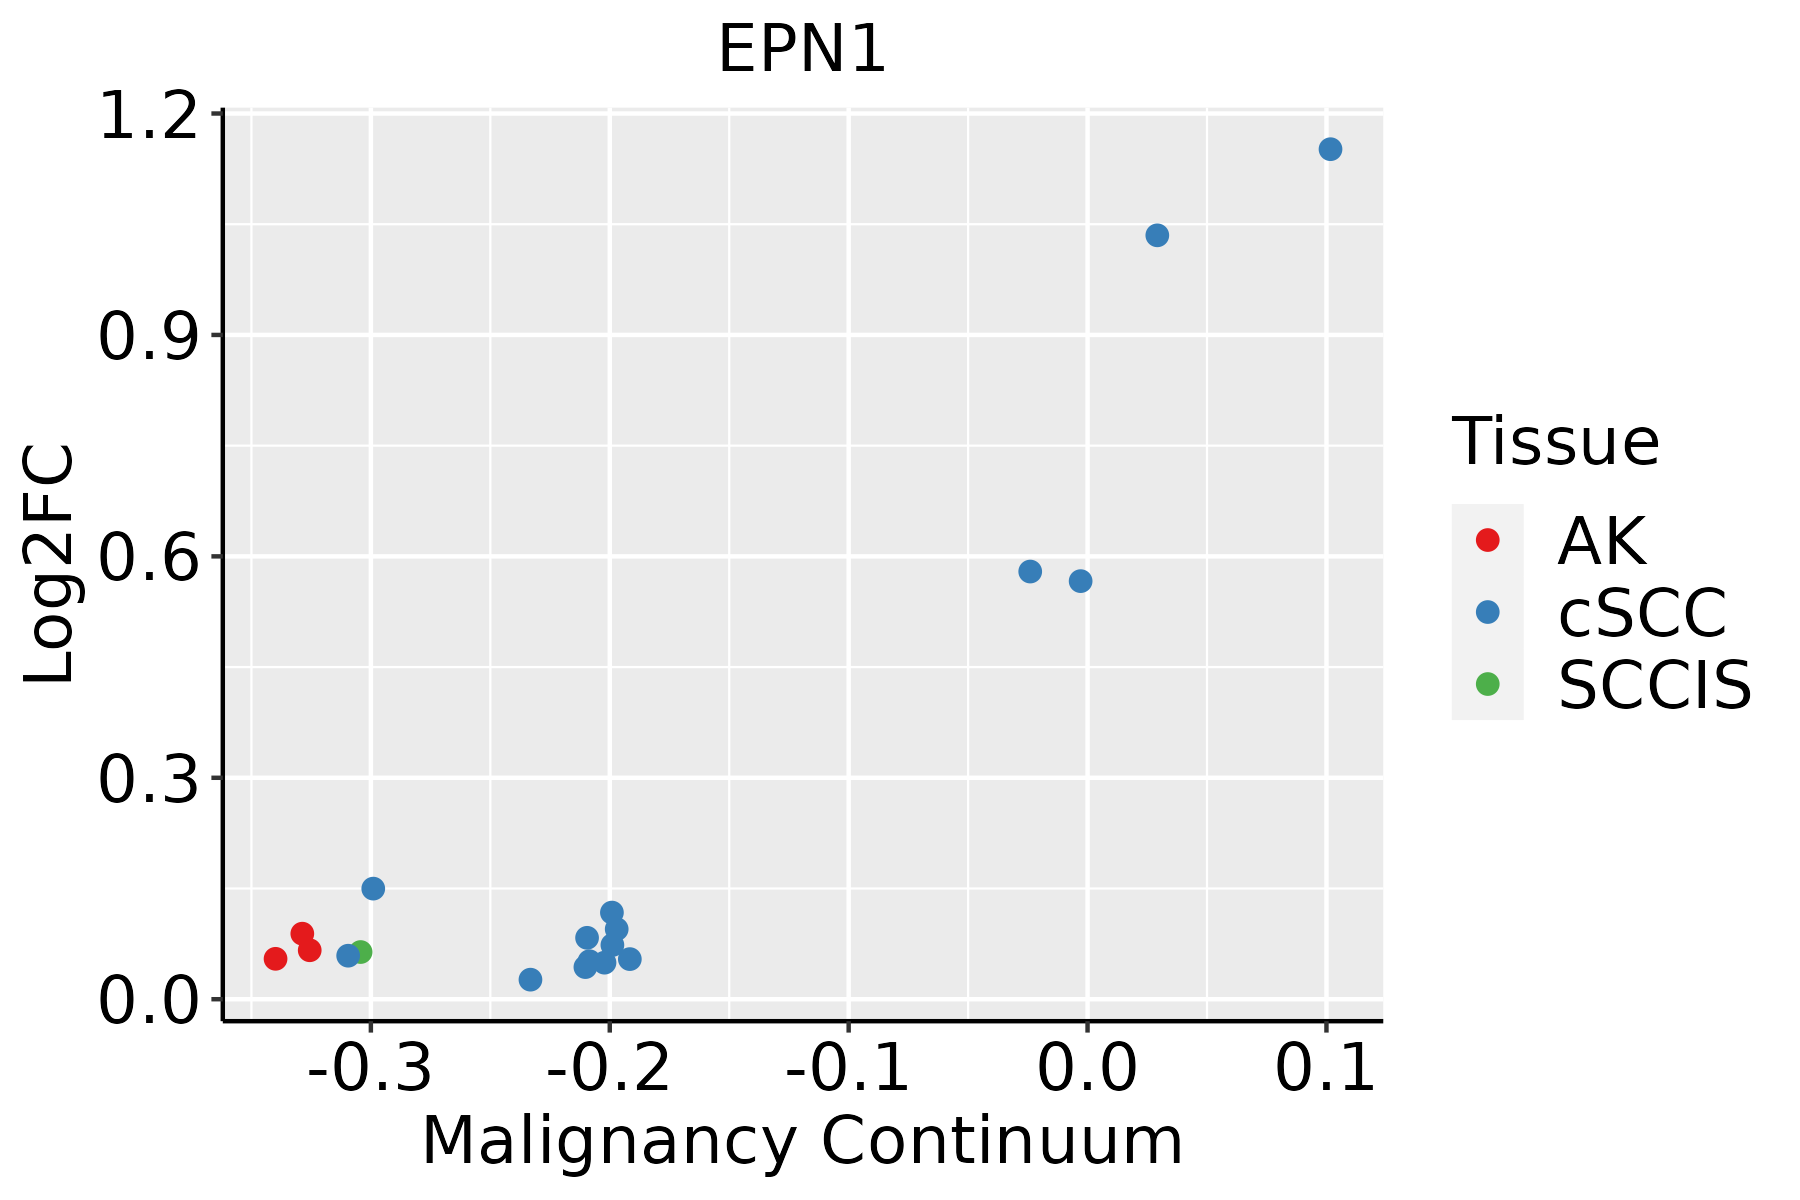 | AK: Actinic keratosis |
| cSCC: Cutaneous squamous cell carcinoma | ||
| SCCIS:squamous cell carcinoma in situ | ||
| Thyroid |  | ATC: Anaplastic thyroid cancer |
| HT: Hashimoto's thyroiditis | ||
| PTC: Papillary thyroid cancer |
| ∗log2FC in expression of this searched gene in stem-like cells from each diseased tissue sample relative to stem-like cells in normal samples in each tissue plotted against the malignancy continuum. Samples are colored based on if they are from different disease stage. |
Top |
Malignant transformation related pathway analysis |
| Find out the enriched GO biological processes and KEGG pathways involved in transition from healthy to precancer to cancer |
| Tissue | Disease Stage | Enriched GO biological Processes |
| Colorectum | AD |  |
| Colorectum | SER |  |
| Colorectum | MSS |  |
| Colorectum | MSI-H |  |
| Colorectum | FAP |  |
| ∗Top 15 enriched GO BP terms are showed in the bar plot of each disease state in each tissue. Each row represents a significant GO biological process which is colored according to the -log10(p.adjust). |
| Page: 1 2 3 4 5 6 7 8 9 |
| GO ID | Tissue | Disease Stage | Description | Gene Ratio | Bg Ratio | pvalue | p.adjust | Count |
| GO:0001701 | Colorectum | AD | in utero embryonic development | 110/3918 | 367/18723 | 2.36e-05 | 4.62e-04 | 110 |
| GO:0048568 | Colorectum | AD | embryonic organ development | 112/3918 | 427/18723 | 4.60e-03 | 3.14e-02 | 112 |
| GO:0007219 | Colorectum | AD | Notch signaling pathway | 50/3918 | 172/18723 | 6.92e-03 | 4.26e-02 | 50 |
| GO:00017011 | Colorectum | SER | in utero embryonic development | 77/2897 | 367/18723 | 2.77e-03 | 2.48e-02 | 77 |
| GO:00017013 | Colorectum | FAP | in utero embryonic development | 81/2622 | 367/18723 | 1.58e-05 | 4.10e-04 | 81 |
| GO:00072191 | Colorectum | FAP | Notch signaling pathway | 38/2622 | 172/18723 | 2.56e-03 | 2.01e-02 | 38 |
| GO:00485682 | Colorectum | FAP | embryonic organ development | 79/2622 | 427/18723 | 5.32e-03 | 3.49e-02 | 79 |
| GO:000170118 | Esophagus | HGIN | in utero embryonic development | 77/2587 | 367/18723 | 9.56e-05 | 2.05e-03 | 77 |
| GO:000170119 | Esophagus | ESCC | in utero embryonic development | 243/8552 | 367/18723 | 1.00e-15 | 6.86e-14 | 243 |
| GO:00072197 | Esophagus | ESCC | Notch signaling pathway | 106/8552 | 172/18723 | 1.74e-05 | 1.55e-04 | 106 |
| GO:00485687 | Esophagus | ESCC | embryonic organ development | 228/8552 | 427/18723 | 7.28e-04 | 3.79e-03 | 228 |
| GO:00017015 | Liver | Cirrhotic | in utero embryonic development | 134/4634 | 367/18723 | 2.78e-07 | 6.86e-06 | 134 |
| GO:0007565 | Liver | Cirrhotic | female pregnancy | 65/4634 | 193/18723 | 3.21e-03 | 1.80e-02 | 65 |
| GO:0044706 | Liver | Cirrhotic | multi-multicellular organism process | 70/4634 | 220/18723 | 1.03e-02 | 4.61e-02 | 70 |
| GO:000170111 | Liver | HCC | in utero embryonic development | 204/7958 | 367/18723 | 2.44e-07 | 4.30e-06 | 204 |
| GO:00075651 | Liver | HCC | female pregnancy | 99/7958 | 193/18723 | 8.24e-03 | 3.23e-02 | 99 |
| GO:000170116 | Oral cavity | OSCC | in utero embryonic development | 207/7305 | 367/18723 | 7.92e-12 | 2.95e-10 | 207 |
| GO:00072196 | Oral cavity | OSCC | Notch signaling pathway | 92/7305 | 172/18723 | 7.84e-05 | 6.08e-04 | 92 |
| GO:00075657 | Oral cavity | OSCC | female pregnancy | 98/7305 | 193/18723 | 5.66e-04 | 3.27e-03 | 98 |
| GO:00447067 | Oral cavity | OSCC | multi-multicellular organism process | 105/7305 | 220/18723 | 5.05e-03 | 1.97e-02 | 105 |
| Page: 1 2 |
| Pathway ID | Tissue | Disease Stage | Description | Gene Ratio | Bg Ratio | pvalue | p.adjust | qvalue | Count |
| hsa04144 | Colorectum | AD | Endocytosis | 111/2092 | 251/8465 | 5.95e-12 | 1.42e-10 | 9.08e-11 | 111 |
| hsa041441 | Colorectum | AD | Endocytosis | 111/2092 | 251/8465 | 5.95e-12 | 1.42e-10 | 9.08e-11 | 111 |
| hsa041442 | Colorectum | SER | Endocytosis | 81/1580 | 251/8465 | 1.14e-07 | 2.36e-06 | 1.71e-06 | 81 |
| hsa041443 | Colorectum | SER | Endocytosis | 81/1580 | 251/8465 | 1.14e-07 | 2.36e-06 | 1.71e-06 | 81 |
| hsa041446 | Colorectum | FAP | Endocytosis | 78/1404 | 251/8465 | 6.20e-09 | 2.96e-07 | 1.80e-07 | 78 |
| hsa041447 | Colorectum | FAP | Endocytosis | 78/1404 | 251/8465 | 6.20e-09 | 2.96e-07 | 1.80e-07 | 78 |
| hsa0414429 | Esophagus | HGIN | Endocytosis | 76/1383 | 251/8465 | 1.74e-08 | 3.34e-07 | 2.65e-07 | 76 |
| hsa04144113 | Esophagus | HGIN | Endocytosis | 76/1383 | 251/8465 | 1.74e-08 | 3.34e-07 | 2.65e-07 | 76 |
| hsa04144210 | Esophagus | ESCC | Endocytosis | 186/4205 | 251/8465 | 9.74e-16 | 4.66e-14 | 2.39e-14 | 186 |
| hsa0414437 | Esophagus | ESCC | Endocytosis | 186/4205 | 251/8465 | 9.74e-16 | 4.66e-14 | 2.39e-14 | 186 |
| hsa0414412 | Liver | Cirrhotic | Endocytosis | 119/2530 | 251/8465 | 2.33e-09 | 4.56e-08 | 2.81e-08 | 119 |
| hsa0414413 | Liver | Cirrhotic | Endocytosis | 119/2530 | 251/8465 | 2.33e-09 | 4.56e-08 | 2.81e-08 | 119 |
| hsa0414422 | Liver | HCC | Endocytosis | 178/4020 | 251/8465 | 2.03e-14 | 5.22e-13 | 2.91e-13 | 178 |
| hsa0414432 | Liver | HCC | Endocytosis | 178/4020 | 251/8465 | 2.03e-14 | 5.22e-13 | 2.91e-13 | 178 |
| hsa0414427 | Oral cavity | OSCC | Endocytosis | 174/3704 | 251/8465 | 9.42e-17 | 4.51e-15 | 2.29e-15 | 174 |
| hsa04144112 | Oral cavity | OSCC | Endocytosis | 174/3704 | 251/8465 | 9.42e-17 | 4.51e-15 | 2.29e-15 | 174 |
| hsa0414428 | Oral cavity | LP | Endocytosis | 121/2418 | 251/8465 | 1.89e-11 | 3.70e-10 | 2.38e-10 | 121 |
| hsa0414436 | Oral cavity | LP | Endocytosis | 121/2418 | 251/8465 | 1.89e-11 | 3.70e-10 | 2.38e-10 | 121 |
| Page: 1 |
Top |
Cell-cell communication analysis |
| Identification of potential cell-cell interactions between two cell types and their ligand-receptor pairs for different disease states |
| Ligand | Receptor | LRpair | Pathway | Tissue | Disease Stage |
| Page: 1 |
Top |
Single-cell gene regulatory network inference analysis |
| Find out the significant the regulons (TFs) and the target genes of each regulon across cell types for different disease states |
| TF | Cell Type | Tissue | Disease Stage | Target Gene | RSS | Regulon Activity |
| ∗The dot plots of a searched regulon are shown for all cell subpopulations in each disease state of each tissue based on the regulon specific score inferred using pySCENIC and by calculating the average expression. |
| Page: 1 |
Top |
Somatic mutation of malignant transformation related genes |
| Annotation of somatic variants for genes involved in malignant transformation |
| Hugo Symbol | Variant Class | Variant Classification | dbSNP RS | HGVSc | HGVSp | HGVSp Short | SWISSPROT | BIOTYPE | SIFT | PolyPhen | Tumor Sample Barcode | Tissue | Histology | Sex | Age | Stage | Therapy Types | Drugs | Outcome |
| EPN1 | SNV | Missense_Mutation | rs779941442 | c.344C>T | p.Ser115Leu | p.S115L | Q9Y6I3 | protein_coding | deleterious(0) | benign(0.063) | TCGA-AC-A5XS-01 | Breast | breast invasive carcinoma | Female | >=65 | I/II | Hormone Therapy | femara | SD |
| EPN1 | SNV | Missense_Mutation | c.1391N>G | p.Pro464Arg | p.P464R | Q9Y6I3 | protein_coding | deleterious(0) | probably_damaging(0.998) | TCGA-AQ-A0Y5-01 | Breast | breast invasive carcinoma | Female | >=65 | III/IV | Chemotherapy | cytoxan | SD | |
| EPN1 | SNV | Missense_Mutation | novel | c.1262N>A | p.Gly421Asp | p.G421D | Q9Y6I3 | protein_coding | tolerated(0.07) | probably_damaging(0.999) | TCGA-BH-A0B8-01 | Breast | breast invasive carcinoma | Female | <65 | I/II | Hormone Therapy | arimidex | SD |
| EPN1 | SNV | Missense_Mutation | c.202N>G | p.Leu68Val | p.L68V | Q9Y6I3 | protein_coding | deleterious_low_confidence(0) | benign(0.015) | TCGA-EW-A1J5-01 | Breast | breast invasive carcinoma | Female | <65 | I/II | Chemotherapy | adriamycin | SD | |
| EPN1 | insertion | Frame_Shift_Ins | novel | c.1722_1723insGTTCA | p.Ser575ValfsTer44 | p.S575Vfs*44 | Q9Y6I3 | protein_coding | TCGA-A2-A0ER-01 | Breast | breast invasive carcinoma | Female | <65 | I/II | Chemotherapy | cytoxan | SD | ||
| EPN1 | SNV | Missense_Mutation | rs773713771 | c.298N>A | p.Gly100Arg | p.G100R | Q9Y6I3 | protein_coding | deleterious_low_confidence(0) | benign(0.02) | TCGA-2W-A8YY-01 | Cervix | cervical & endocervical cancer | Female | <65 | I/II | Chemotherapy | cisplatin | CR |
| EPN1 | SNV | Missense_Mutation | novel | c.1907C>G | p.Ser636Cys | p.S636C | Q9Y6I3 | protein_coding | deleterious(0) | probably_damaging(0.935) | TCGA-VS-A94X-01 | Cervix | cervical & endocervical cancer | Female | <65 | I/II | Chemotherapy | cisplatin | PD |
| EPN1 | SNV | Missense_Mutation | rs754608786 | c.673N>T | p.Arg225Cys | p.R225C | Q9Y6I3 | protein_coding | deleterious(0) | probably_damaging(0.976) | TCGA-A6-5665-01 | Colorectum | colon adenocarcinoma | Female | >=65 | I/II | Unknown | Unknown | PD |
| EPN1 | SNV | Missense_Mutation | c.910N>A | p.Ala304Thr | p.A304T | Q9Y6I3 | protein_coding | deleterious(0) | probably_damaging(0.998) | TCGA-A6-5665-01 | Colorectum | colon adenocarcinoma | Female | >=65 | I/II | Unknown | Unknown | PD | |
| EPN1 | SNV | Missense_Mutation | c.356N>A | p.Arg119His | p.R119H | Q9Y6I3 | protein_coding | deleterious(0) | probably_damaging(0.968) | TCGA-AA-3492-01 | Colorectum | colon adenocarcinoma | Female | >=65 | I/II | Unknown | Unknown | SD |
| Page: 1 2 3 4 5 6 7 8 9 |
Top |
Related drugs of malignant transformation related genes |
| Identification of chemicals and drugs interact with genes involved in malignant transfromation |
| (DGIdb 4.0) |
| Entrez ID | Symbol | Category | Interaction Types | Drug Claim Name | Drug Name | PMIDs |
| Page: 1 |

Copyright 2023-Present -The University of Texas Health Science Center at Houston |