Schematic overview of the cellular and molecular mechanisms involved in the cancer progression, including the proposed cellular and molecular mechanisms in cancer cells trajectory. AT1: alveolar type 1 cells; AT2: alveolar type 2 cells; AAH: atypical adenomatous hyperplasia; AIS: adenocarcinoma in situ; MIA: minimally invasive adenocarcinoma; IA: invasive adenocarcinoma; EMT: epithelial-mesenchymal transition

Home

Download

Statistics

Help

Contact

Center for Computational Systems Medicine
leaf

Gene summary

leaf

Malignant transformation analysis

leaf

Malignant transformation related pathway analysis

leaf

Cell-cell communication analysis

leaf

Single-cell gene regulatory network inference analysis

leaf

Somatic mutation of malignant transformation related genes

leaf

Related drugs of malignant transformation related genes

Gene: EPM2AIP1

Gene summary for EPM2AIP1

check button Gene summary.

Gene informationSpeciesHuman
Gene symbol

EPM2AIP1

Gene ID

9852

Gene nameEPM2A interacting protein 1
Gene AliasEPM2AIP1
Cytomap3p22.2
Gene Typeprotein-coding
GO ID

GO:0000271

UniProtAcc

Q7L775


Top

Malignant transformation analysis

check button Identification of the aberrant gene expression in precancerous and cancerous lesions by comparing the gene expression of stem-like cells in diseased tissues with normal stem cells
check button Malignant transformation involving gene list.
Entrez IDSymbolReplicatesSpeciesOrganTissueAdj P-valueLog2FCMalignancy
9852EPM2AIP1LZE4THumanEsophagusESCC1.24e-051.63e-010.0811
9852EPM2AIP1LZE24THumanEsophagusESCC2.67e-061.03e-010.0596
9852EPM2AIP1P2T-EHumanEsophagusESCC2.12e-172.30e-010.1177
9852EPM2AIP1P4T-EHumanEsophagusESCC2.82e-153.21e-010.1323
9852EPM2AIP1P5T-EHumanEsophagusESCC3.39e-076.10e-020.1327
9852EPM2AIP1P8T-EHumanEsophagusESCC2.05e-182.09e-010.0889
9852EPM2AIP1P9T-EHumanEsophagusESCC2.73e-056.73e-020.1131
9852EPM2AIP1P10T-EHumanEsophagusESCC6.74e-244.33e-010.116
9852EPM2AIP1P12T-EHumanEsophagusESCC4.05e-326.46e-010.1122
9852EPM2AIP1P15T-EHumanEsophagusESCC8.18e-111.42e-010.1149
9852EPM2AIP1P16T-EHumanEsophagusESCC1.38e-183.59e-010.1153
9852EPM2AIP1P20T-EHumanEsophagusESCC1.58e-045.16e-020.1124
9852EPM2AIP1P21T-EHumanEsophagusESCC3.57e-221.37e-010.1617
9852EPM2AIP1P22T-EHumanEsophagusESCC7.02e-273.46e-010.1236
9852EPM2AIP1P23T-EHumanEsophagusESCC1.35e-051.40e-010.108
9852EPM2AIP1P24T-EHumanEsophagusESCC3.88e-076.43e-020.1287
9852EPM2AIP1P26T-EHumanEsophagusESCC1.86e-263.91e-010.1276
9852EPM2AIP1P27T-EHumanEsophagusESCC2.72e-121.52e-010.1055
9852EPM2AIP1P28T-EHumanEsophagusESCC3.38e-242.89e-010.1149
9852EPM2AIP1P30T-EHumanEsophagusESCC1.86e-073.38e-010.137
Page: 1 2 3 4 

check button Transcriptomic changes along malignancy continuum.
TissueExpression DynamicsAbbreviation
EsophagusThe image shows the transcriptomic changes along malignancy continuum.log2FC in expression of this searched gene in stem-like cells from each diseased tissue sample relative to stem-like cells in normal samples in each tissue plotted against the malignancy continuum. Samples are colored based on if they are from different disease stage.ESCC: Esophageal squamous cell carcinoma
HGIN: High-grade intraepithelial neoplasias
LGIN: Low-grade intraepithelial neoplasias
LiverThe image shows the transcriptomic changes along malignancy continuum.log2FC in expression of this searched gene in stem-like cells from each diseased tissue sample relative to stem-like cells in normal samples in each tissue plotted against the malignancy continuum. Samples are colored based on if they are from different disease stage.
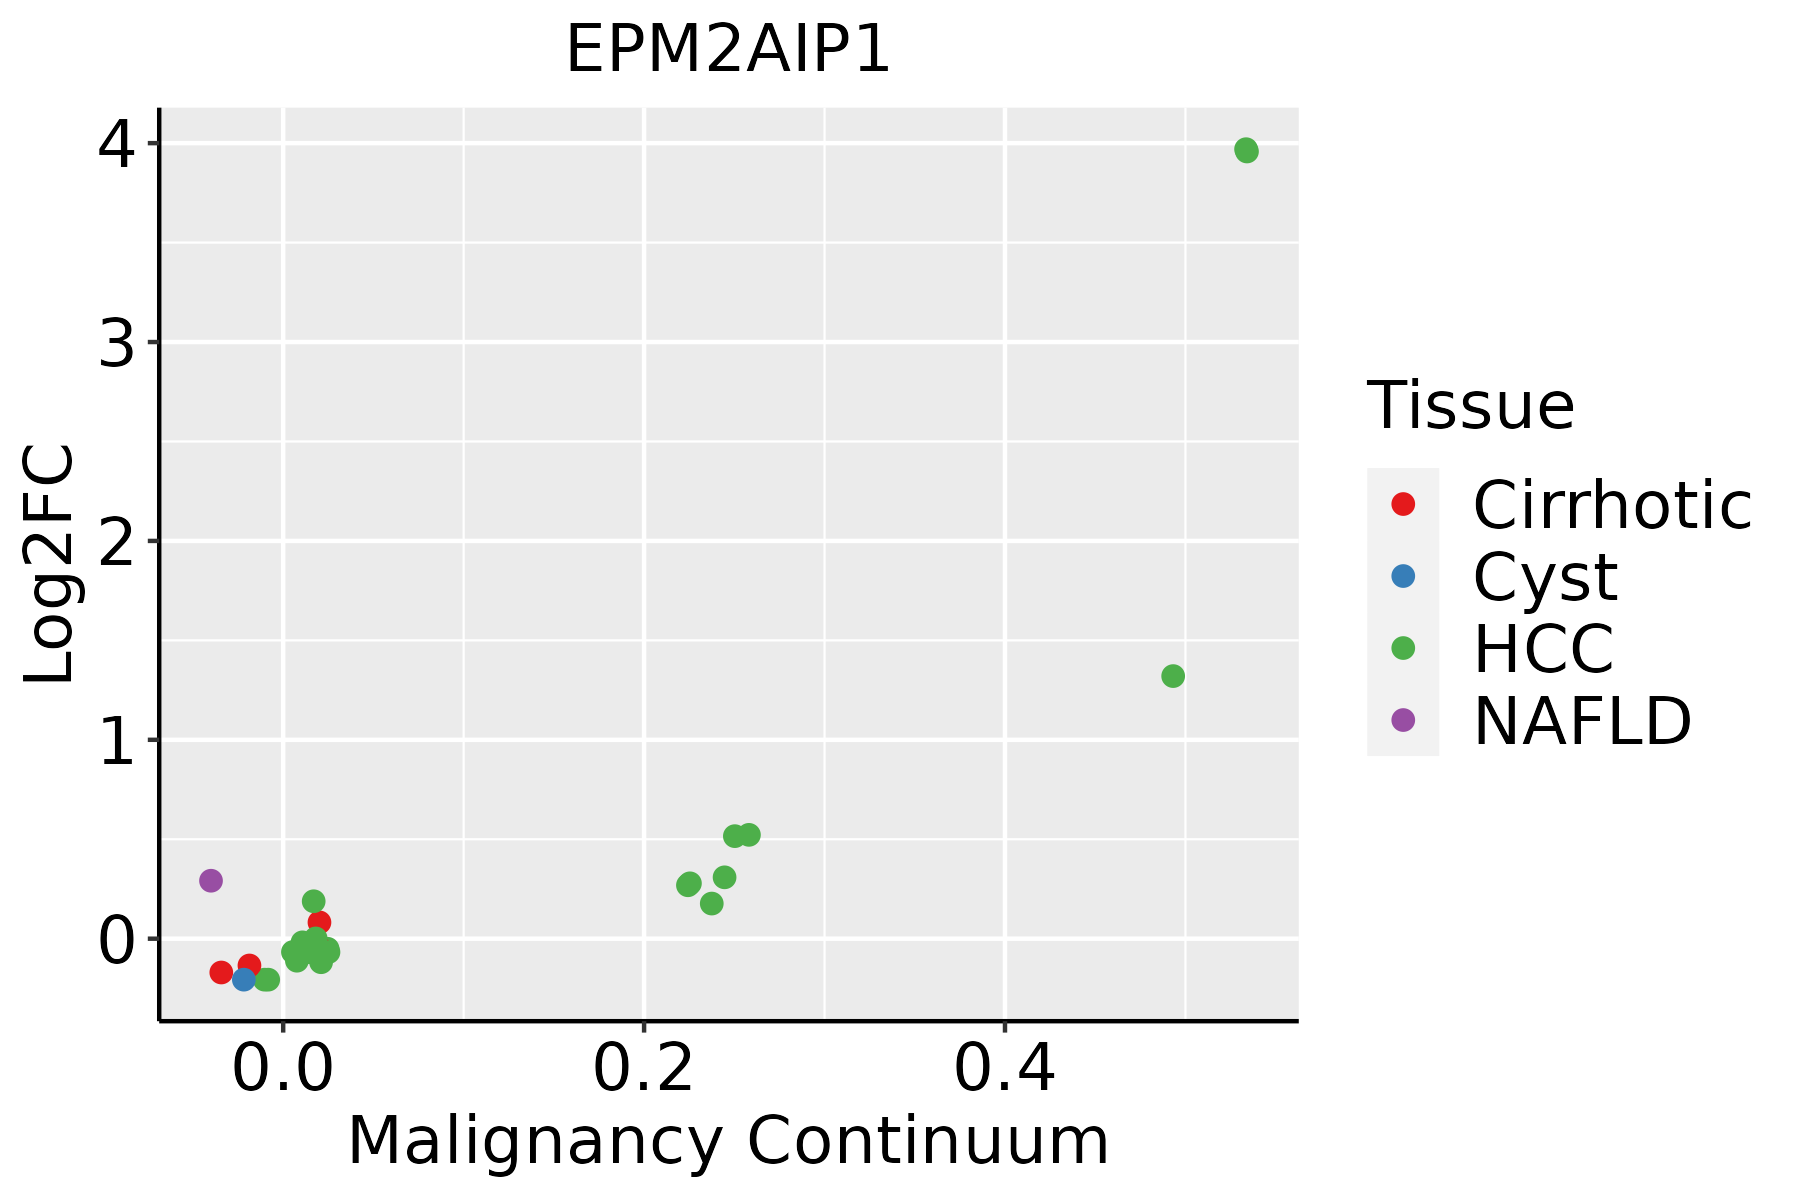
HCC: Hepatocellular carcinoma
NAFLD: Non-alcoholic fatty liver disease
SkinThe image shows the transcriptomic changes along malignancy continuum.log2FC in expression of this searched gene in stem-like cells from each diseased tissue sample relative to stem-like cells in normal samples in each tissue plotted against the malignancy continuum. Samples are colored based on if they are from different disease stage.AK: Actinic keratosis
cSCC: Cutaneous squamous cell carcinoma
SCCIS:squamous cell carcinoma in situ
ThyroidThe image shows the transcriptomic changes along malignancy continuum.log2FC in expression of this searched gene in stem-like cells from each diseased tissue sample relative to stem-like cells in normal samples in each tissue plotted against the malignancy continuum. Samples are colored based on if they are from different disease stage.
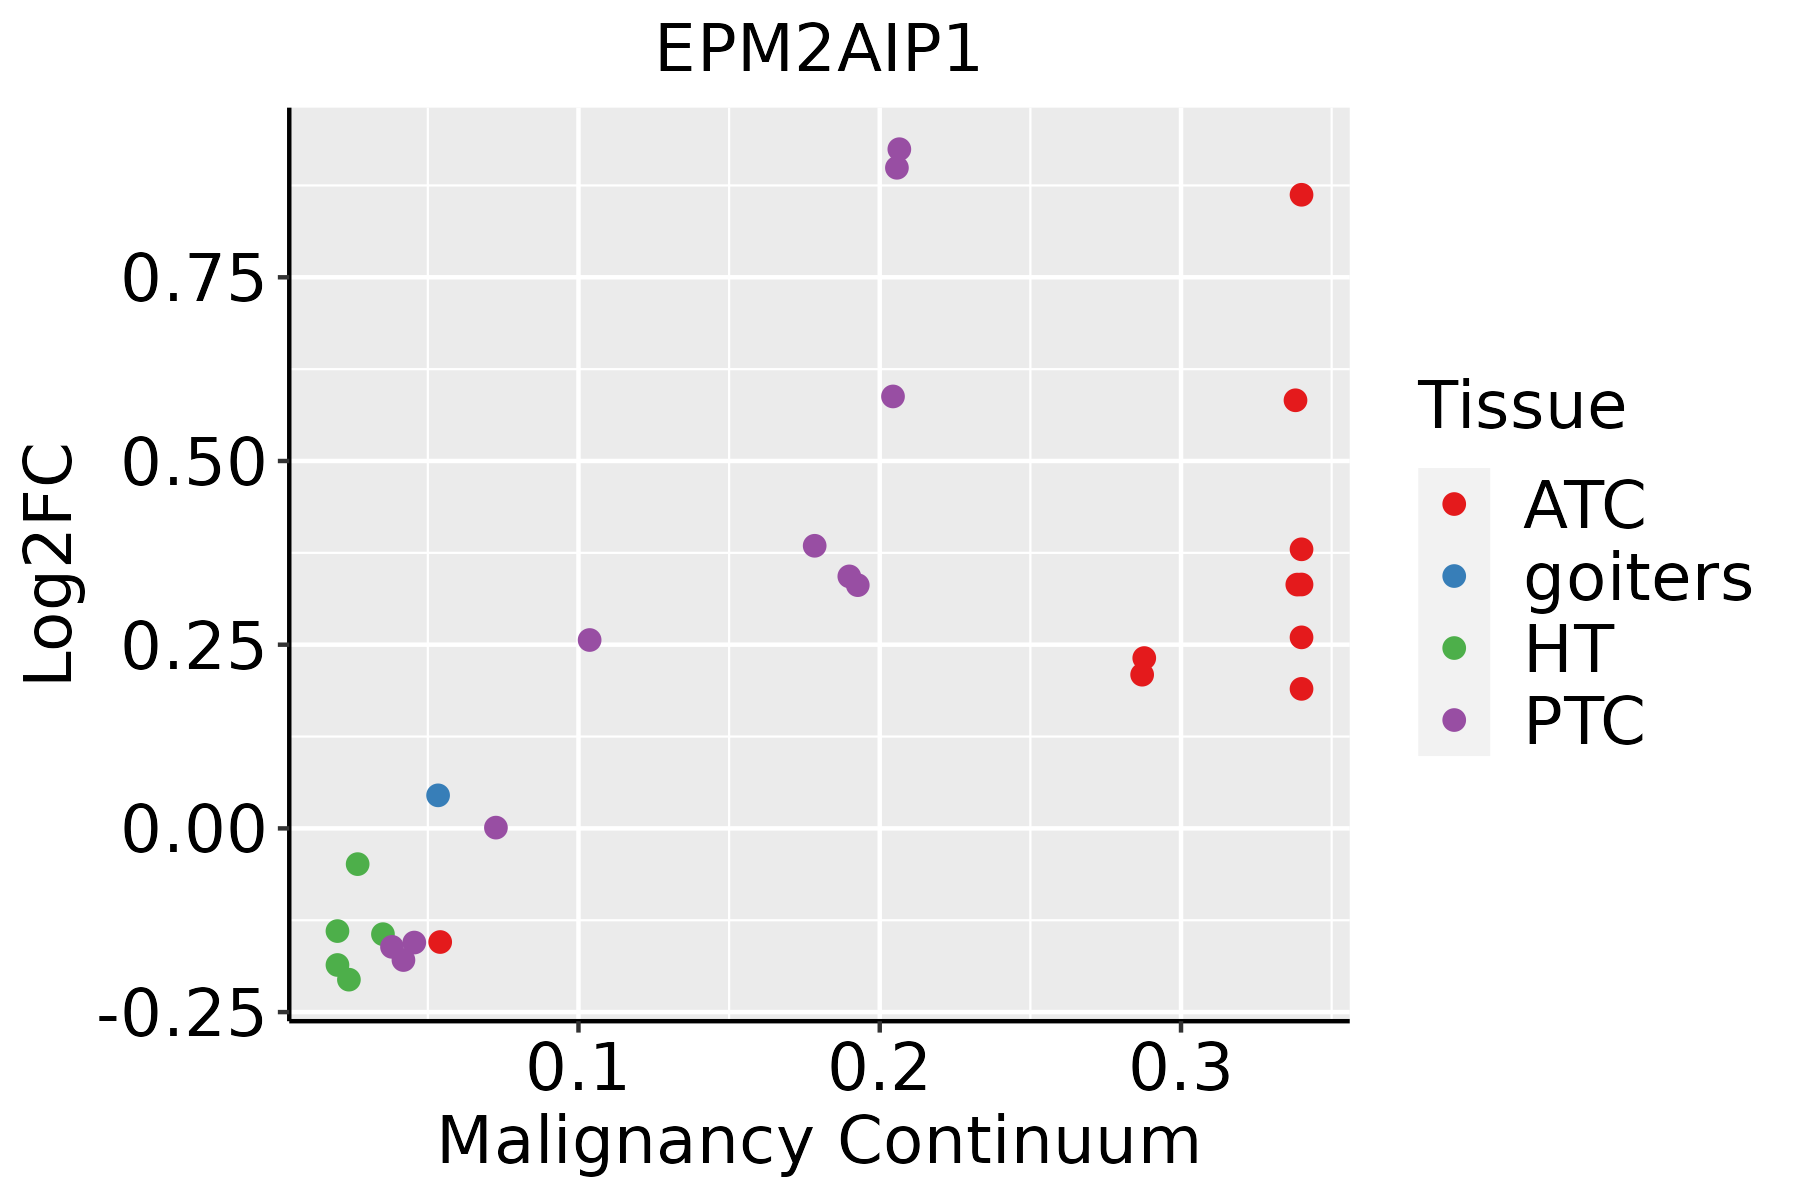
ATC: Anaplastic thyroid cancer
HT: Hashimoto's thyroiditis
PTC: Papillary thyroid cancer
∗log2FC in expression of this searched gene in stem-like cells from each diseased tissue sample relative to stem-like cells in normal samples in each tissue plotted against the malignancy continuum. Samples are colored based on if they are from different disease stage.

Top

Malignant transformation related pathway analysis

check buttonFind out the enriched GO biological processes and KEGG pathways involved in transition from healthy to precancer to cancer
check button Figure of enriched GO biological processes.
TissueDisease StageEnriched GO biological Processes
ColorectumADGO analysis - Figure of enriched GO biological processes: Top 15 enriched GO BP terms are showed in the bar plot of each disease state in each tissue. Each row represents a significant GO biological process which is colored according to the -log10(p.adjust).
ColorectumSERGO analysis - Figure of enriched GO biological processes: Top 15 enriched GO BP terms are showed in the bar plot of each disease state in each tissue. Each row represents a significant GO biological process which is colored according to the -log10(p.adjust).
ColorectumMSSGO analysis - Figure of enriched GO biological processes: Top 15 enriched GO BP terms are showed in the bar plot of each disease state in each tissue. Each row represents a significant GO biological process which is colored according to the -log10(p.adjust).
ColorectumMSI-HGO analysis - Figure of enriched GO biological processes: Top 15 enriched GO BP terms are showed in the bar plot of each disease state in each tissue. Each row represents a significant GO biological process which is colored according to the -log10(p.adjust).
ColorectumFAPGO analysis - Figure of enriched GO biological processes: Top 15 enriched GO BP terms are showed in the bar plot of each disease state in each tissue. Each row represents a significant GO biological process which is colored according to the -log10(p.adjust).
∗Top 15 enriched GO BP terms are showed in the bar plot of each disease state in each tissue. Each row represents a significant GO biological process which is colored according to the -log10(p.adjust).
Page: 1 2 3 4 5 6 7 8 9 

check button Enriched GO biological processes.
GO IDTissueDisease StageDescriptionGene RatioBg Ratiopvaluep.adjustCount
GO:0006091110EsophagusESCCgeneration of precursor metabolites and energy331/8552490/187233.86e-238.45e-21331
GO:0015980110EsophagusESCCenergy derivation by oxidation of organic compounds220/8552318/187231.20e-171.09e-15220
GO:00059969EsophagusESCCmonosaccharide metabolic process159/8552257/187231.11e-071.81e-06159
GO:00193189EsophagusESCChexose metabolic process147/8552237/187232.63e-073.94e-06147
GO:0043434111EsophagusESCCresponse to peptide hormone234/8552414/187234.93e-065.21e-05234
GO:003286818EsophagusESCCresponse to insulin156/8552264/187237.21e-067.20e-05156
GO:00060069EsophagusESCCglucose metabolic process119/8552196/187231.51e-051.36e-04119
GO:004346719EsophagusESCCregulation of generation of precursor metabolites and energy81/8552130/187239.58e-056.81e-0481
GO:00442626EsophagusESCCcellular carbohydrate metabolic process160/8552283/187231.43e-049.66e-04160
GO:00160514EsophagusESCCcarbohydrate biosynthetic process117/8552202/187232.96e-041.79e-03117
GO:00620129EsophagusESCCregulation of small molecule metabolic process184/8552334/187233.11e-041.85e-03184
GO:00109065EsophagusESCCregulation of glucose metabolic process71/8552119/187231.46e-036.92e-0371
GO:00061096EsophagusESCCregulation of carbohydrate metabolic process101/8552178/187231.89e-038.52e-03101
GO:00106755EsophagusESCCregulation of cellular carbohydrate metabolic process83/8552146/187234.24e-031.69e-0283
GO:00346372EsophagusESCCcellular carbohydrate biosynthetic process46/855278/187231.24e-024.13e-0246
GO:000609122LiverHCCgeneration of precursor metabolites and energy340/7958490/187234.04e-342.85e-31340
GO:001598022LiverHCCenergy derivation by oxidation of organic compounds221/7958318/187231.02e-221.86e-20221
GO:003286821LiverHCCresponse to insulin172/7958264/187237.14e-144.23e-12172
GO:000599621LiverHCCmonosaccharide metabolic process167/7958257/187232.31e-131.25e-11167
GO:001931821LiverHCChexose metabolic process155/7958237/187237.63e-133.90e-11155
Page: 1 2 3 4 

check button Enriched KEGG pathways.
Pathway IDTissueDisease StageDescriptionGene RatioBg Ratiopvaluep.adjustqvalueCount
Page: 1 

Top

Cell-cell communication analysis

check buttonIdentification of potential cell-cell interactions between two cell types and their ligand-receptor pairs for different disease states
LigandReceptorLRpairPathwayTissueDisease Stage
Page: 1 

Top

Single-cell gene regulatory network inference analysis

check buttonFind out the significant the regulons (TFs) and the target genes of each regulon across cell types for different disease states
TFCell TypeTissueDisease StageTarget GeneRSSRegulon Activity
∗The dot plots of a searched regulon are shown for all cell subpopulations in each disease state of each tissue based on the regulon specific score inferred using pySCENIC and by calculating the average expression.
Page: 1 

Top

Somatic mutation of malignant transformation related genes

check buttonAnnotation of somatic variants for genes involved in malignant transformation
Hugo SymbolVariant ClassVariant ClassificationdbSNP RSHGVScHGVSpHGVSp ShortSWISSPROTBIOTYPESIFTPolyPhenTumor Sample BarcodeTissueHistologySexAgeStageTherapy TypesDrugsOutcome
EPM2AIP1SNVMissense_Mutationnovelc.696N>Cp.Gln232Hisp.Q232HQ7L775protein_codingtolerated(0.07)possibly_damaging(0.471)TCGA-AC-A23H-01Breastbreast invasive carcinomaFemale>=65I/IIUnknownUnknownPD
EPM2AIP1SNVMissense_Mutationnovelc.646C>Tp.His216Tyrp.H216YQ7L775protein_codingtolerated(0.1)benign(0.06)TCGA-AQ-A7U7-01Breastbreast invasive carcinomaFemale<65III/IVTargeted Molecular therapyrituximabCR
EPM2AIP1insertionFrame_Shift_Insnovelc.508_509insATGACATTCCAACAGTTp.Arg170AsnfsTer35p.R170Nfs*35Q7L775protein_codingTCGA-A8-A09K-01Breastbreast invasive carcinomaFemale>=65I/IIUnknownUnknownSD
EPM2AIP1SNVMissense_Mutationnovelc.957G>Tp.Gln319Hisp.Q319HQ7L775protein_codingdeleterious(0.02)possibly_damaging(0.864)TCGA-2W-A8YY-01Cervixcervical & endocervical cancerFemale<65I/IIChemotherapycisplatinCR
EPM2AIP1SNVMissense_Mutationnovelc.1414N>Cp.Glu472Glnp.E472QQ7L775protein_codingtolerated(0.2)benign(0.188)TCGA-HM-A4S6-01Cervixcervical & endocervical cancerFemale<65III/IVChemotherapycisplatinCR
EPM2AIP1SNVMissense_Mutationc.1282N>Ap.Glu428Lysp.E428KQ7L775protein_codingtolerated(0.3)benign(0.37)TCGA-JW-A5VL-01Cervixcervical & endocervical cancerFemale<65I/IIUnknownUnknownSD
EPM2AIP1SNVMissense_Mutationrs762116131c.1007N>Ap.Arg336Glnp.R336QQ7L775protein_codingtolerated(0.26)possibly_damaging(0.818)TCGA-VS-A94Z-01Cervixcervical & endocervical cancerFemale<65I/IIChemotherapycisplatinCR
EPM2AIP1SNVMissense_Mutationnovelc.907N>Ap.Glu303Lysp.E303KQ7L775protein_codingtolerated(0.84)benign(0.107)TCGA-VS-A958-01Cervixcervical & endocervical cancerFemale<65I/IIChemotherapycisplatinCR
EPM2AIP1insertionNonsense_Mutationnovelc.638_639insGTGAAGAAATp.Asn213LysfsTer2p.N213Kfs*2Q7L775protein_codingTCGA-DS-A1OC-01Cervixcervical & endocervical cancerFemale<65I/IIChemotherapygemcitabineSD
EPM2AIP1SNVMissense_Mutationc.131G>Ap.Arg44Hisp.R44HQ7L775protein_codingtolerated(0.29)benign(0.001)TCGA-AA-3672-01Colorectumcolon adenocarcinomaFemale>=65III/IVUnknownUnknownSD
Page: 1 2 3 4 5 6 

Top

Related drugs of malignant transformation related genes

check buttonIdentification of chemicals and drugs interact with genes involved in malignant transfromation
(DGIdb 4.0)
Entrez IDSymbolCategoryInteraction TypesDrug Claim NameDrug NamePMIDs
Page: 1