
|
|||||
|
 | |
| |
| |
| |
| |
| |
|
Gene: EPHX3 |
Gene summary for EPHX3 |
| Gene information | Species | Human | Gene symbol | EPHX3 | Gene ID | 79852 |
| Gene name | epoxide hydrolase 3 | |
| Gene Alias | ABHD9 | |
| Cytomap | 19p13.12 | |
| Gene Type | protein-coding | GO ID | GO:0006629 | UniProtAcc | A0A024R7F3 |
Top |
Malignant transformation analysis |
| Identification of the aberrant gene expression in precancerous and cancerous lesions by comparing the gene expression of stem-like cells in diseased tissues with normal stem cells |
| Entrez ID | Symbol | Replicates | Species | Organ | Tissue | Adj P-value | Log2FC | Malignancy |
| 79852 | EPHX3 | P1T-E | Human | Esophagus | ESCC | 1.09e-04 | 4.43e-01 | 0.0875 |
| 79852 | EPHX3 | P4T-E | Human | Esophagus | ESCC | 8.33e-13 | 3.53e-01 | 0.1323 |
| 79852 | EPHX3 | P8T-E | Human | Esophagus | ESCC | 7.90e-03 | 6.22e-02 | 0.0889 |
| 79852 | EPHX3 | P9T-E | Human | Esophagus | ESCC | 8.59e-07 | 1.71e-01 | 0.1131 |
| 79852 | EPHX3 | P20T-E | Human | Esophagus | ESCC | 7.72e-14 | 3.48e-01 | 0.1124 |
| 79852 | EPHX3 | P23T-E | Human | Esophagus | ESCC | 7.58e-51 | 1.67e+00 | 0.108 |
| 79852 | EPHX3 | P24T-E | Human | Esophagus | ESCC | 1.62e-13 | 4.01e-01 | 0.1287 |
| 79852 | EPHX3 | P28T-E | Human | Esophagus | ESCC | 2.86e-20 | 4.73e-01 | 0.1149 |
| 79852 | EPHX3 | P36T-E | Human | Esophagus | ESCC | 8.01e-25 | 1.13e+00 | 0.1187 |
| 79852 | EPHX3 | P39T-E | Human | Esophagus | ESCC | 6.56e-15 | 4.26e-01 | 0.0894 |
| 79852 | EPHX3 | P42T-E | Human | Esophagus | ESCC | 2.79e-04 | 2.54e-01 | 0.1175 |
| 79852 | EPHX3 | P44T-E | Human | Esophagus | ESCC | 2.09e-04 | 1.51e-01 | 0.1096 |
| 79852 | EPHX3 | P62T-E | Human | Esophagus | ESCC | 1.20e-04 | 1.42e-01 | 0.1302 |
| 79852 | EPHX3 | P74T-E | Human | Esophagus | ESCC | 5.30e-04 | 1.75e-01 | 0.1479 |
| 79852 | EPHX3 | P75T-E | Human | Esophagus | ESCC | 3.50e-02 | 1.01e-01 | 0.1125 |
| 79852 | EPHX3 | P80T-E | Human | Esophagus | ESCC | 3.87e-19 | 6.05e-01 | 0.155 |
| 79852 | EPHX3 | P84T-E | Human | Esophagus | ESCC | 1.06e-03 | 8.55e-01 | 0.0933 |
| 79852 | EPHX3 | P126T-E | Human | Esophagus | ESCC | 5.94e-06 | 5.29e-01 | 0.1125 |
| 79852 | EPHX3 | P127T-E | Human | Esophagus | ESCC | 8.30e-09 | 2.56e-01 | 0.0826 |
| 79852 | EPHX3 | P128T-E | Human | Esophagus | ESCC | 7.29e-27 | 6.56e-01 | 0.1241 |
| Page: 1 2 |
| Tissue | Expression Dynamics | Abbreviation |
| Esophagus | 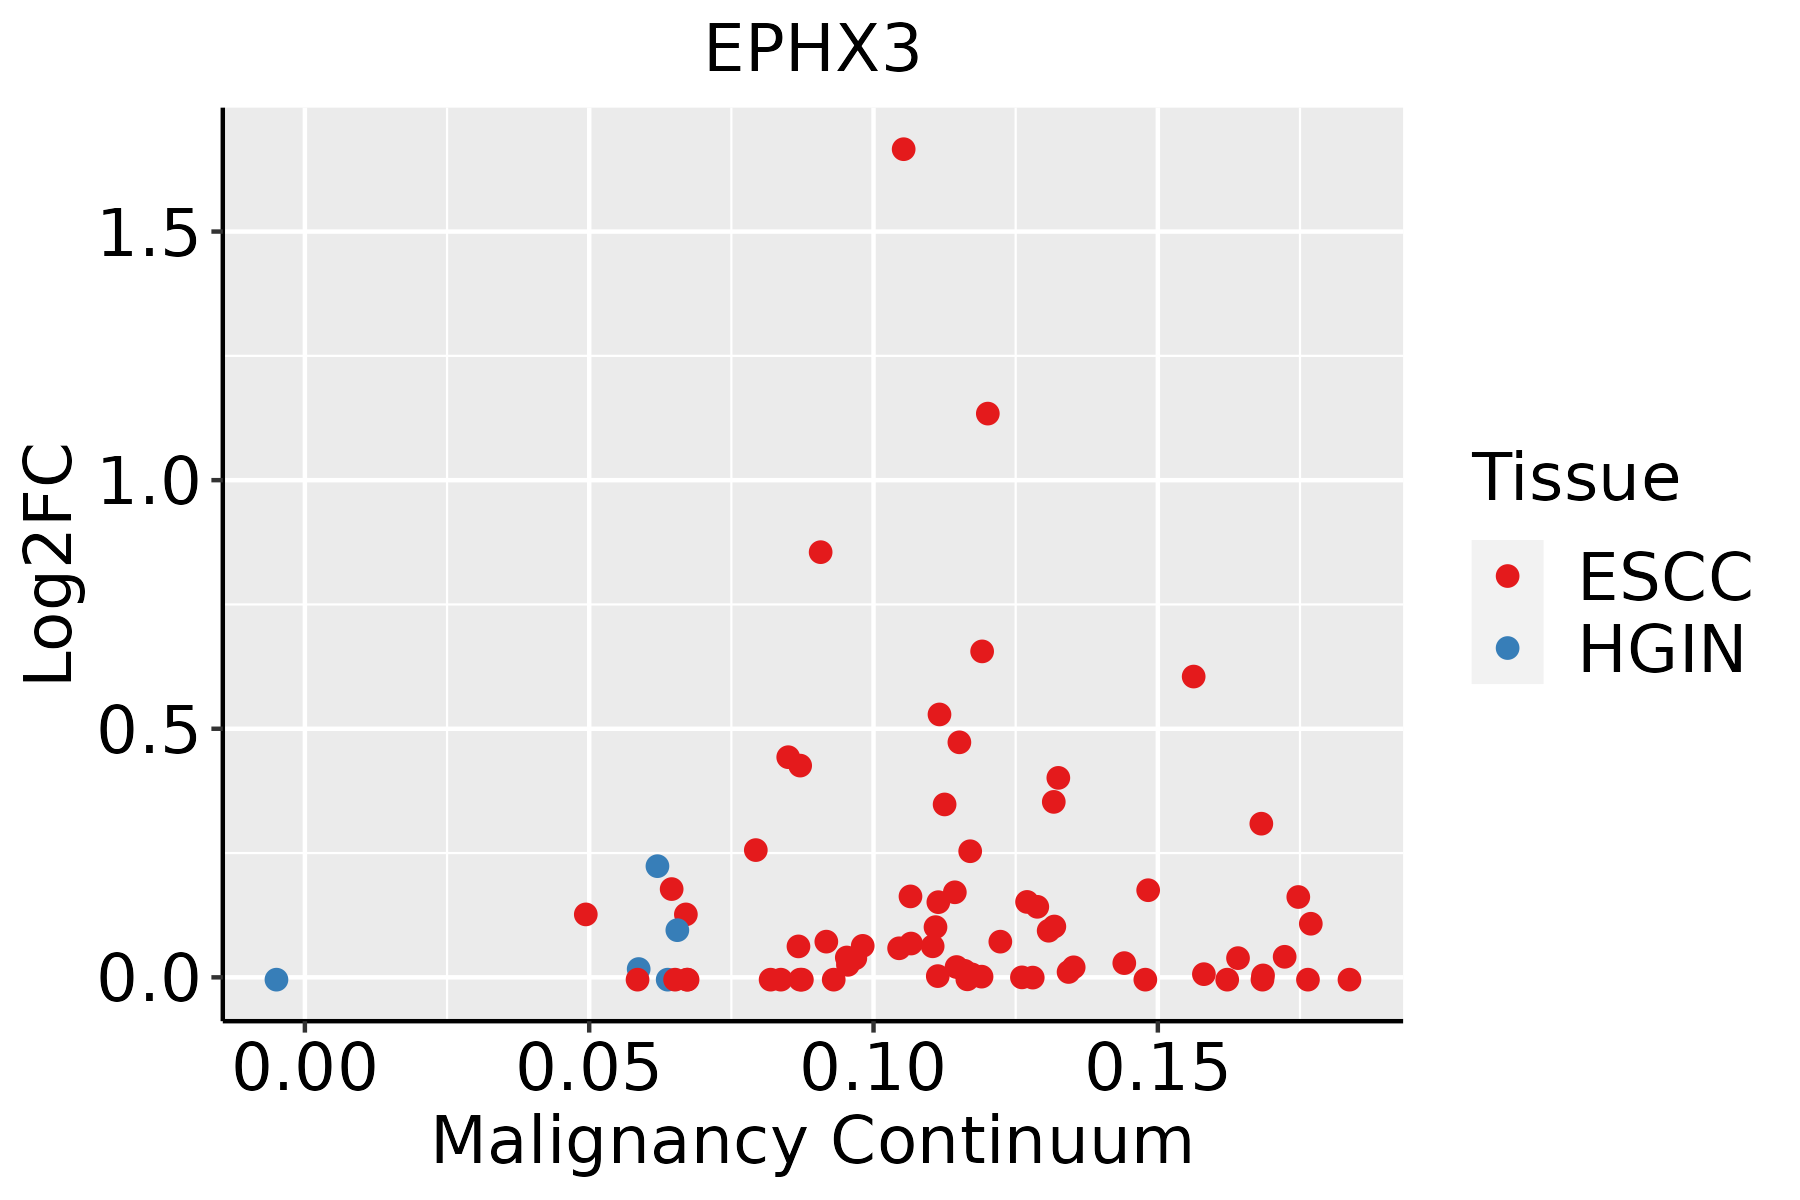 | ESCC: Esophageal squamous cell carcinoma |
| HGIN: High-grade intraepithelial neoplasias | ||
| LGIN: Low-grade intraepithelial neoplasias | ||
| Oral Cavity | 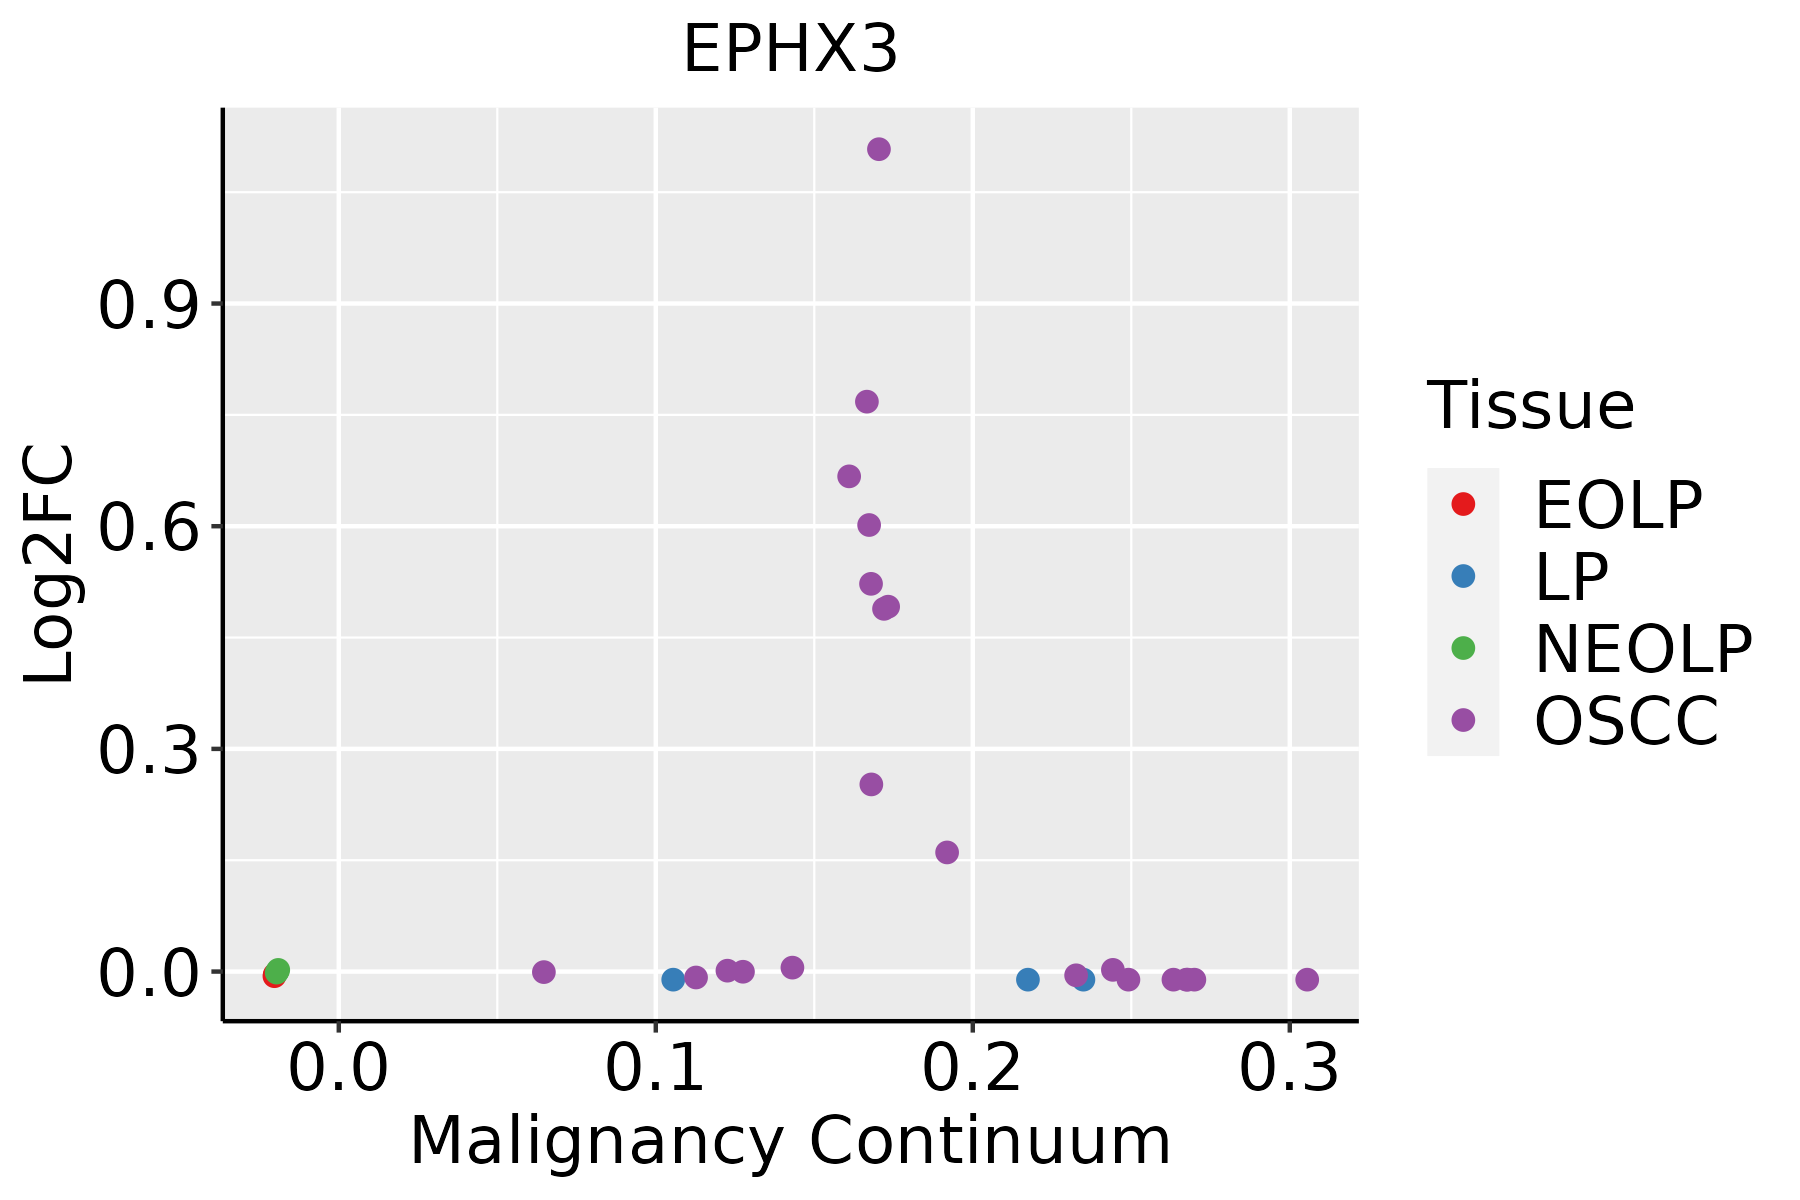 | EOLP: Erosive Oral lichen planus |
| LP: leukoplakia | ||
| NEOLP: Non-erosive oral lichen planus | ||
| OSCC: Oral squamous cell carcinoma |
| ∗log2FC in expression of this searched gene in stem-like cells from each diseased tissue sample relative to stem-like cells in normal samples in each tissue plotted against the malignancy continuum. Samples are colored based on if they are from different disease stage. |
Top |
Malignant transformation related pathway analysis |
| Find out the enriched GO biological processes and KEGG pathways involved in transition from healthy to precancer to cancer |
| Tissue | Disease Stage | Enriched GO biological Processes |
| Colorectum | AD |  |
| Colorectum | SER |  |
| Colorectum | MSS |  |
| Colorectum | MSI-H |  |
| Colorectum | FAP |  |
| ∗Top 15 enriched GO BP terms are showed in the bar plot of each disease state in each tissue. Each row represents a significant GO biological process which is colored according to the -log10(p.adjust). |
| Page: 1 2 3 4 5 6 7 8 9 |
| GO ID | Tissue | Disease Stage | Description | Gene Ratio | Bg Ratio | pvalue | p.adjust | Count |
| Page: 1 |
| Pathway ID | Tissue | Disease Stage | Description | Gene Ratio | Bg Ratio | pvalue | p.adjust | qvalue | Count |
| hsa05208211 | Esophagus | ESCC | Chemical carcinogenesis - reactive oxygen species | 168/4205 | 223/8465 | 1.83e-15 | 6.81e-14 | 3.49e-14 | 168 |
| hsa05208310 | Esophagus | ESCC | Chemical carcinogenesis - reactive oxygen species | 168/4205 | 223/8465 | 1.83e-15 | 6.81e-14 | 3.49e-14 | 168 |
| hsa0520830 | Oral cavity | OSCC | Chemical carcinogenesis - reactive oxygen species | 150/3704 | 223/8465 | 6.45e-13 | 1.20e-11 | 6.11e-12 | 150 |
| hsa05208114 | Oral cavity | OSCC | Chemical carcinogenesis - reactive oxygen species | 150/3704 | 223/8465 | 6.45e-13 | 1.20e-11 | 6.11e-12 | 150 |
| Page: 1 |
Top |
Cell-cell communication analysis |
| Identification of potential cell-cell interactions between two cell types and their ligand-receptor pairs for different disease states |
| Ligand | Receptor | LRpair | Pathway | Tissue | Disease Stage |
| Page: 1 |
Top |
Single-cell gene regulatory network inference analysis |
| Find out the significant the regulons (TFs) and the target genes of each regulon across cell types for different disease states |
| TF | Cell Type | Tissue | Disease Stage | Target Gene | RSS | Regulon Activity |
| ∗The dot plots of a searched regulon are shown for all cell subpopulations in each disease state of each tissue based on the regulon specific score inferred using pySCENIC and by calculating the average expression. |
| Page: 1 |
Top |
Somatic mutation of malignant transformation related genes |
| Annotation of somatic variants for genes involved in malignant transformation |
| Hugo Symbol | Variant Class | Variant Classification | dbSNP RS | HGVSc | HGVSp | HGVSp Short | SWISSPROT | BIOTYPE | SIFT | PolyPhen | Tumor Sample Barcode | Tissue | Histology | Sex | Age | Stage | Therapy Types | Drugs | Outcome |
| EPHX3 | SNV | Missense_Mutation | rs374205173 | c.784N>A | p.Glu262Lys | p.E262K | Q9H6B9 | protein_coding | deleterious(0.02) | possibly_damaging(0.861) | TCGA-D8-A1J9-01 | Breast | breast invasive carcinoma | Female | <65 | I/II | Unknown | Unknown | SD |
| EPHX3 | SNV | Missense_Mutation | novel | c.622T>C | p.Ser208Pro | p.S208P | Q9H6B9 | protein_coding | tolerated(0.06) | benign(0.334) | TCGA-E9-A226-01 | Breast | breast invasive carcinoma | Female | <65 | III/IV | Hormone Therapy | tamoxiphen | PD |
| EPHX3 | SNV | Missense_Mutation | novel | c.445N>C | p.Asp149His | p.D149H | Q9H6B9 | protein_coding | deleterious(0) | probably_damaging(0.991) | TCGA-EW-A1PB-01 | Breast | breast invasive carcinoma | Female | >=65 | III/IV | Unknown | Unknown | SD |
| EPHX3 | SNV | Missense_Mutation | novel | c.324N>T | p.Glu108Asp | p.E108D | Q9H6B9 | protein_coding | deleterious(0.01) | benign(0.136) | TCGA-UU-A93S-01 | Breast | breast invasive carcinoma | Female | <65 | III/IV | Unknown | Unknown | PD |
| EPHX3 | insertion | Frame_Shift_Ins | novel | c.439_440insGGCGTGGT | p.Thr147ArgfsTer17 | p.T147Rfs*17 | Q9H6B9 | protein_coding | TCGA-AN-A0FX-01 | Breast | breast invasive carcinoma | Female | <65 | I/II | Unknown | Unknown | SD | ||
| EPHX3 | insertion | Nonsense_Mutation | novel | c.437_438insAAATAAAGTATGGC | p.Tyr146Ter | p.Y146* | Q9H6B9 | protein_coding | TCGA-AN-A0FX-01 | Breast | breast invasive carcinoma | Female | <65 | I/II | Unknown | Unknown | SD | ||
| EPHX3 | SNV | Missense_Mutation | c.182N>A | p.Ser61Asn | p.S61N | Q9H6B9 | protein_coding | tolerated(0.42) | benign(0.001) | TCGA-LP-A5U2-01 | Cervix | cervical & endocervical cancer | Female | <65 | III/IV | Unknown | Unknown | SD | |
| EPHX3 | SNV | Missense_Mutation | novel | c.720N>T | p.Gln240His | p.Q240H | Q9H6B9 | protein_coding | tolerated(0.12) | benign(0.14) | TCGA-RA-A741-01 | Cervix | cervical & endocervical cancer | Female | <65 | I/II | Chemotherapy | cisplatin | SD |
| EPHX3 | insertion | Frame_Shift_Ins | novel | c.356_357insAGTAG | p.Phe120ValfsTer43 | p.F120Vfs*43 | Q9H6B9 | protein_coding | TCGA-DS-A1OD-01 | Cervix | cervical & endocervical cancer | Female | <65 | I/II | Chemotherapy | cisplatin | SD | ||
| EPHX3 | SNV | Missense_Mutation | c.256C>A | p.Arg86Ser | p.R86S | Q9H6B9 | protein_coding | deleterious(0) | benign(0.115) | TCGA-CM-6166-01 | Colorectum | colon adenocarcinoma | Female | <65 | I/II | Unknown | Unknown | SD |
| Page: 1 2 3 |
Top |
Related drugs of malignant transformation related genes |
| Identification of chemicals and drugs interact with genes involved in malignant transfromation |
| (DGIdb 4.0) |
| Entrez ID | Symbol | Category | Interaction Types | Drug Claim Name | Drug Name | PMIDs |
| Page: 1 |

Copyright 2023-Present -The University of Texas Health Science Center at Houston |