| Tissue | Expression Dynamics | Abbreviation |
| Colorectum (GSE201348) |  | FAP: Familial adenomatous polyposis |
| CRC: Colorectal cancer |
| Colorectum (HTA11) | 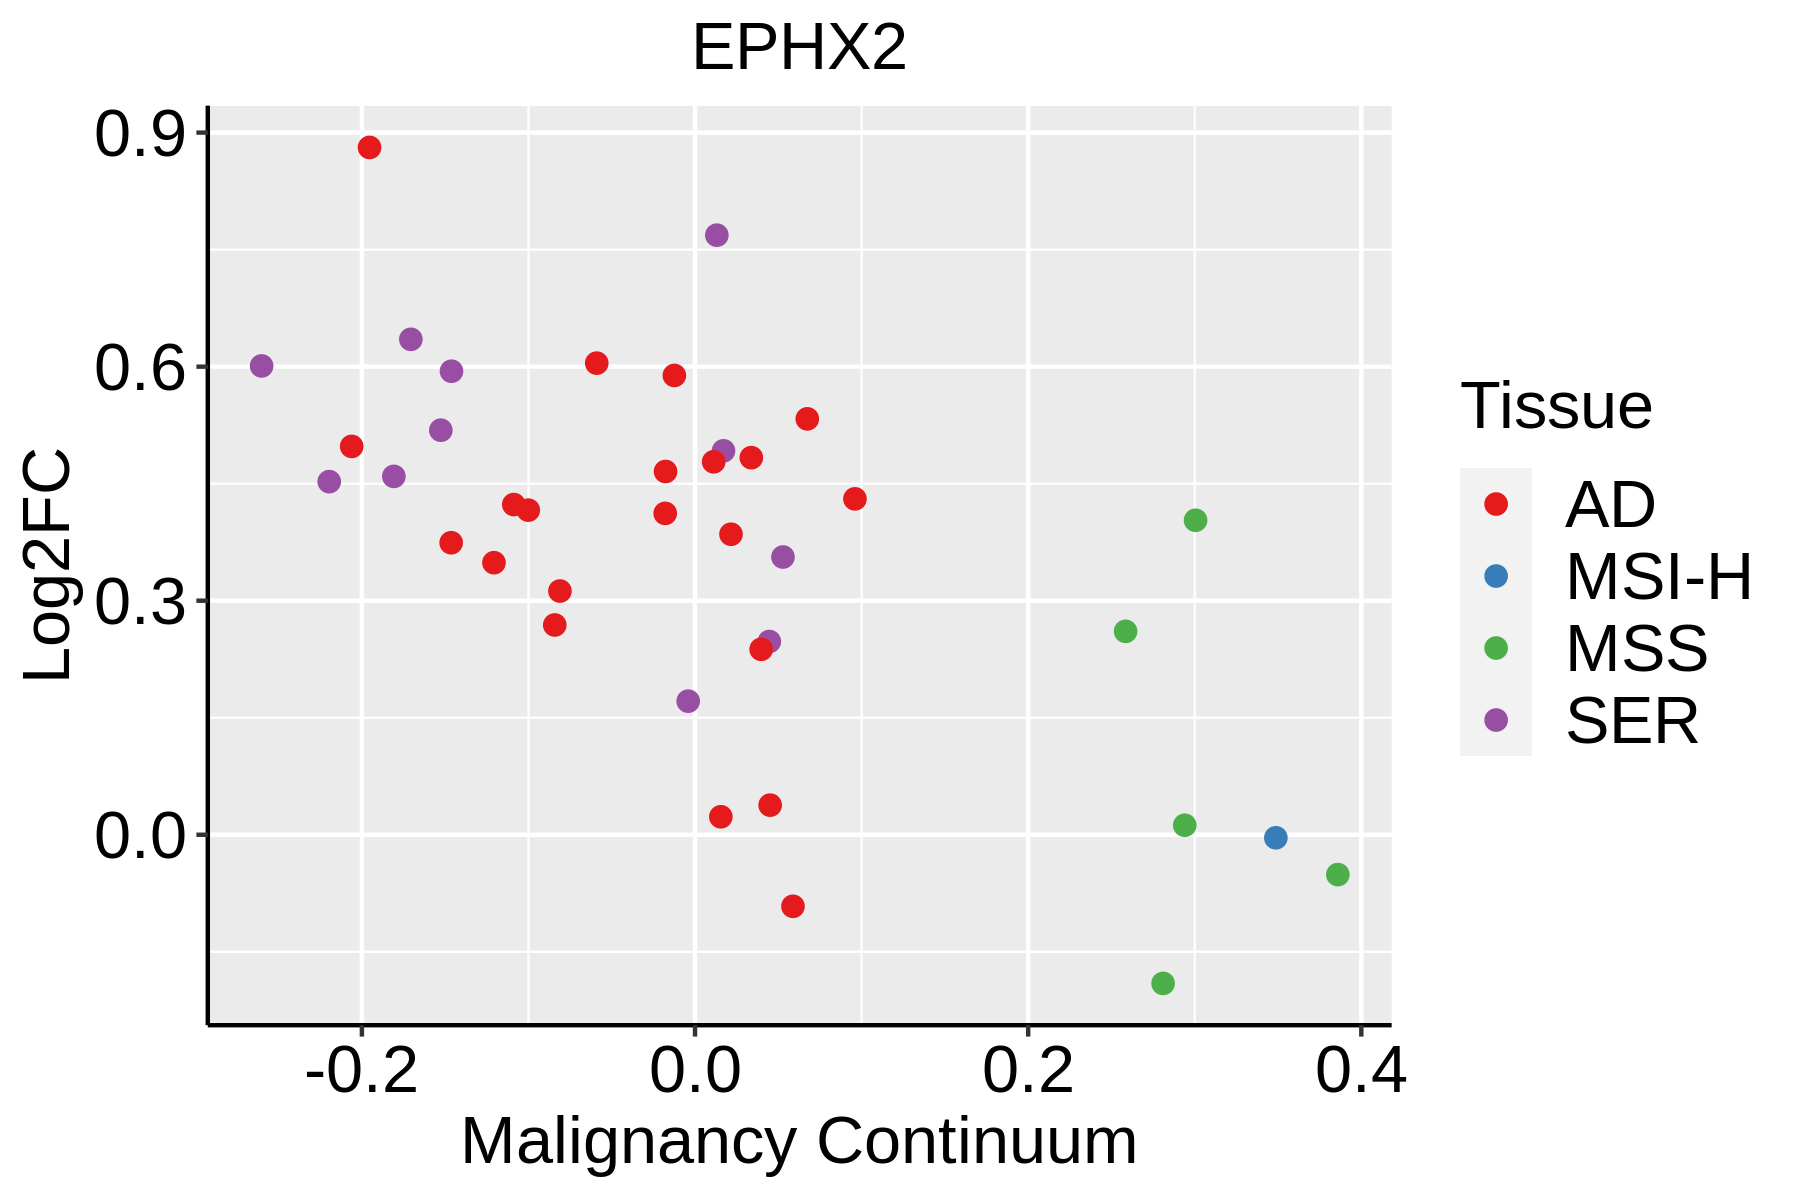 | AD: Adenomas |
| SER: Sessile serrated lesions |
| MSI-H: Microsatellite-high colorectal cancer |
| MSS: Microsatellite stable colorectal cancer |
| Esophagus |  | ESCC: Esophageal squamous cell carcinoma |
| HGIN: High-grade intraepithelial neoplasias |
| LGIN: Low-grade intraepithelial neoplasias |
| Liver |  | HCC: Hepatocellular carcinoma |
| NAFLD: Non-alcoholic fatty liver disease |
| Oral Cavity |  | EOLP: Erosive Oral lichen planus |
| LP: leukoplakia |
| NEOLP: Non-erosive oral lichen planus |
| OSCC: Oral squamous cell carcinoma |
| GO ID | Tissue | Disease Stage | Description | Gene Ratio | Bg Ratio | pvalue | p.adjust | Count |
| GO:0019439 | Colorectum | AD | aromatic compound catabolic process | 146/3918 | 467/18723 | 7.48e-08 | 3.84e-06 | 146 |
| GO:1901361 | Colorectum | AD | organic cyclic compound catabolic process | 153/3918 | 495/18723 | 8.23e-08 | 4.18e-06 | 153 |
| GO:0009636 | Colorectum | AD | response to toxic substance | 88/3918 | 262/18723 | 1.12e-06 | 3.72e-05 | 88 |
| GO:0016311 | Colorectum | AD | dephosphorylation | 123/3918 | 417/18723 | 1.84e-05 | 3.82e-04 | 123 |
| GO:0006066 | Colorectum | AD | alcohol metabolic process | 106/3918 | 353/18723 | 3.02e-05 | 5.57e-04 | 106 |
| GO:0030258 | Colorectum | AD | lipid modification | 67/3918 | 212/18723 | 1.66e-04 | 2.27e-03 | 67 |
| GO:0018904 | Colorectum | AD | ether metabolic process | 14/3918 | 27/18723 | 3.72e-04 | 4.29e-03 | 14 |
| GO:0062012 | Colorectum | AD | regulation of small molecule metabolic process | 93/3918 | 334/18723 | 1.46e-03 | 1.24e-02 | 93 |
| GO:0008202 | Colorectum | AD | steroid metabolic process | 85/3918 | 319/18723 | 8.07e-03 | 4.75e-02 | 85 |
| GO:00096361 | Colorectum | SER | response to toxic substance | 71/2897 | 262/18723 | 8.63e-07 | 4.07e-05 | 71 |
| GO:00060661 | Colorectum | SER | alcohol metabolic process | 79/2897 | 353/18723 | 3.50e-04 | 5.50e-03 | 79 |
| GO:19013611 | Colorectum | SER | organic cyclic compound catabolic process | 104/2897 | 495/18723 | 5.46e-04 | 7.63e-03 | 104 |
| GO:00194391 | Colorectum | SER | aromatic compound catabolic process | 98/2897 | 467/18723 | 8.09e-04 | 1.01e-02 | 98 |
| GO:00163111 | Colorectum | SER | dephosphorylation | 86/2897 | 417/18723 | 2.73e-03 | 2.46e-02 | 86 |
| GO:00189041 | Colorectum | SER | ether metabolic process | 10/2897 | 27/18723 | 5.18e-03 | 3.95e-02 | 10 |
| GO:00302581 | Colorectum | SER | lipid modification | 47/2897 | 212/18723 | 6.01e-03 | 4.38e-02 | 47 |
| GO:19013612 | Colorectum | MSS | organic cyclic compound catabolic process | 148/3467 | 495/18723 | 3.47e-10 | 3.18e-08 | 148 |
| GO:00194392 | Colorectum | MSS | aromatic compound catabolic process | 140/3467 | 467/18723 | 8.56e-10 | 6.85e-08 | 140 |
| GO:00096362 | Colorectum | MSS | response to toxic substance | 73/3467 | 262/18723 | 1.26e-04 | 1.94e-03 | 73 |
| GO:00060662 | Colorectum | MSS | alcohol metabolic process | 92/3467 | 353/18723 | 2.57e-04 | 3.46e-03 | 92 |
| Pathway ID | Tissue | Disease Stage | Description | Gene Ratio | Bg Ratio | pvalue | p.adjust | qvalue | Count |
| hsa05208 | Colorectum | AD | Chemical carcinogenesis - reactive oxygen species | 126/2092 | 223/8465 | 1.01e-24 | 1.68e-22 | 1.07e-22 | 126 |
| hsa052081 | Colorectum | AD | Chemical carcinogenesis - reactive oxygen species | 126/2092 | 223/8465 | 1.01e-24 | 1.68e-22 | 1.07e-22 | 126 |
| hsa052082 | Colorectum | SER | Chemical carcinogenesis - reactive oxygen species | 103/1580 | 223/8465 | 1.60e-21 | 7.57e-20 | 5.50e-20 | 103 |
| hsa052083 | Colorectum | SER | Chemical carcinogenesis - reactive oxygen species | 103/1580 | 223/8465 | 1.60e-21 | 7.57e-20 | 5.50e-20 | 103 |
| hsa052084 | Colorectum | MSS | Chemical carcinogenesis - reactive oxygen species | 118/1875 | 223/8465 | 2.71e-24 | 4.54e-22 | 2.78e-22 | 118 |
| hsa052085 | Colorectum | MSS | Chemical carcinogenesis - reactive oxygen species | 118/1875 | 223/8465 | 2.71e-24 | 4.54e-22 | 2.78e-22 | 118 |
| hsa052088 | Colorectum | FAP | Chemical carcinogenesis - reactive oxygen species | 78/1404 | 223/8465 | 1.08e-11 | 1.80e-09 | 1.09e-09 | 78 |
| hsa052089 | Colorectum | FAP | Chemical carcinogenesis - reactive oxygen species | 78/1404 | 223/8465 | 1.08e-11 | 1.80e-09 | 1.09e-09 | 78 |
| hsa05207 | Colorectum | CRC | Chemical carcinogenesis - receptor activation | 42/1091 | 212/8465 | 2.62e-03 | 1.75e-02 | 1.19e-02 | 42 |
| hsa0520810 | Colorectum | CRC | Chemical carcinogenesis - reactive oxygen species | 43/1091 | 223/8465 | 3.96e-03 | 2.36e-02 | 1.60e-02 | 43 |
| hsa052071 | Colorectum | CRC | Chemical carcinogenesis - receptor activation | 42/1091 | 212/8465 | 2.62e-03 | 1.75e-02 | 1.19e-02 | 42 |
| hsa0520811 | Colorectum | CRC | Chemical carcinogenesis - reactive oxygen species | 43/1091 | 223/8465 | 3.96e-03 | 2.36e-02 | 1.60e-02 | 43 |
| hsa05208211 | Esophagus | ESCC | Chemical carcinogenesis - reactive oxygen species | 168/4205 | 223/8465 | 1.83e-15 | 6.81e-14 | 3.49e-14 | 168 |
| hsa041467 | Esophagus | ESCC | Peroxisome | 55/4205 | 82/8465 | 1.04e-03 | 3.27e-03 | 1.68e-03 | 55 |
| hsa05208310 | Esophagus | ESCC | Chemical carcinogenesis - reactive oxygen species | 168/4205 | 223/8465 | 1.83e-15 | 6.81e-14 | 3.49e-14 | 168 |
| hsa0414612 | Esophagus | ESCC | Peroxisome | 55/4205 | 82/8465 | 1.04e-03 | 3.27e-03 | 1.68e-03 | 55 |
| hsa0520814 | Liver | NAFLD | Chemical carcinogenesis - reactive oxygen species | 44/1043 | 223/8465 | 9.22e-04 | 1.31e-02 | 1.06e-02 | 44 |
| hsa04146 | Liver | NAFLD | Peroxisome | 19/1043 | 82/8465 | 4.37e-03 | 4.10e-02 | 3.30e-02 | 19 |
| hsa0520815 | Liver | NAFLD | Chemical carcinogenesis - reactive oxygen species | 44/1043 | 223/8465 | 9.22e-04 | 1.31e-02 | 1.06e-02 | 44 |
| hsa041461 | Liver | NAFLD | Peroxisome | 19/1043 | 82/8465 | 4.37e-03 | 4.10e-02 | 3.30e-02 | 19 |
| Hugo Symbol | Variant Class | Variant Classification | dbSNP RS | HGVSc | HGVSp | HGVSp Short | SWISSPROT | BIOTYPE | SIFT | PolyPhen | Tumor Sample Barcode | Tissue | Histology | Sex | Age | Stage | Therapy Types | Drugs | Outcome |
| EPHX2 | SNV | Missense_Mutation | | c.559N>T | p.Gly187Trp | p.G187W | P34913 | protein_coding | deleterious(0) | probably_damaging(0.995) | TCGA-A7-A0DB-01 | Breast | breast invasive carcinoma | Female | <65 | I/II | Hormone Therapy | arimidex | SD |
| EPHX2 | SNV | Missense_Mutation | novel | c.1408N>C | p.Glu470Gln | p.E470Q | P34913 | protein_coding | tolerated(0.23) | benign(0.244) | TCGA-AC-A3W6-01 | Breast | breast invasive carcinoma | Female | >=65 | III/IV | Unknown | Unknown | SD |
| EPHX2 | SNV | Missense_Mutation | rs754312469 | c.805N>A | p.Glu269Lys | p.E269K | P34913 | protein_coding | deleterious(0) | probably_damaging(0.999) | TCGA-D8-A27G-01 | Breast | breast invasive carcinoma | Female | >=65 | I/II | Unknown | Unknown | SD |
| EPHX2 | insertion | Nonsense_Mutation | novel | c.401_402insAGTCTAAGACATGAGGTCAAGTTCATCCATAGGCGTTGACT | p.Asp134GlufsTer3 | p.D134Efs*3 | P34913 | protein_coding | | | TCGA-A2-A0EX-01 | Breast | breast invasive carcinoma | Female | <65 | I/II | Hormone Therapy | tamoxiphen | SD |
| EPHX2 | insertion | Frame_Shift_Ins | novel | c.563_564insACATTCA | p.Asn189HisfsTer3 | p.N189Hfs*3 | P34913 | protein_coding | | | TCGA-BH-A0B1-01 | Breast | breast invasive carcinoma | Female | >=65 | I/II | Chemotherapy | adriamycin | SD |
| EPHX2 | insertion | In_Frame_Ins | novel | c.565_566insTACCCCAATCTATCCATTCTTCTATTG | p.Asn189delinsIleProGlnSerIleHisSerSerIleAsp | p.N189delinsIPQSIHSSID | P34913 | protein_coding | | | TCGA-BH-A0B1-01 | Breast | breast invasive carcinoma | Female | >=65 | I/II | Chemotherapy | adriamycin | SD |
| EPHX2 | SNV | Missense_Mutation | rs747000602 | c.458N>T | p.Ser153Leu | p.S153L | P34913 | protein_coding | deleterious(0.01) | probably_damaging(1) | TCGA-2W-A8YY-01 | Cervix | cervical & endocervical cancer | Female | <65 | I/II | Chemotherapy | cisplatin | CR |
| EPHX2 | SNV | Missense_Mutation | | c.1347N>G | p.Phe449Leu | p.F449L | P34913 | protein_coding | deleterious(0.02) | benign(0.419) | TCGA-DS-A0VM-01 | Cervix | cervical & endocervical cancer | Female | <65 | I/II | Chemotherapy | cisplatin | PD |
| EPHX2 | SNV | Missense_Mutation | | c.623N>T | p.Thr208Met | p.T208M | P34913 | protein_coding | tolerated(0.19) | benign(0.029) | TCGA-AA-3663-01 | Colorectum | colon adenocarcinoma | Male | <65 | I/II | Unknown | Unknown | SD |
| EPHX2 | SNV | Missense_Mutation | | c.1307N>A | p.Pro436His | p.P436H | P34913 | protein_coding | deleterious(0.02) | probably_damaging(0.984) | TCGA-AA-A01R-01 | Colorectum | colon adenocarcinoma | Male | <65 | III/IV | Chemotherapy | 5-fluorouracil | PD |


