| Tissue | Expression Dynamics | Abbreviation |
| Colorectum (GSE201348) |  | FAP: Familial adenomatous polyposis |
| CRC: Colorectal cancer |
| Colorectum (HTA11) | 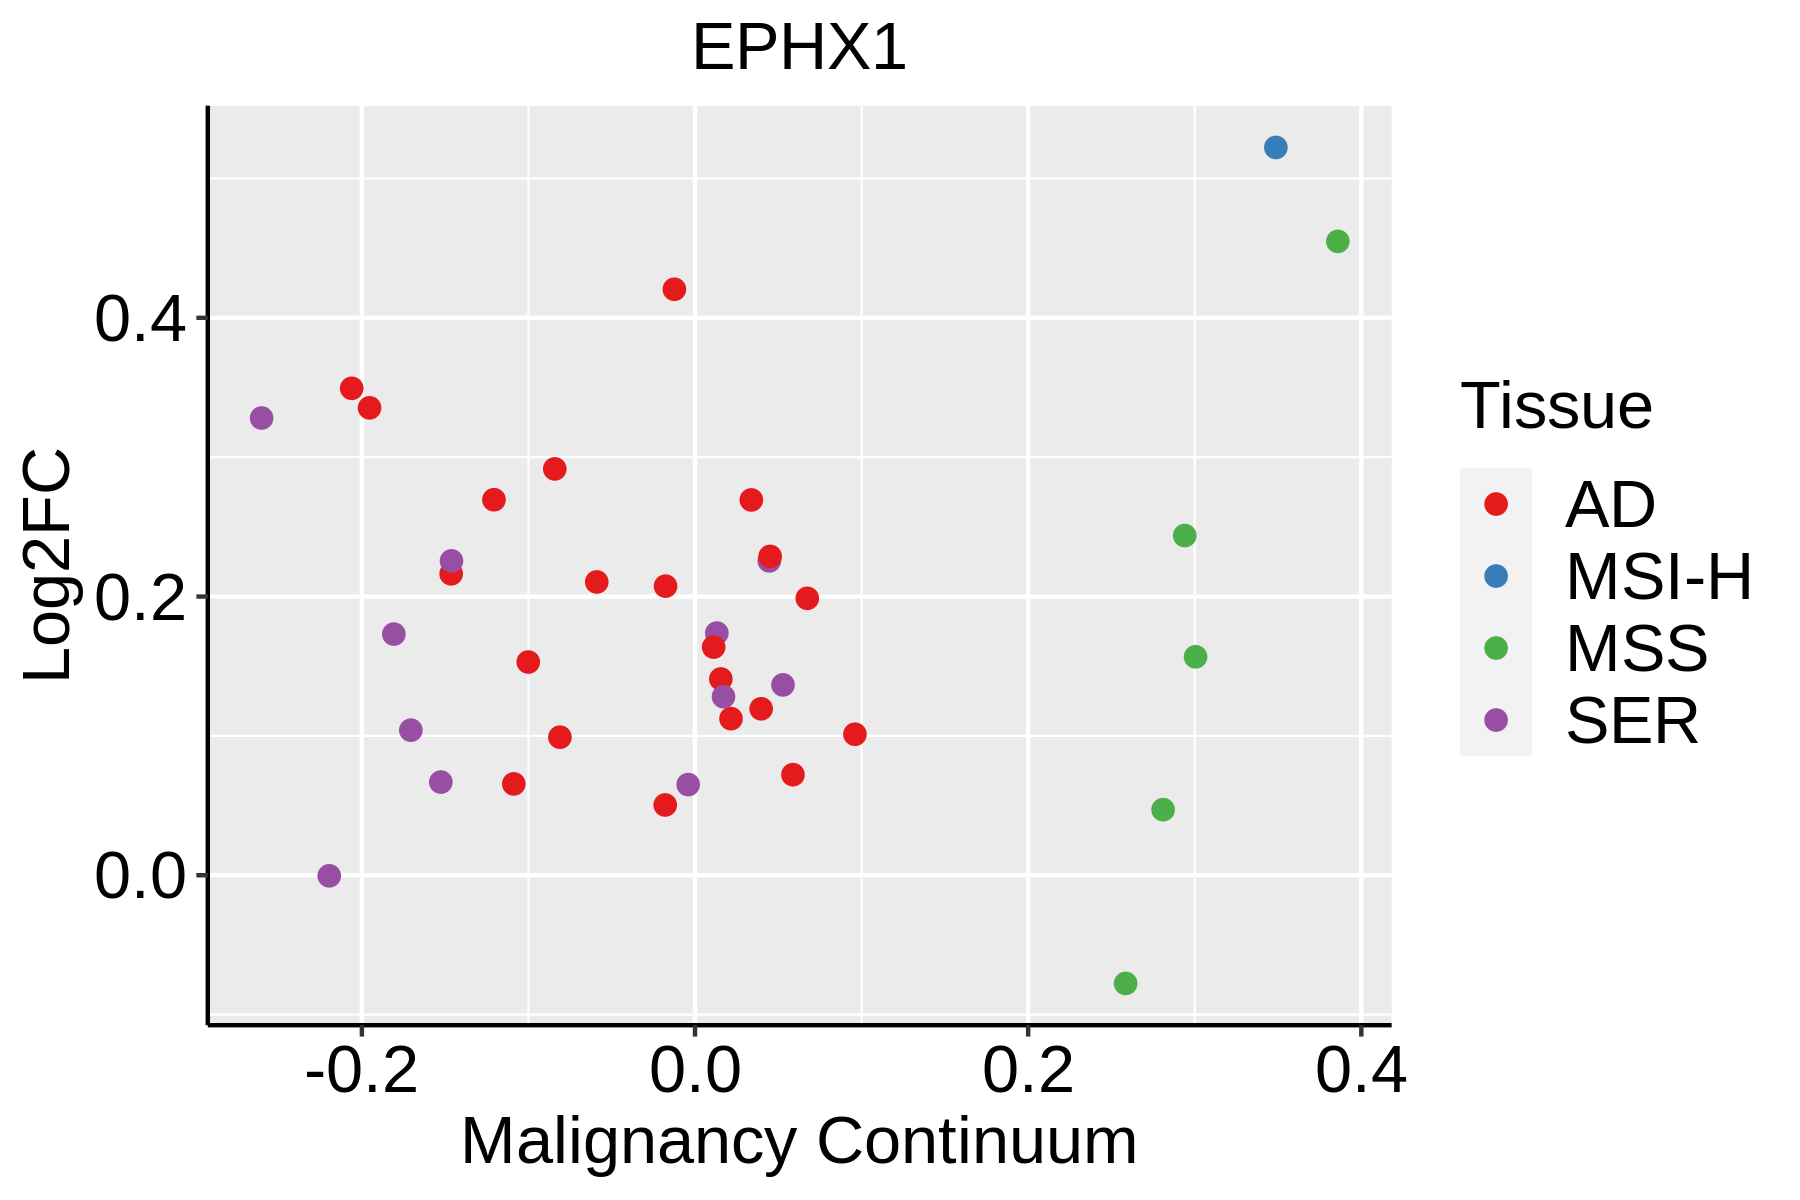 | AD: Adenomas |
| SER: Sessile serrated lesions |
| MSI-H: Microsatellite-high colorectal cancer |
| MSS: Microsatellite stable colorectal cancer |
| Esophagus | 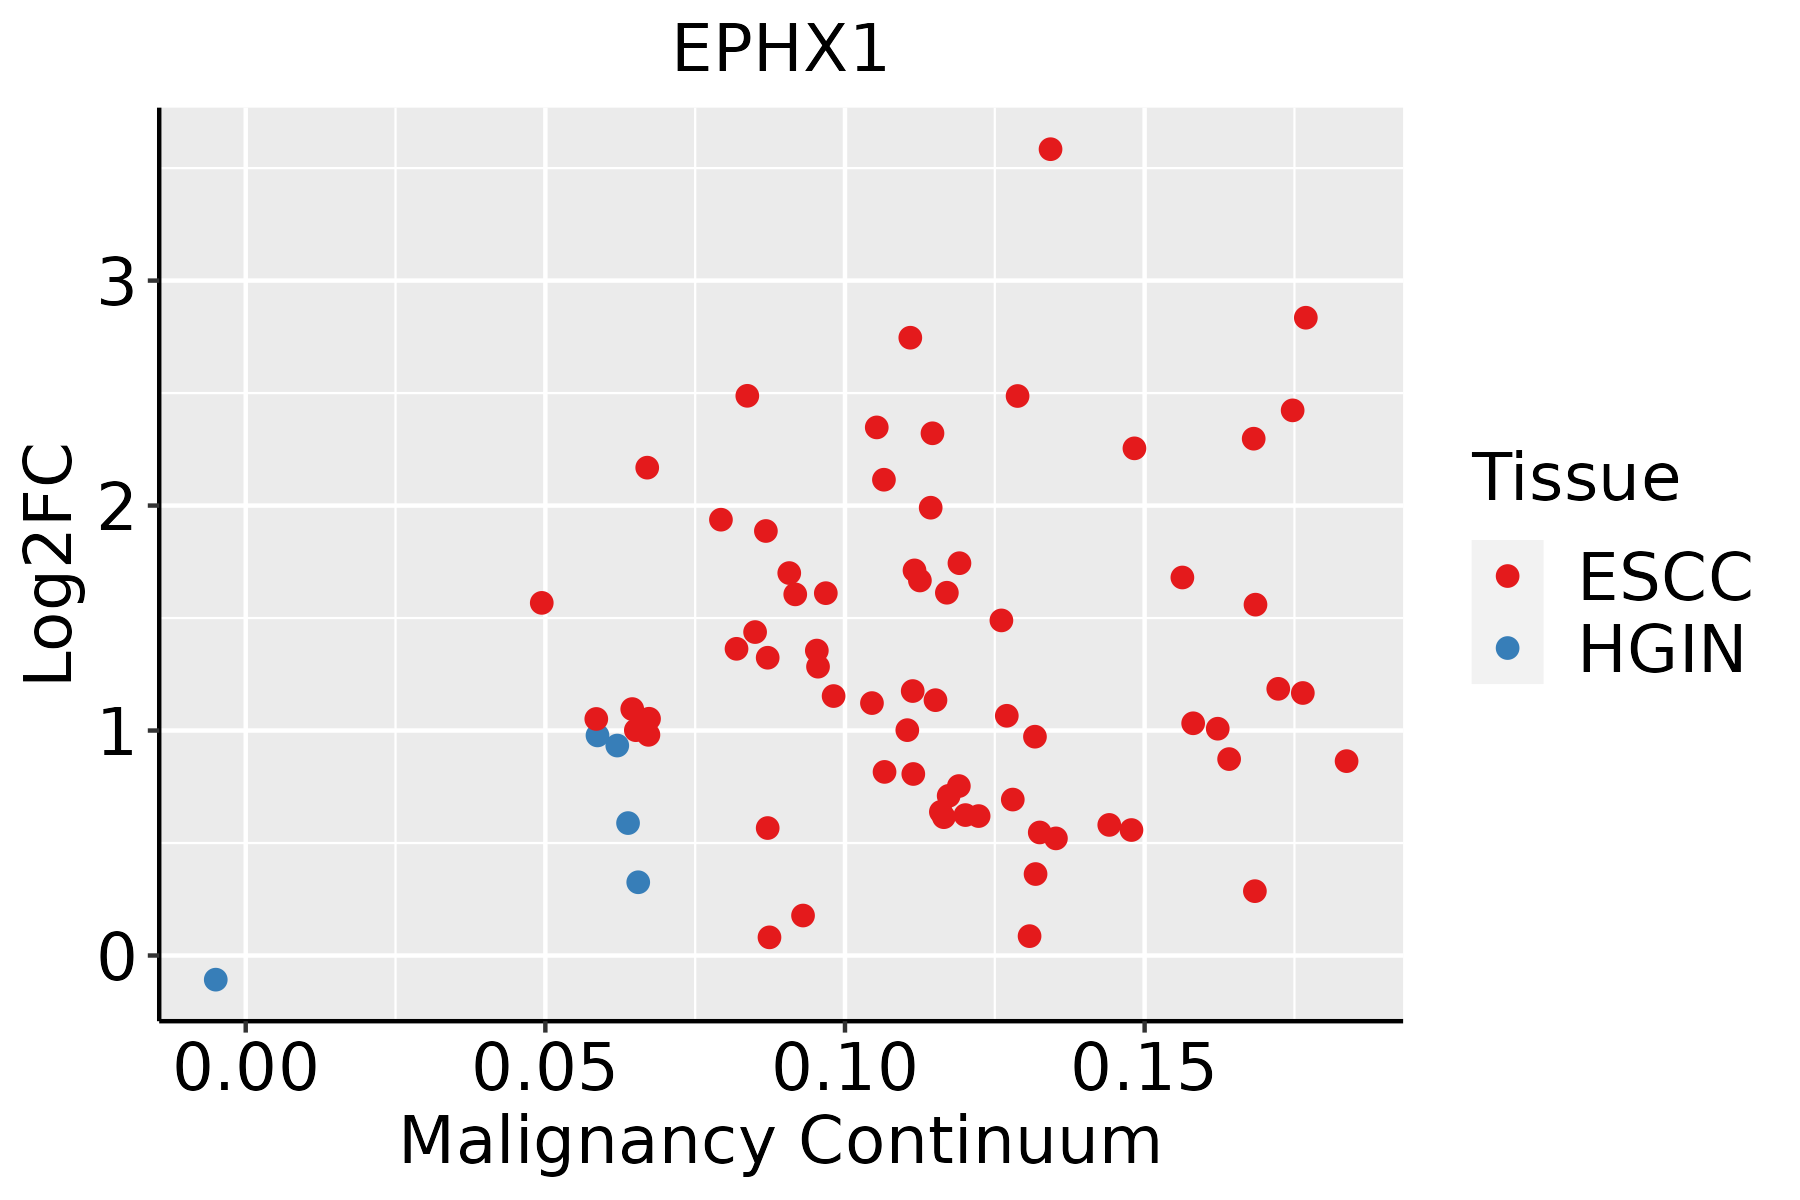 | ESCC: Esophageal squamous cell carcinoma |
| HGIN: High-grade intraepithelial neoplasias |
| LGIN: Low-grade intraepithelial neoplasias |
| Liver | 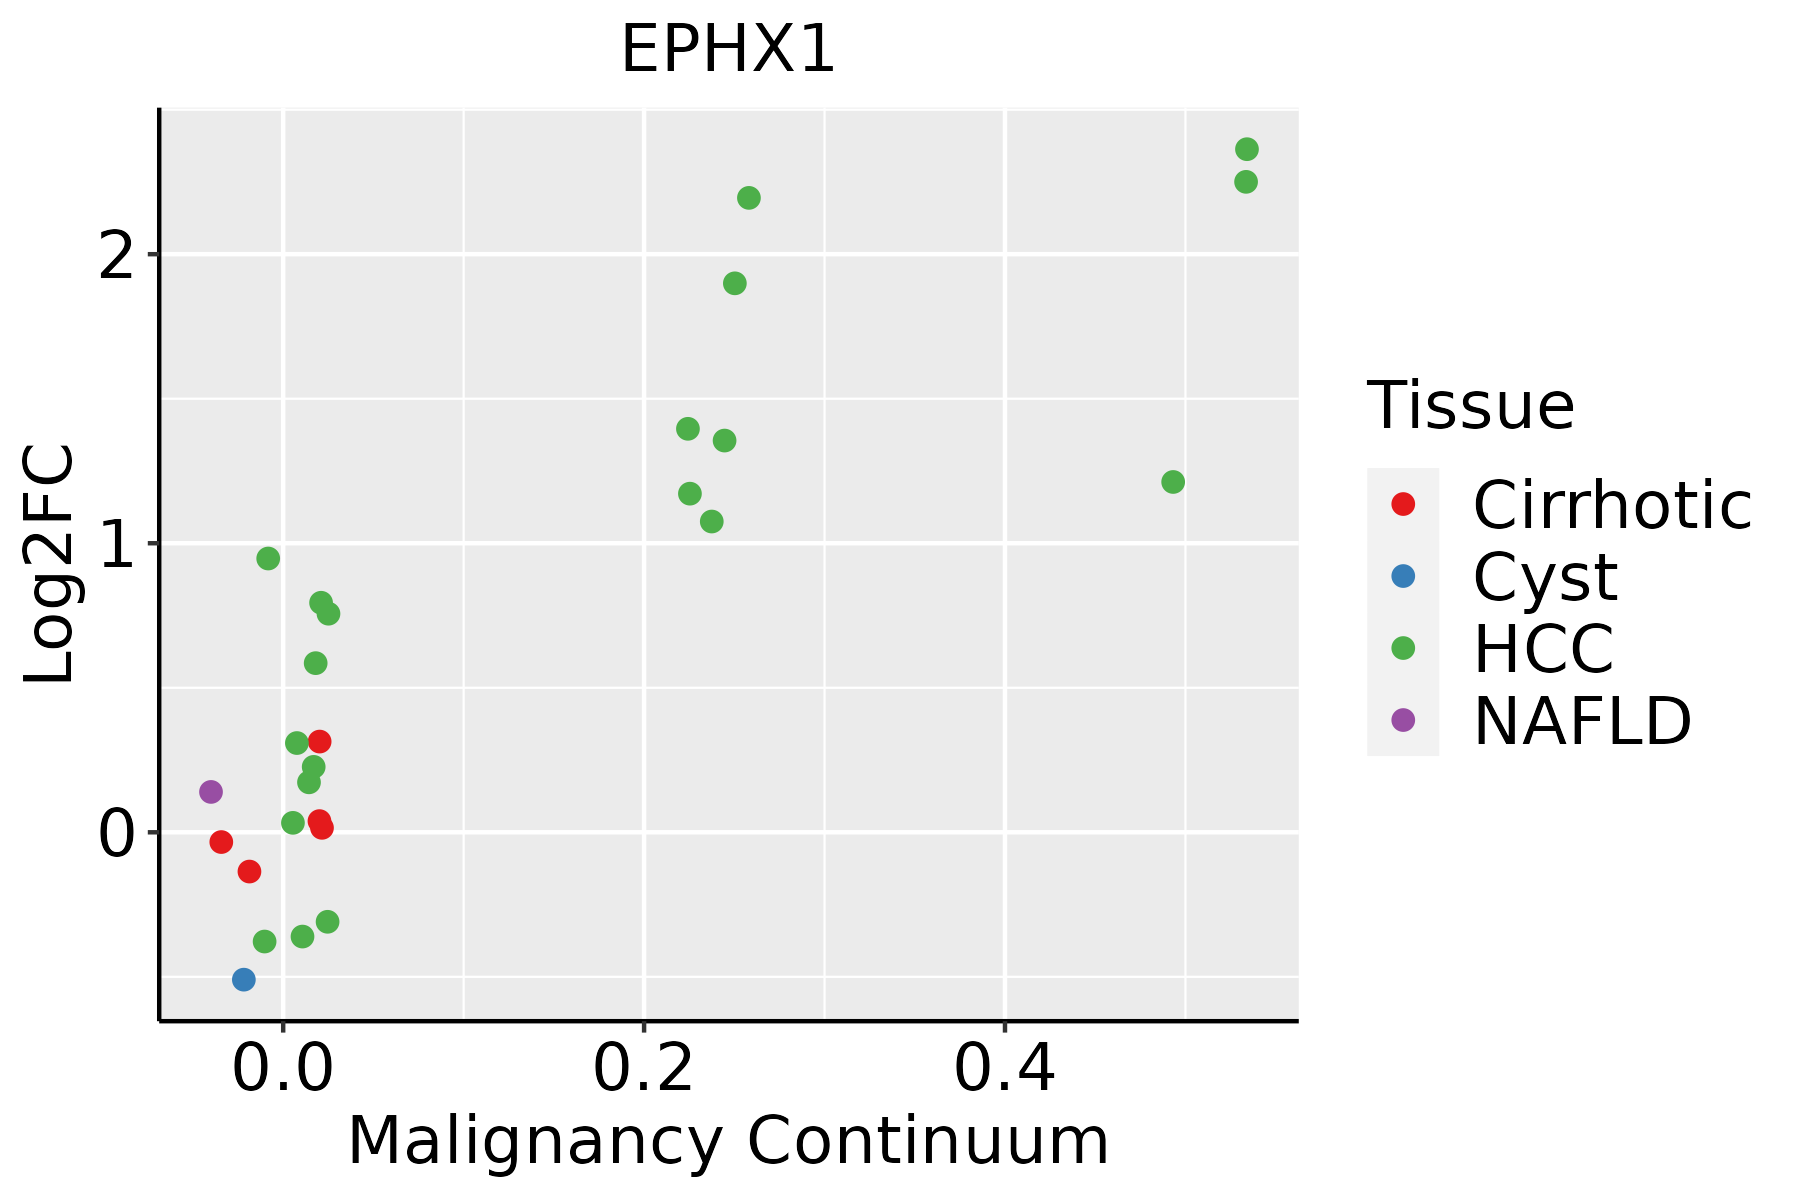 | HCC: Hepatocellular carcinoma |
| NAFLD: Non-alcoholic fatty liver disease |
| Oral Cavity | 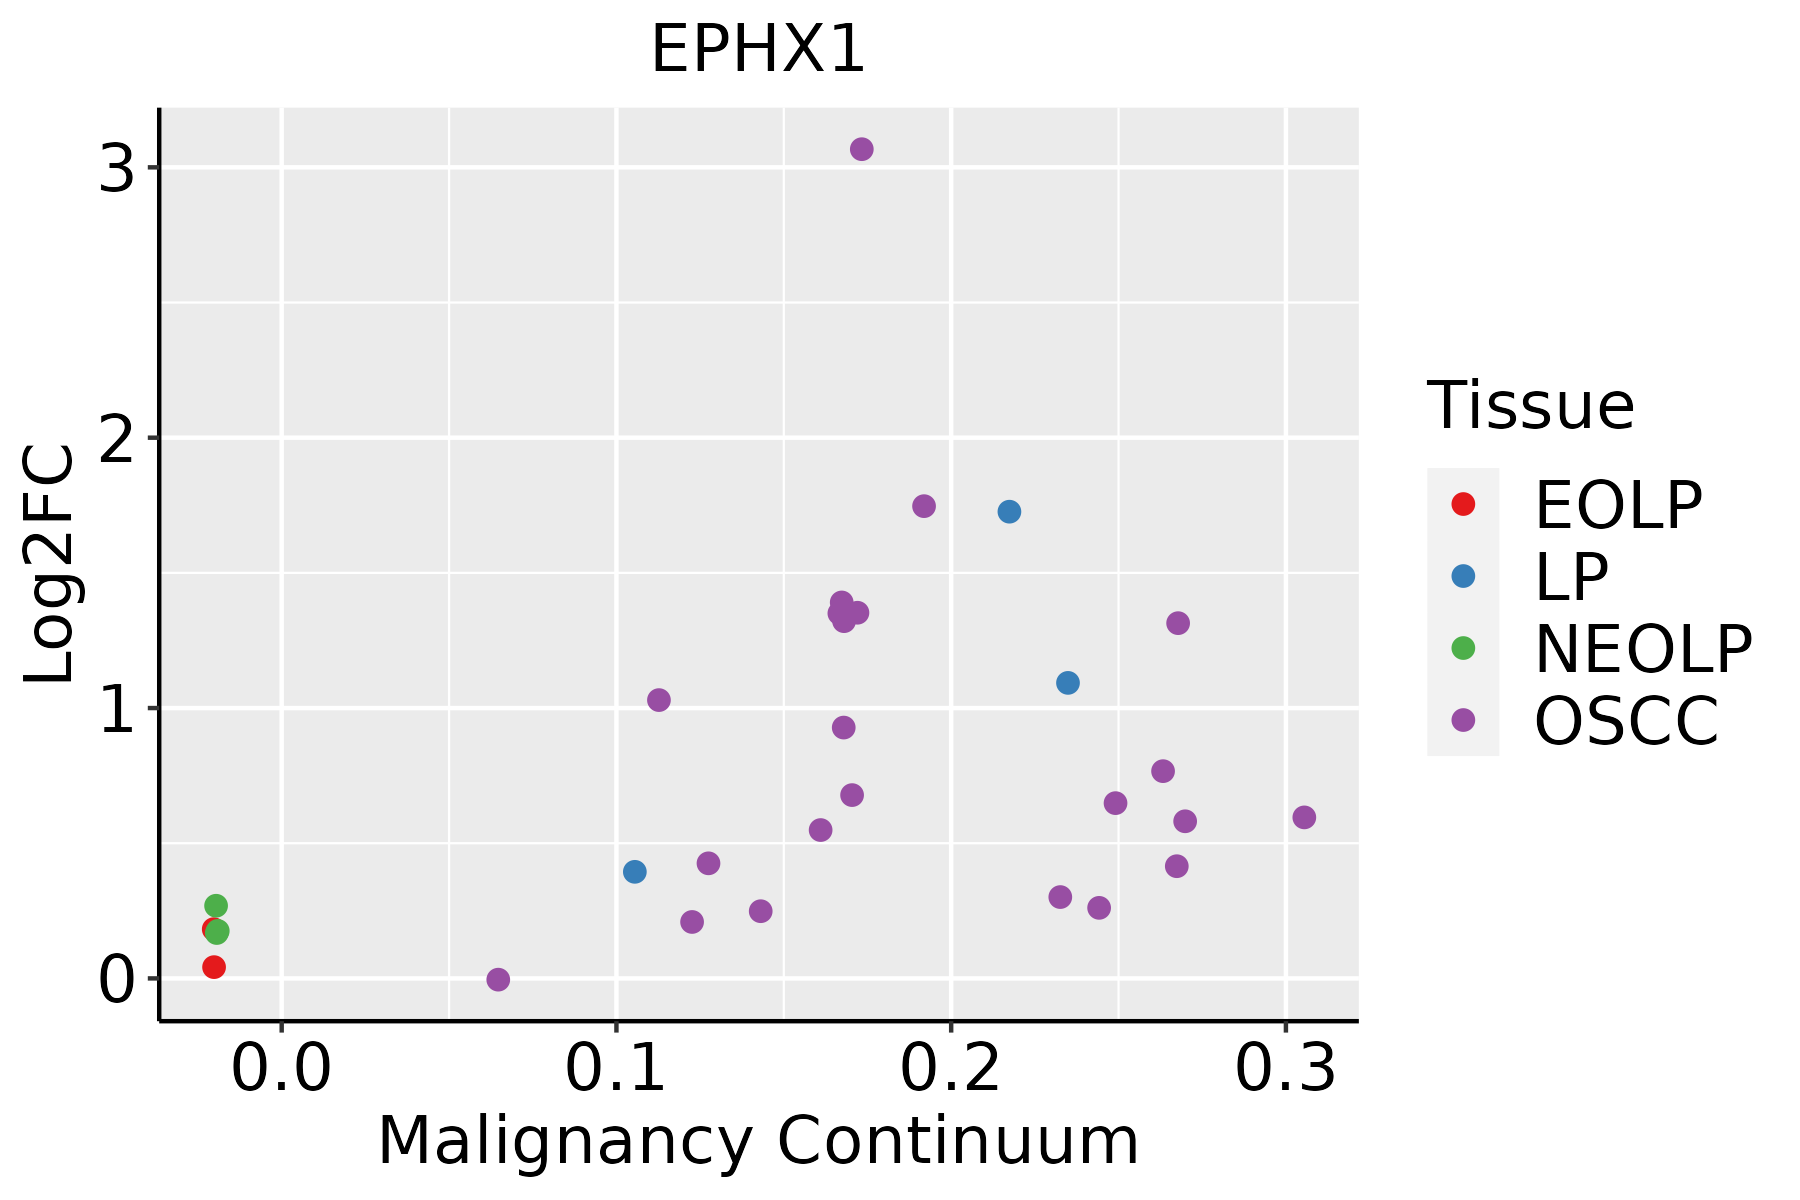 | EOLP: Erosive Oral lichen planus |
| LP: leukoplakia |
| NEOLP: Non-erosive oral lichen planus |
| OSCC: Oral squamous cell carcinoma |
| Thyroid |  | ATC: Anaplastic thyroid cancer |
| HT: Hashimoto's thyroiditis |
| PTC: Papillary thyroid cancer |
| GO ID | Tissue | Disease Stage | Description | Gene Ratio | Bg Ratio | pvalue | p.adjust | Count |
| GO:0019439 | Colorectum | AD | aromatic compound catabolic process | 146/3918 | 467/18723 | 7.48e-08 | 3.84e-06 | 146 |
| GO:0009636 | Colorectum | AD | response to toxic substance | 88/3918 | 262/18723 | 1.12e-06 | 3.72e-05 | 88 |
| GO:0006631 | Colorectum | AD | fatty acid metabolic process | 114/3918 | 390/18723 | 5.58e-05 | 9.44e-04 | 114 |
| GO:0009410 | Colorectum | AD | response to xenobiotic stimulus | 128/3918 | 462/18723 | 2.69e-04 | 3.31e-03 | 128 |
| GO:0018904 | Colorectum | AD | ether metabolic process | 14/3918 | 27/18723 | 3.72e-04 | 4.29e-03 | 14 |
| GO:00194392 | Colorectum | MSS | aromatic compound catabolic process | 140/3467 | 467/18723 | 8.56e-10 | 6.85e-08 | 140 |
| GO:00096362 | Colorectum | MSS | response to toxic substance | 73/3467 | 262/18723 | 1.26e-04 | 1.94e-03 | 73 |
| GO:00066312 | Colorectum | MSS | fatty acid metabolic process | 95/3467 | 390/18723 | 2.20e-03 | 1.84e-02 | 95 |
| GO:00094101 | Colorectum | MSS | response to xenobiotic stimulus | 110/3467 | 462/18723 | 2.36e-03 | 1.92e-02 | 110 |
| GO:00194394 | Colorectum | FAP | aromatic compound catabolic process | 100/2622 | 467/18723 | 6.75e-06 | 2.08e-04 | 100 |
| GO:00066313 | Colorectum | FAP | fatty acid metabolic process | 81/2622 | 390/18723 | 1.43e-04 | 2.24e-03 | 81 |
| GO:00094102 | Colorectum | FAP | response to xenobiotic stimulus | 87/2622 | 462/18723 | 2.15e-03 | 1.77e-02 | 87 |
| GO:00189042 | Colorectum | FAP | ether metabolic process | 10/2622 | 27/18723 | 2.46e-03 | 1.95e-02 | 10 |
| GO:00096363 | Colorectum | FAP | response to toxic substance | 53/2622 | 262/18723 | 3.35e-03 | 2.46e-02 | 53 |
| GO:001943917 | Esophagus | HGIN | aromatic compound catabolic process | 105/2587 | 467/18723 | 1.89e-07 | 9.31e-06 | 105 |
| GO:001943918 | Esophagus | ESCC | aromatic compound catabolic process | 295/8552 | 467/18723 | 1.09e-14 | 5.98e-13 | 295 |
| GO:00066318 | Esophagus | ESCC | fatty acid metabolic process | 217/8552 | 390/18723 | 4.21e-05 | 3.39e-04 | 217 |
| GO:000941020 | Esophagus | ESCC | response to xenobiotic stimulus | 253/8552 | 462/18723 | 4.55e-05 | 3.58e-04 | 253 |
| GO:000963620 | Esophagus | ESCC | response to toxic substance | 150/8552 | 262/18723 | 1.00e-04 | 7.12e-04 | 150 |
| GO:00066316 | Liver | NAFLD | fatty acid metabolic process | 92/1882 | 390/18723 | 3.38e-15 | 3.29e-12 | 92 |
| Pathway ID | Tissue | Disease Stage | Description | Gene Ratio | Bg Ratio | pvalue | p.adjust | qvalue | Count |
| hsa05208 | Colorectum | AD | Chemical carcinogenesis - reactive oxygen species | 126/2092 | 223/8465 | 1.01e-24 | 1.68e-22 | 1.07e-22 | 126 |
| hsa052081 | Colorectum | AD | Chemical carcinogenesis - reactive oxygen species | 126/2092 | 223/8465 | 1.01e-24 | 1.68e-22 | 1.07e-22 | 126 |
| hsa052084 | Colorectum | MSS | Chemical carcinogenesis - reactive oxygen species | 118/1875 | 223/8465 | 2.71e-24 | 4.54e-22 | 2.78e-22 | 118 |
| hsa052085 | Colorectum | MSS | Chemical carcinogenesis - reactive oxygen species | 118/1875 | 223/8465 | 2.71e-24 | 4.54e-22 | 2.78e-22 | 118 |
| hsa052088 | Colorectum | FAP | Chemical carcinogenesis - reactive oxygen species | 78/1404 | 223/8465 | 1.08e-11 | 1.80e-09 | 1.09e-09 | 78 |
| hsa052089 | Colorectum | FAP | Chemical carcinogenesis - reactive oxygen species | 78/1404 | 223/8465 | 1.08e-11 | 1.80e-09 | 1.09e-09 | 78 |
| hsa0520839 | Esophagus | HGIN | Chemical carcinogenesis - reactive oxygen species | 92/1383 | 223/8465 | 2.41e-19 | 9.83e-18 | 7.80e-18 | 92 |
| hsa05208115 | Esophagus | HGIN | Chemical carcinogenesis - reactive oxygen species | 92/1383 | 223/8465 | 2.41e-19 | 9.83e-18 | 7.80e-18 | 92 |
| hsa05208211 | Esophagus | ESCC | Chemical carcinogenesis - reactive oxygen species | 168/4205 | 223/8465 | 1.83e-15 | 6.81e-14 | 3.49e-14 | 168 |
| hsa05208310 | Esophagus | ESCC | Chemical carcinogenesis - reactive oxygen species | 168/4205 | 223/8465 | 1.83e-15 | 6.81e-14 | 3.49e-14 | 168 |
| hsa0520814 | Liver | NAFLD | Chemical carcinogenesis - reactive oxygen species | 44/1043 | 223/8465 | 9.22e-04 | 1.31e-02 | 1.06e-02 | 44 |
| hsa049762 | Liver | NAFLD | Bile secretion | 20/1043 | 89/8465 | 5.08e-03 | 4.43e-02 | 3.57e-02 | 20 |
| hsa0520815 | Liver | NAFLD | Chemical carcinogenesis - reactive oxygen species | 44/1043 | 223/8465 | 9.22e-04 | 1.31e-02 | 1.06e-02 | 44 |
| hsa0497611 | Liver | NAFLD | Bile secretion | 20/1043 | 89/8465 | 5.08e-03 | 4.43e-02 | 3.57e-02 | 20 |
| hsa0520822 | Liver | Cirrhotic | Chemical carcinogenesis - reactive oxygen species | 121/2530 | 223/8465 | 1.35e-14 | 4.08e-13 | 2.52e-13 | 121 |
| hsa0520832 | Liver | Cirrhotic | Chemical carcinogenesis - reactive oxygen species | 121/2530 | 223/8465 | 1.35e-14 | 4.08e-13 | 2.52e-13 | 121 |
| hsa0520842 | Liver | HCC | Chemical carcinogenesis - reactive oxygen species | 167/4020 | 223/8465 | 2.85e-17 | 1.91e-15 | 1.06e-15 | 167 |
| hsa0520852 | Liver | HCC | Chemical carcinogenesis - reactive oxygen species | 167/4020 | 223/8465 | 2.85e-17 | 1.91e-15 | 1.06e-15 | 167 |
| hsa0520862 | Liver | Cyst | Chemical carcinogenesis - reactive oxygen species | 40/339 | 223/8465 | 4.80e-16 | 3.45e-14 | 2.85e-14 | 40 |
| hsa0520872 | Liver | Cyst | Chemical carcinogenesis - reactive oxygen species | 40/339 | 223/8465 | 4.80e-16 | 3.45e-14 | 2.85e-14 | 40 |
| Hugo Symbol | Variant Class | Variant Classification | dbSNP RS | HGVSc | HGVSp | HGVSp Short | SWISSPROT | BIOTYPE | SIFT | PolyPhen | Tumor Sample Barcode | Tissue | Histology | Sex | Age | Stage | Therapy Types | Drugs | Outcome |
| EPHX1 | SNV | Missense_Mutation | rs556212945 | c.1072N>A | p.Val358Ile | p.V358I | P07099 | protein_coding | tolerated(0.42) | benign(0.078) | TCGA-A8-A09Z-01 | Breast | breast invasive carcinoma | Female | >=65 | I/II | Unknown | Unknown | SD |
| EPHX1 | SNV | Missense_Mutation | | c.427C>T | p.Pro143Ser | p.P143S | P07099 | protein_coding | deleterious(0) | probably_damaging(0.998) | TCGA-AO-A0JF-01 | Breast | breast invasive carcinoma | Female | >=65 | I/II | Chemotherapy | doxorubicin | SD |
| EPHX1 | SNV | Missense_Mutation | | c.598N>G | p.Asn200Asp | p.N200D | P07099 | protein_coding | tolerated(0.88) | benign(0.042) | TCGA-AR-A250-01 | Breast | breast invasive carcinoma | Female | <65 | I/II | Chemotherapy | doxorubicin | SD |
| EPHX1 | SNV | Missense_Mutation | novel | c.950N>G | p.Ser317Cys | p.S317C | P07099 | protein_coding | deleterious(0.02) | possibly_damaging(0.651) | TCGA-C8-A8HP-01 | Breast | breast invasive carcinoma | Female | <65 | III/IV | Chemotherapy | 5-fluorouracil | CR |
| EPHX1 | insertion | In_Frame_Ins | novel | c.958_959insTTTTAAGCAACTTCTCTACCCTGACCCTCCTCCTGGGACAGC | p.Gly320delinsValLeuSerAsnPheSerThrLeuThrLeuLeuLeuGlyGlnArg | p.G320delinsVLSNFSTLTLLLGQR | P07099 | protein_coding | | | TCGA-A2-A04T-01 | Breast | breast invasive carcinoma | Female | <65 | I/II | Chemotherapy | cyclophosphamide | SD |
| EPHX1 | deletion | Frame_Shift_Del | novel | c.684delG | p.Ser229ProfsTer2 | p.S229Pfs*2 | P07099 | protein_coding | | | TCGA-D8-A27V-01 | Breast | breast invasive carcinoma | Female | <65 | I/II | Hormone Therapy | tamoxiphen | SD |
| EPHX1 | deletion | Frame_Shift_Del | novel | c.794delG | p.Gly265AspfsTer29 | p.G265Dfs*29 | P07099 | protein_coding | | | TCGA-D8-A27V-01 | Breast | breast invasive carcinoma | Female | <65 | I/II | Hormone Therapy | tamoxiphen | SD |
| EPHX1 | SNV | Missense_Mutation | | c.146G>A | p.Arg49His | p.R49H | P07099 | protein_coding | tolerated(0.1) | benign(0.036) | TCGA-2W-A8YY-01 | Cervix | cervical & endocervical cancer | Female | <65 | I/II | Chemotherapy | cisplatin | CR |
| EPHX1 | SNV | Missense_Mutation | rs371279887 | c.800N>A | p.Arg267His | p.R267H | P07099 | protein_coding | tolerated(0.27) | benign(0.003) | TCGA-5M-AAT6-01 | Colorectum | colon adenocarcinoma | Female | <65 | III/IV | Unknown | Unknown | PD |
| EPHX1 | SNV | Missense_Mutation | | c.335N>T | p.Arg112Ile | p.R112I | P07099 | protein_coding | deleterious(0) | benign(0.026) | TCGA-A6-3809-01 | Colorectum | colon adenocarcinoma | Female | >=65 | I/II | Unknown | Unknown | SD |


