
|
|||||
|
 | |
| |
| |
| |
| |
| |
|
Gene: EPHB6 |
Gene summary for EPHB6 |
| Gene information | Species | Human | Gene symbol | EPHB6 | Gene ID | 2051 |
| Gene name | EPH receptor B6 | |
| Gene Alias | HEP | |
| Cytomap | 7q34 | |
| Gene Type | protein-coding | GO ID | GO:0000902 | UniProtAcc | J3KQU5 |
Top |
Malignant transformation analysis |
| Identification of the aberrant gene expression in precancerous and cancerous lesions by comparing the gene expression of stem-like cells in diseased tissues with normal stem cells |
| Entrez ID | Symbol | Replicates | Species | Organ | Tissue | Adj P-value | Log2FC | Malignancy |
| 2051 | EPHB6 | LZE4T | Human | Esophagus | ESCC | 7.17e-04 | 1.22e-01 | 0.0811 |
| 2051 | EPHB6 | LZE8T | Human | Esophagus | ESCC | 2.30e-03 | 6.37e-02 | 0.067 |
| 2051 | EPHB6 | LZE21D1 | Human | Esophagus | HGIN | 2.03e-03 | 3.14e-01 | 0.0632 |
| 2051 | EPHB6 | LZE22D1 | Human | Esophagus | HGIN | 8.23e-03 | 8.20e-02 | 0.0595 |
| 2051 | EPHB6 | LZE24T | Human | Esophagus | ESCC | 3.29e-10 | 1.45e-01 | 0.0596 |
| 2051 | EPHB6 | LZE6T | Human | Esophagus | ESCC | 5.08e-03 | 5.85e-02 | 0.0845 |
| 2051 | EPHB6 | P1T-E | Human | Esophagus | ESCC | 8.17e-05 | 1.04e-01 | 0.0875 |
| 2051 | EPHB6 | P2T-E | Human | Esophagus | ESCC | 4.94e-31 | 6.57e-01 | 0.1177 |
| 2051 | EPHB6 | P4T-E | Human | Esophagus | ESCC | 2.47e-10 | 2.89e-01 | 0.1323 |
| 2051 | EPHB6 | P8T-E | Human | Esophagus | ESCC | 4.14e-07 | 1.64e-01 | 0.0889 |
| 2051 | EPHB6 | P9T-E | Human | Esophagus | ESCC | 5.48e-06 | 6.34e-03 | 0.1131 |
| 2051 | EPHB6 | P10T-E | Human | Esophagus | ESCC | 2.02e-23 | 5.18e-01 | 0.116 |
| 2051 | EPHB6 | P15T-E | Human | Esophagus | ESCC | 3.24e-28 | 8.06e-01 | 0.1149 |
| 2051 | EPHB6 | P16T-E | Human | Esophagus | ESCC | 4.31e-09 | 1.22e-01 | 0.1153 |
| 2051 | EPHB6 | P20T-E | Human | Esophagus | ESCC | 2.18e-08 | 1.09e-01 | 0.1124 |
| 2051 | EPHB6 | P21T-E | Human | Esophagus | ESCC | 1.07e-07 | 2.10e-01 | 0.1617 |
| 2051 | EPHB6 | P22T-E | Human | Esophagus | ESCC | 2.40e-14 | 1.09e-01 | 0.1236 |
| 2051 | EPHB6 | P24T-E | Human | Esophagus | ESCC | 6.97e-06 | -9.25e-03 | 0.1287 |
| 2051 | EPHB6 | P26T-E | Human | Esophagus | ESCC | 4.28e-14 | 3.60e-01 | 0.1276 |
| 2051 | EPHB6 | P27T-E | Human | Esophagus | ESCC | 1.19e-25 | 4.44e-01 | 0.1055 |
| Page: 1 2 3 4 |
| Tissue | Expression Dynamics | Abbreviation |
| Esophagus |  | ESCC: Esophageal squamous cell carcinoma |
| HGIN: High-grade intraepithelial neoplasias | ||
| LGIN: Low-grade intraepithelial neoplasias | ||
| Skin | 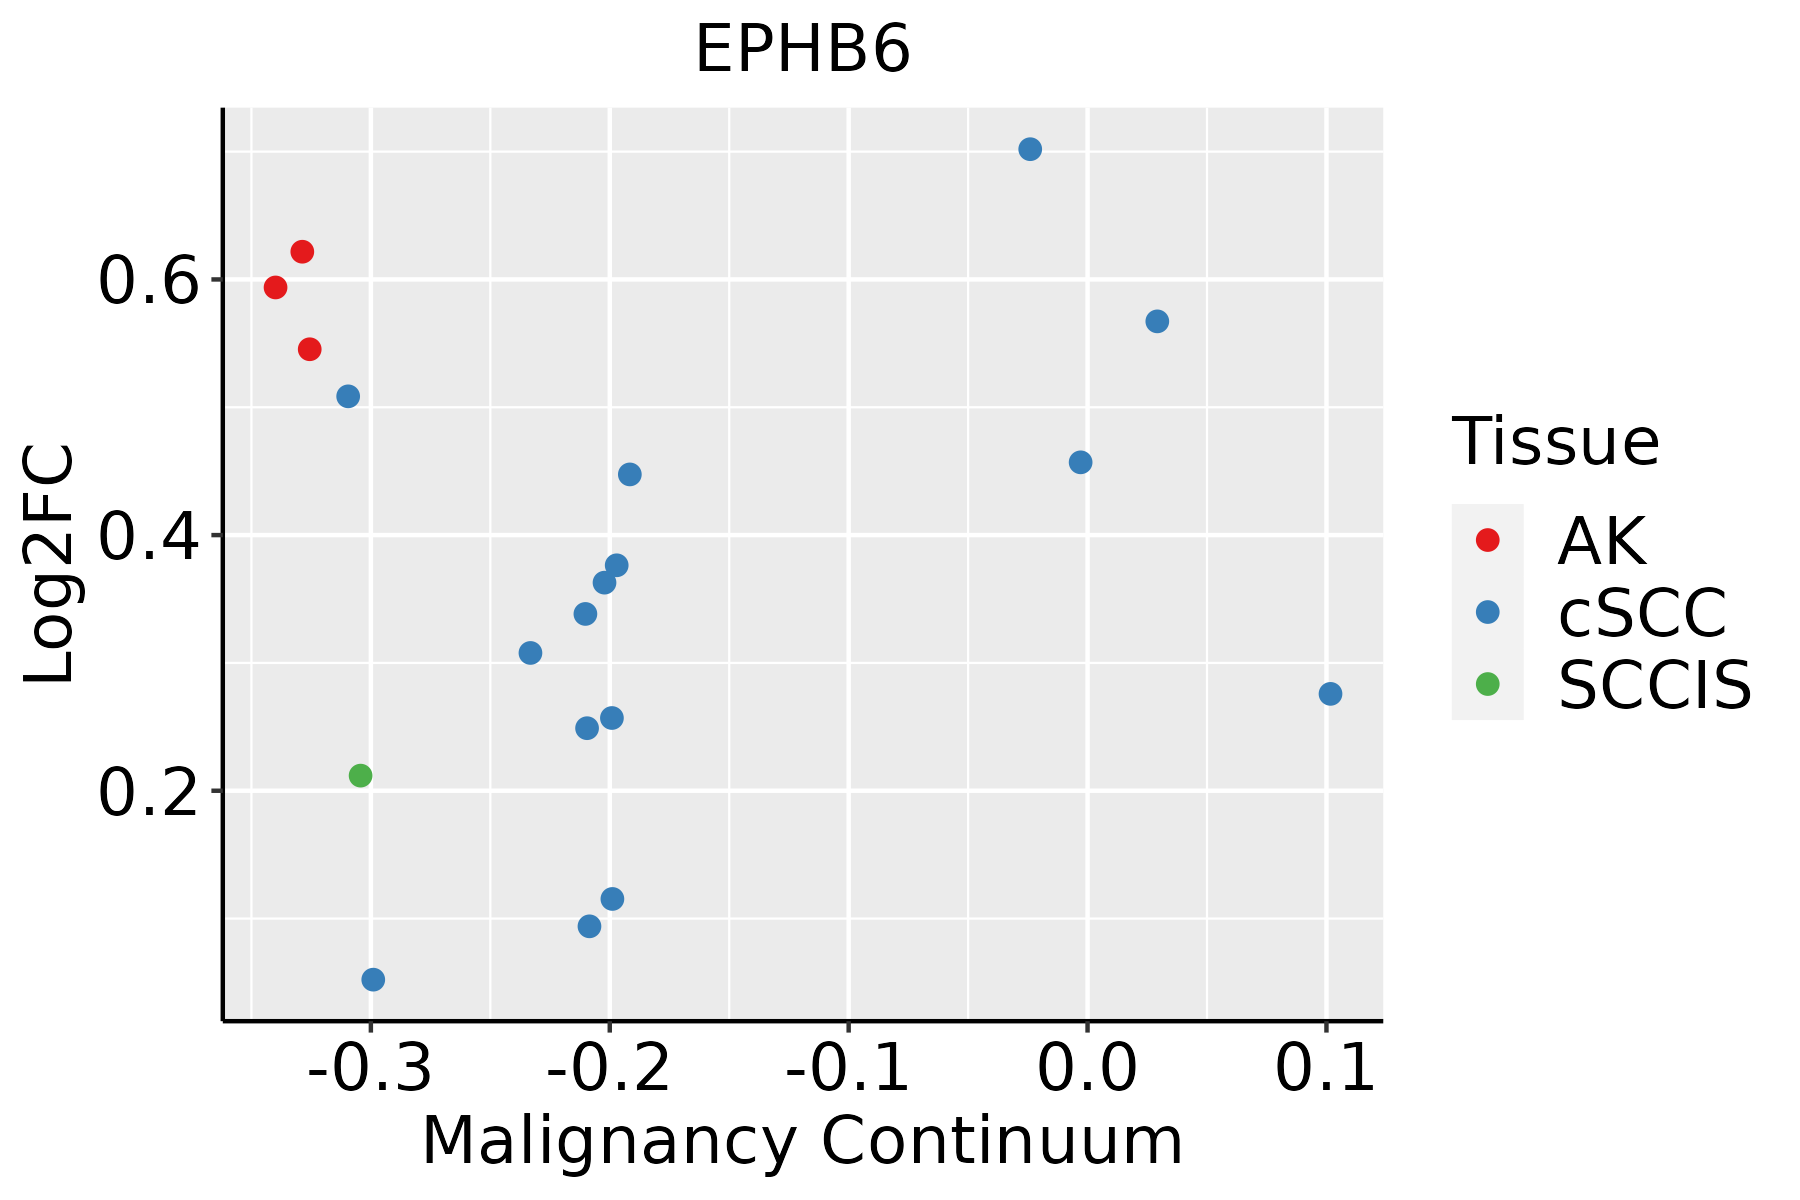 | AK: Actinic keratosis |
| cSCC: Cutaneous squamous cell carcinoma | ||
| SCCIS:squamous cell carcinoma in situ | ||
| Thyroid |  | ATC: Anaplastic thyroid cancer |
| HT: Hashimoto's thyroiditis | ||
| PTC: Papillary thyroid cancer |
| ∗log2FC in expression of this searched gene in stem-like cells from each diseased tissue sample relative to stem-like cells in normal samples in each tissue plotted against the malignancy continuum. Samples are colored based on if they are from different disease stage. |
Top |
Malignant transformation related pathway analysis |
| Find out the enriched GO biological processes and KEGG pathways involved in transition from healthy to precancer to cancer |
| Tissue | Disease Stage | Enriched GO biological Processes |
| Colorectum | AD |  |
| Colorectum | SER |  |
| Colorectum | MSS |  |
| Colorectum | MSI-H |  |
| Colorectum | FAP |  |
| ∗Top 15 enriched GO BP terms are showed in the bar plot of each disease state in each tissue. Each row represents a significant GO biological process which is colored according to the -log10(p.adjust). |
| Page: 1 2 3 4 5 6 7 8 9 |
| GO ID | Tissue | Disease Stage | Description | Gene Ratio | Bg Ratio | pvalue | p.adjust | Count |
| GO:003367420 | Esophagus | ESCC | positive regulation of kinase activity | 260/8552 | 467/18723 | 7.26e-06 | 7.22e-05 | 260 |
| GO:006156415 | Esophagus | ESCC | axon development | 251/8552 | 467/18723 | 2.41e-04 | 1.49e-03 | 251 |
| GO:00182124 | Esophagus | ESCC | peptidyl-tyrosine modification | 202/8552 | 378/18723 | 1.34e-03 | 6.39e-03 | 202 |
| GO:00181084 | Esophagus | ESCC | peptidyl-tyrosine phosphorylation | 200/8552 | 375/18723 | 1.60e-03 | 7.45e-03 | 200 |
| GO:000740915 | Esophagus | ESCC | axonogenesis | 219/8552 | 418/18723 | 3.14e-03 | 1.31e-02 | 219 |
| GO:00480133 | Esophagus | ESCC | ephrin receptor signaling pathway | 33/8552 | 51/18723 | 4.77e-03 | 1.85e-02 | 33 |
| GO:006156416 | Skin | AK | axon development | 91/1910 | 467/18723 | 8.60e-10 | 8.63e-08 | 91 |
| GO:000740916 | Skin | AK | axonogenesis | 80/1910 | 418/18723 | 2.07e-08 | 1.19e-06 | 80 |
| GO:00074112 | Skin | AK | axon guidance | 42/1910 | 227/18723 | 1.01e-04 | 1.33e-03 | 42 |
| GO:00974852 | Skin | AK | neuron projection guidance | 42/1910 | 228/18723 | 1.11e-04 | 1.43e-03 | 42 |
| GO:003367424 | Skin | AK | positive regulation of kinase activity | 73/1910 | 467/18723 | 1.42e-04 | 1.71e-03 | 73 |
| GO:00480134 | Skin | AK | ephrin receptor signaling pathway | 14/1910 | 51/18723 | 4.29e-04 | 4.05e-03 | 14 |
| GO:00219555 | Skin | AK | central nervous system neuron axonogenesis | 10/1910 | 35/18723 | 2.00e-03 | 1.35e-02 | 10 |
| GO:00219543 | Skin | AK | central nervous system neuron development | 16/1910 | 81/18723 | 7.13e-03 | 3.64e-02 | 16 |
| GO:004801321 | Skin | cSCC | ephrin receptor signaling pathway | 23/4864 | 51/18723 | 2.41e-03 | 1.38e-02 | 23 |
| GO:003367425 | Skin | cSCC | positive regulation of kinase activity | 148/4864 | 467/18723 | 3.00e-03 | 1.66e-02 | 148 |
| GO:006156422 | Skin | cSCC | axon development | 146/4864 | 467/18723 | 5.50e-03 | 2.73e-02 | 146 |
| GO:0033674111 | Thyroid | PTC | positive regulation of kinase activity | 201/5968 | 467/18723 | 1.95e-07 | 3.54e-06 | 201 |
| GO:006156419 | Thyroid | PTC | axon development | 199/5968 | 467/18723 | 5.27e-07 | 8.53e-06 | 199 |
| GO:000740918 | Thyroid | PTC | axonogenesis | 178/5968 | 418/18723 | 2.17e-06 | 2.91e-05 | 178 |
| Page: 1 2 |
| Pathway ID | Tissue | Disease Stage | Description | Gene Ratio | Bg Ratio | pvalue | p.adjust | qvalue | Count |
| hsa0436016 | Esophagus | ESCC | Axon guidance | 108/4205 | 182/8465 | 5.13e-03 | 1.30e-02 | 6.67e-03 | 108 |
| hsa0436017 | Esophagus | ESCC | Axon guidance | 108/4205 | 182/8465 | 5.13e-03 | 1.30e-02 | 6.67e-03 | 108 |
| Page: 1 |
Top |
Cell-cell communication analysis |
| Identification of potential cell-cell interactions between two cell types and their ligand-receptor pairs for different disease states |
| Ligand | Receptor | LRpair | Pathway | Tissue | Disease Stage |
| EFNB3 | EPHB6 | EFNB3_EPHB6 | EPHB | Esophagus | ESCC |
| Page: 1 |
Top |
Single-cell gene regulatory network inference analysis |
| Find out the significant the regulons (TFs) and the target genes of each regulon across cell types for different disease states |
| TF | Cell Type | Tissue | Disease Stage | Target Gene | RSS | Regulon Activity |
| ∗The dot plots of a searched regulon are shown for all cell subpopulations in each disease state of each tissue based on the regulon specific score inferred using pySCENIC and by calculating the average expression. |
| Page: 1 |
Top |
Somatic mutation of malignant transformation related genes |
| Annotation of somatic variants for genes involved in malignant transformation |
| Hugo Symbol | Variant Class | Variant Classification | dbSNP RS | HGVSc | HGVSp | HGVSp Short | SWISSPROT | BIOTYPE | SIFT | PolyPhen | Tumor Sample Barcode | Tissue | Histology | Sex | Age | Stage | Therapy Types | Drugs | Outcome |
| EPHB6 | SNV | Missense_Mutation | novel | c.1591G>C | p.Glu531Gln | p.E531Q | protein_coding | tolerated(1) | benign(0.026) | TCGA-A2-A0YK-01 | Breast | breast invasive carcinoma | Female | <65 | I/II | Chemotherapy | cytoxan | SD | |
| EPHB6 | SNV | Missense_Mutation | novel | c.607N>T | p.Gly203Trp | p.G203W | protein_coding | deleterious(0) | probably_damaging(1) | TCGA-A8-A07L-01 | Breast | breast invasive carcinoma | Female | <65 | III/IV | Chemotherapy | CR | ||
| EPHB6 | SNV | Missense_Mutation | novel | c.2263N>T | p.Gly755Cys | p.G755C | protein_coding | deleterious(0.04) | probably_damaging(1) | TCGA-A8-A08H-01 | Breast | breast invasive carcinoma | Female | >=65 | I/II | Unknown | Unknown | SD | |
| EPHB6 | SNV | Missense_Mutation | rs370835347 | c.430G>A | p.Val144Ile | p.V144I | protein_coding | tolerated(0.29) | benign(0) | TCGA-A8-A09Z-01 | Breast | breast invasive carcinoma | Female | >=65 | I/II | Unknown | Unknown | SD | |
| EPHB6 | SNV | Missense_Mutation | rs867659854 | c.1942G>A | p.Asp648Asn | p.D648N | protein_coding | deleterious(0) | probably_damaging(0.927) | TCGA-BH-A0BJ-01 | Breast | breast invasive carcinoma | Female | <65 | I/II | Chemotherapy | doxorubicin | SD | |
| EPHB6 | SNV | Missense_Mutation | novel | c.2464N>G | p.Pro822Ala | p.P822A | protein_coding | tolerated(0.18) | benign(0.054) | TCGA-D8-A1XQ-01 | Breast | breast invasive carcinoma | Female | >=65 | I/II | Unknown | Unknown | SD | |
| EPHB6 | SNV | Missense_Mutation | rs150099415 | c.2626G>C | p.Glu876Gln | p.E876Q | protein_coding | deleterious(0.03) | benign(0.011) | TCGA-LQ-A4E4-01 | Breast | breast invasive carcinoma | Female | >=65 | III/IV | Hormone Therapy | anastrozole | PD | |
| EPHB6 | SNV | Missense_Mutation | rs752538203 | c.1232G>A | p.Cys411Tyr | p.C411Y | protein_coding | deleterious(0) | probably_damaging(0.999) | TCGA-2W-A8YY-01 | Cervix | cervical & endocervical cancer | Female | <65 | I/II | Chemotherapy | cisplatin | CR | |
| EPHB6 | SNV | Missense_Mutation | novel | c.1126N>C | p.Glu376Gln | p.E376Q | protein_coding | tolerated(0.08) | possibly_damaging(0.898) | TCGA-C5-A1BM-01 | Cervix | cervical & endocervical cancer | Female | >=65 | I/II | Unknown | Unknown | SD | |
| EPHB6 | SNV | Missense_Mutation | novel | c.1201G>A | p.Asp401Asn | p.D401N | protein_coding | deleterious(0) | probably_damaging(0.999) | TCGA-DR-A0ZM-01 | Cervix | cervical & endocervical cancer | Female | <65 | III/IV | Unspecific | Cisplatin | SD |
| Page: 1 2 3 4 5 6 7 8 9 10 11 12 13 14 15 16 |
Top |
Related drugs of malignant transformation related genes |
| Identification of chemicals and drugs interact with genes involved in malignant transfromation |
| (DGIdb 4.0) |
| Entrez ID | Symbol | Category | Interaction Types | Drug Claim Name | Drug Name | PMIDs |
| 2051 | EPHB6 | DRUGGABLE GENOME, KINASE, TYROSINE KINASE | inhibitor | CHEMBL24828 | VANDETANIB |
| Page: 1 |

Copyright 2023-Present -The University of Texas Health Science Center at Houston |