
|
|||||
|
 | |
| |
| |
| |
| |
| |
|
Gene: EPHB4 |
Gene summary for EPHB4 |
| Gene information | Species | Human | Gene symbol | EPHB4 | Gene ID | 2050 |
| Gene name | EPH receptor B4 | |
| Gene Alias | CMAVM2 | |
| Cytomap | 7q22.1 | |
| Gene Type | protein-coding | GO ID | GO:0000902 | UniProtAcc | P54760 |
Top |
Malignant transformation analysis |
| Identification of the aberrant gene expression in precancerous and cancerous lesions by comparing the gene expression of stem-like cells in diseased tissues with normal stem cells |
| Entrez ID | Symbol | Replicates | Species | Organ | Tissue | Adj P-value | Log2FC | Malignancy |
| 2050 | EPHB4 | LZE8T | Human | Esophagus | ESCC | 3.01e-02 | 2.76e-02 | 0.067 |
| 2050 | EPHB4 | LZE22T | Human | Esophagus | ESCC | 1.10e-02 | 2.10e-01 | 0.068 |
| 2050 | EPHB4 | LZE24T | Human | Esophagus | ESCC | 4.97e-09 | 1.62e-01 | 0.0596 |
| 2050 | EPHB4 | LZE21T | Human | Esophagus | ESCC | 4.84e-02 | 2.07e-01 | 0.0655 |
| 2050 | EPHB4 | P1T-E | Human | Esophagus | ESCC | 1.26e-05 | 4.09e-01 | 0.0875 |
| 2050 | EPHB4 | P2T-E | Human | Esophagus | ESCC | 2.01e-88 | 1.53e+00 | 0.1177 |
| 2050 | EPHB4 | P4T-E | Human | Esophagus | ESCC | 4.15e-12 | 2.52e-01 | 0.1323 |
| 2050 | EPHB4 | P5T-E | Human | Esophagus | ESCC | 3.76e-05 | 1.99e-02 | 0.1327 |
| 2050 | EPHB4 | P8T-E | Human | Esophagus | ESCC | 1.56e-09 | 2.35e-01 | 0.0889 |
| 2050 | EPHB4 | P9T-E | Human | Esophagus | ESCC | 4.54e-02 | 5.15e-02 | 0.1131 |
| 2050 | EPHB4 | P10T-E | Human | Esophagus | ESCC | 7.05e-24 | 4.57e-01 | 0.116 |
| 2050 | EPHB4 | P11T-E | Human | Esophagus | ESCC | 2.38e-07 | 2.52e-01 | 0.1426 |
| 2050 | EPHB4 | P12T-E | Human | Esophagus | ESCC | 1.09e-17 | 3.97e-01 | 0.1122 |
| 2050 | EPHB4 | P15T-E | Human | Esophagus | ESCC | 2.33e-18 | 5.51e-01 | 0.1149 |
| 2050 | EPHB4 | P16T-E | Human | Esophagus | ESCC | 7.95e-37 | 7.12e-01 | 0.1153 |
| 2050 | EPHB4 | P17T-E | Human | Esophagus | ESCC | 2.14e-12 | 4.64e-01 | 0.1278 |
| 2050 | EPHB4 | P19T-E | Human | Esophagus | ESCC | 3.49e-02 | 2.75e-01 | 0.1662 |
| 2050 | EPHB4 | P20T-E | Human | Esophagus | ESCC | 7.19e-16 | 3.52e-01 | 0.1124 |
| 2050 | EPHB4 | P21T-E | Human | Esophagus | ESCC | 5.28e-27 | 5.96e-01 | 0.1617 |
| 2050 | EPHB4 | P22T-E | Human | Esophagus | ESCC | 1.46e-18 | 1.51e-01 | 0.1236 |
| Page: 1 2 3 4 5 |
| Tissue | Expression Dynamics | Abbreviation |
| Esophagus | 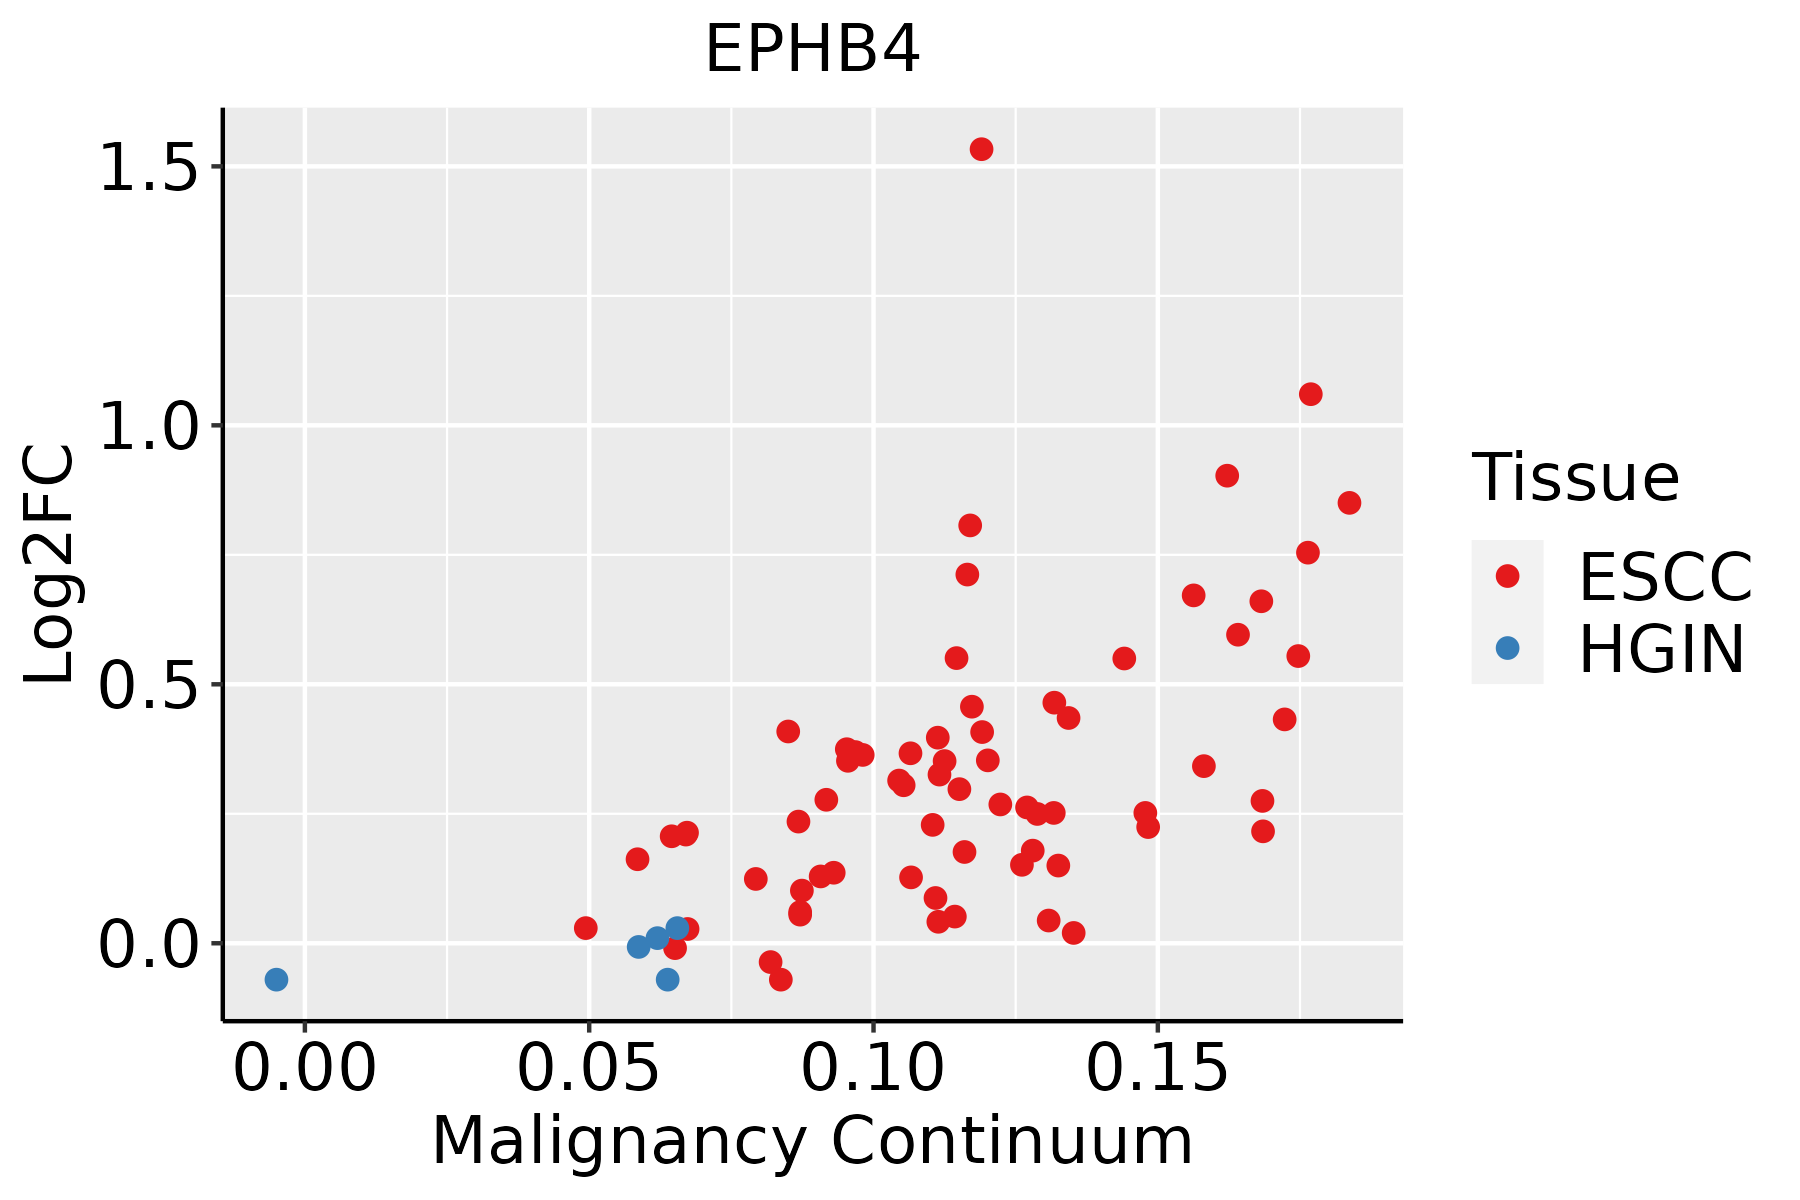 | ESCC: Esophageal squamous cell carcinoma |
| HGIN: High-grade intraepithelial neoplasias | ||
| LGIN: Low-grade intraepithelial neoplasias | ||
| Liver |  | HCC: Hepatocellular carcinoma |
| NAFLD: Non-alcoholic fatty liver disease | ||
| Oral Cavity | 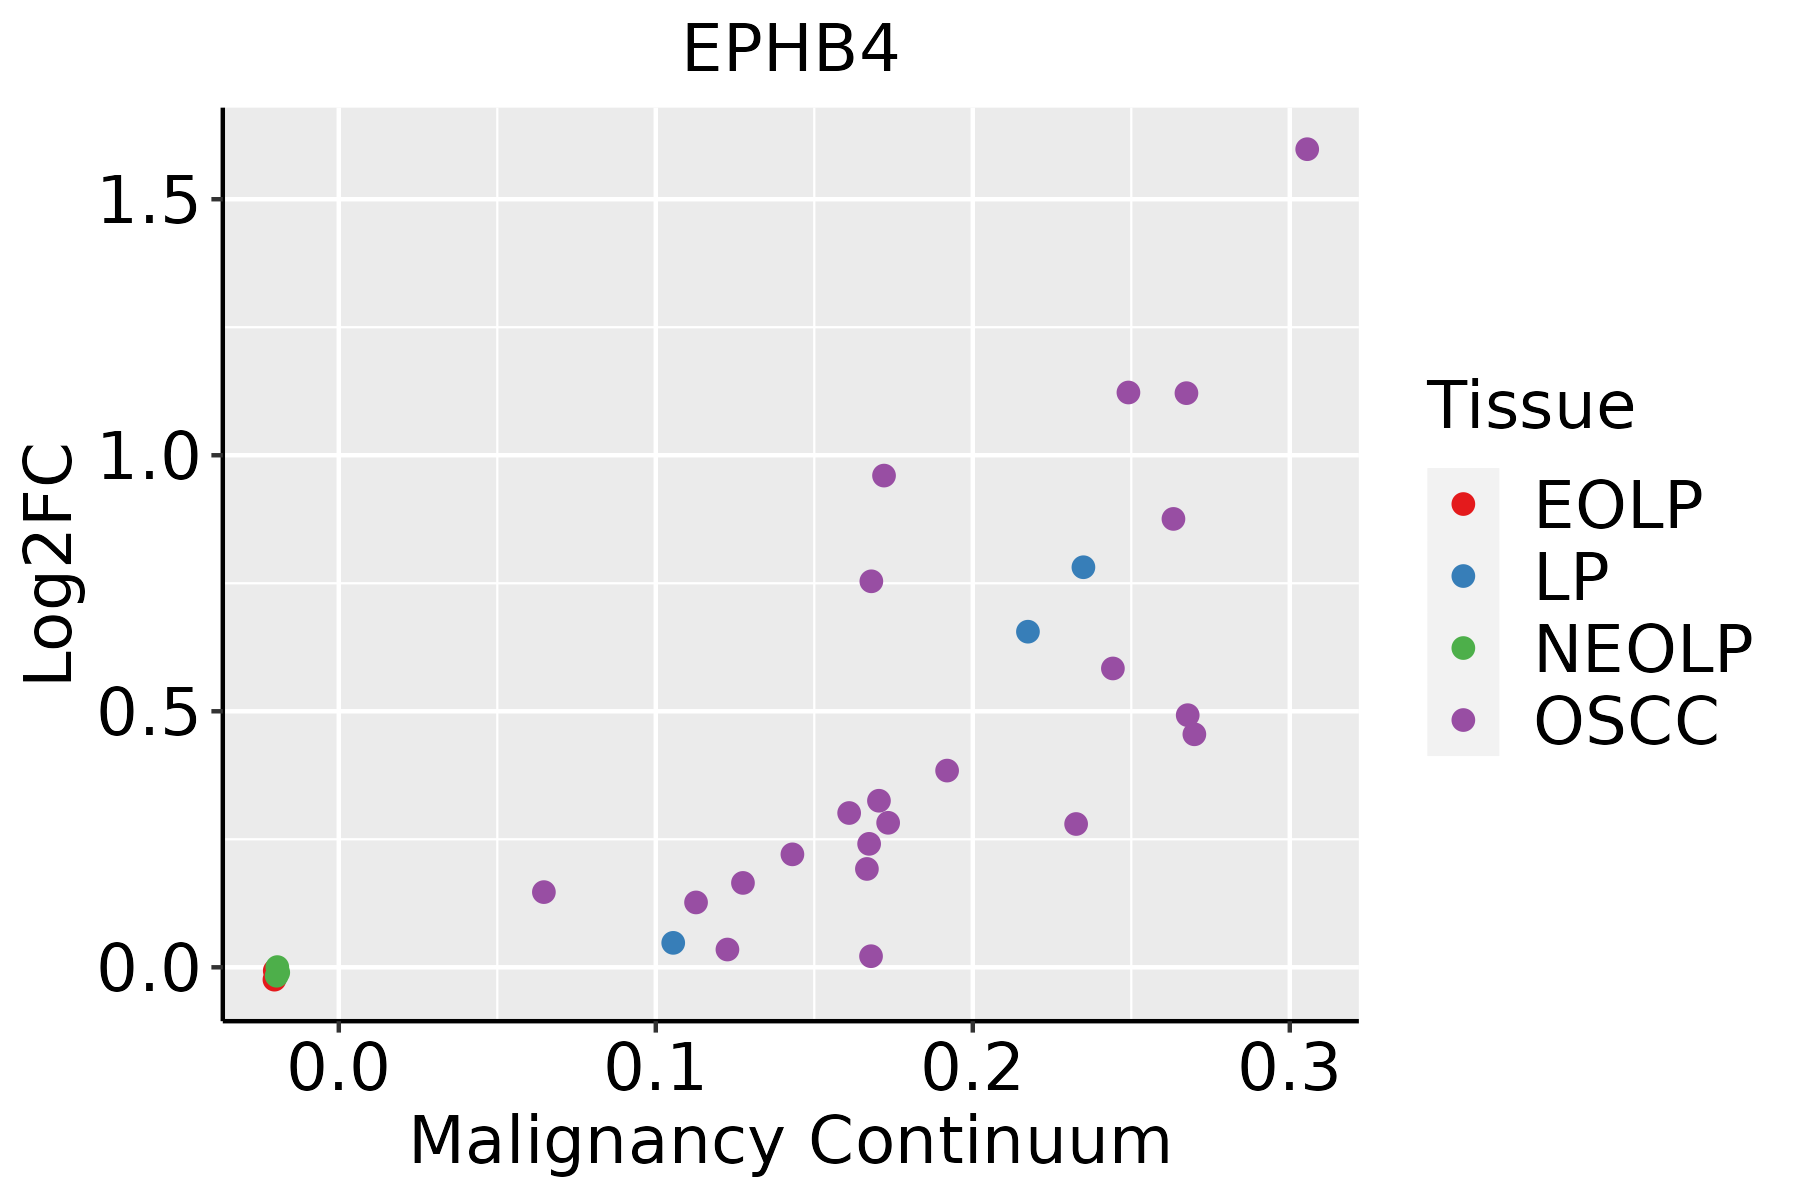 | EOLP: Erosive Oral lichen planus |
| LP: leukoplakia | ||
| NEOLP: Non-erosive oral lichen planus | ||
| OSCC: Oral squamous cell carcinoma | ||
| Skin | 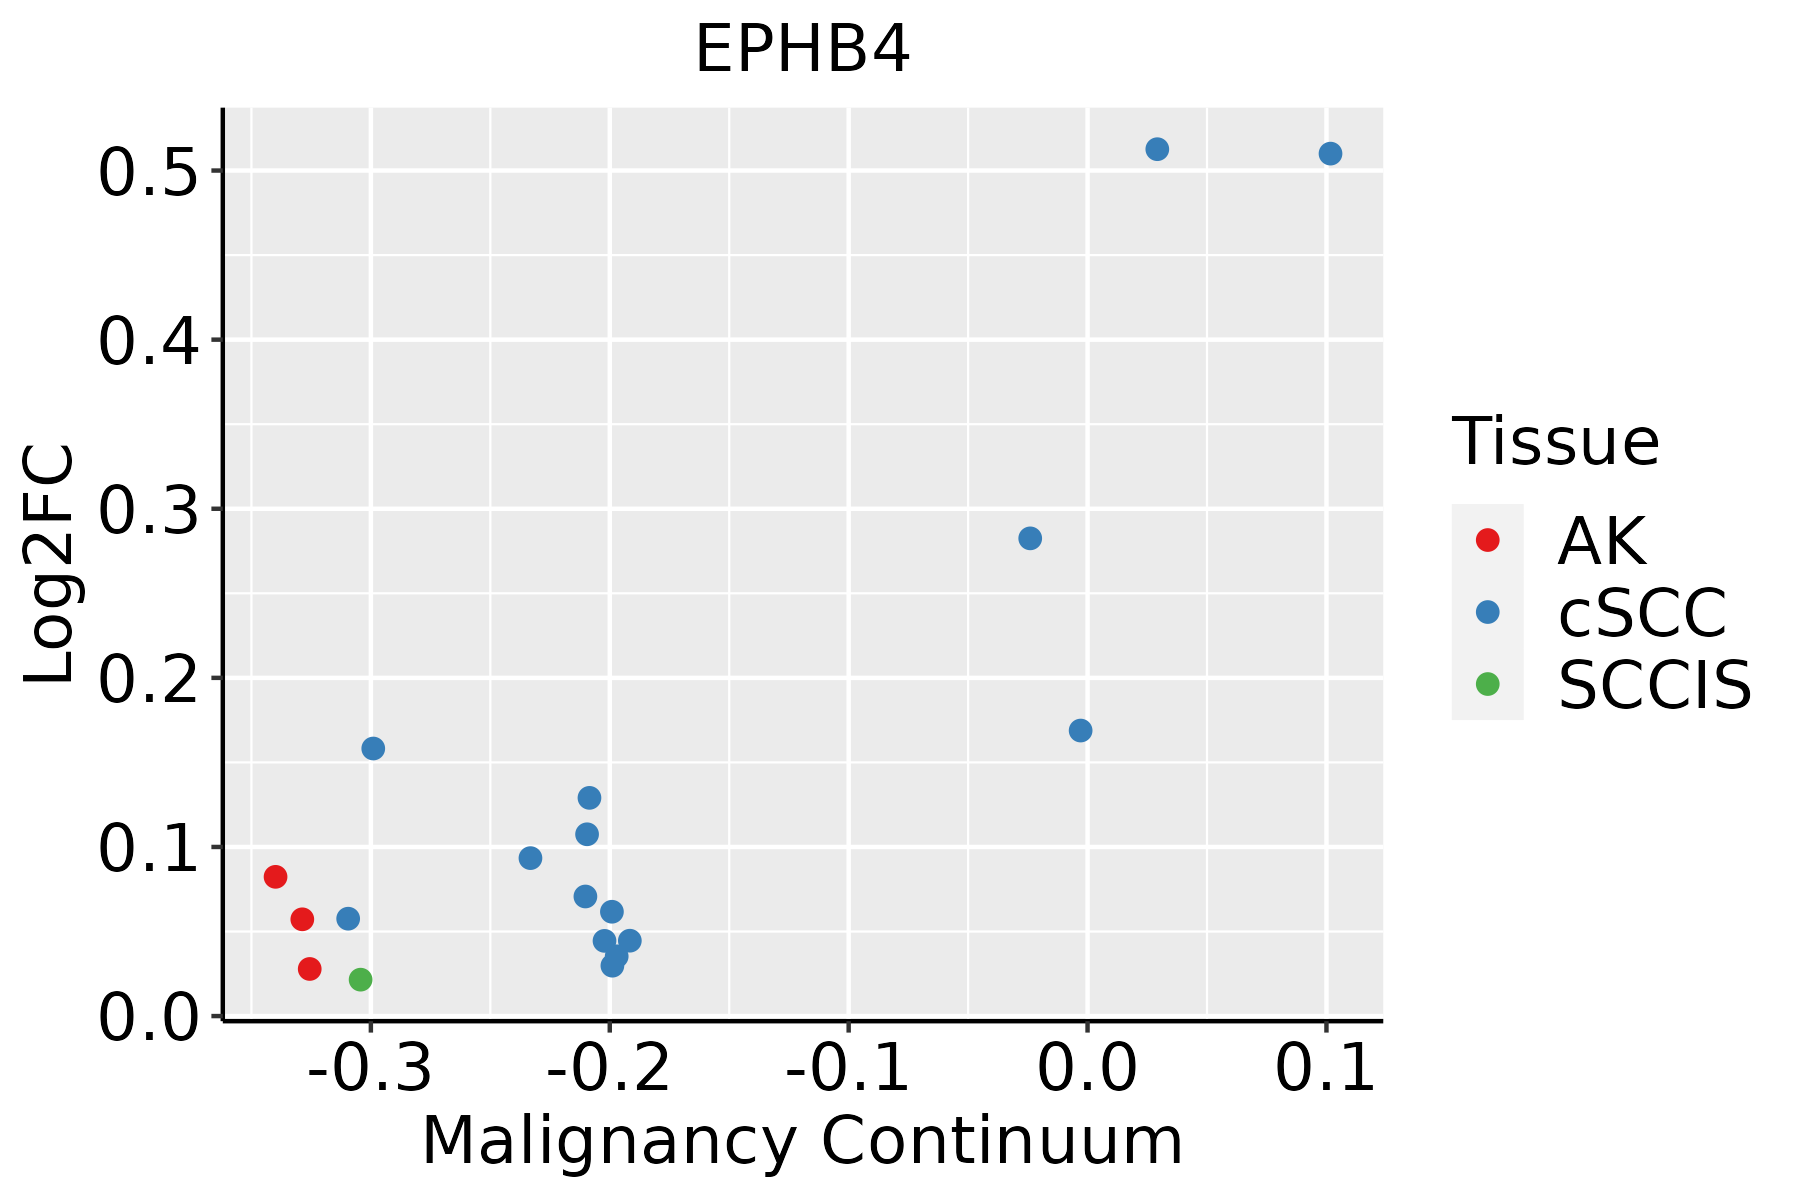 | AK: Actinic keratosis |
| cSCC: Cutaneous squamous cell carcinoma | ||
| SCCIS:squamous cell carcinoma in situ |
| ∗log2FC in expression of this searched gene in stem-like cells from each diseased tissue sample relative to stem-like cells in normal samples in each tissue plotted against the malignancy continuum. Samples are colored based on if they are from different disease stage. |
Top |
Malignant transformation related pathway analysis |
| Find out the enriched GO biological processes and KEGG pathways involved in transition from healthy to precancer to cancer |
| Tissue | Disease Stage | Enriched GO biological Processes |
| Colorectum | AD |  |
| Colorectum | SER |  |
| Colorectum | MSS |  |
| Colorectum | MSI-H |  |
| Colorectum | FAP |  |
| ∗Top 15 enriched GO BP terms are showed in the bar plot of each disease state in each tissue. Each row represents a significant GO biological process which is colored according to the -log10(p.adjust). |
| Page: 1 2 3 4 5 6 7 8 9 |
| GO ID | Tissue | Disease Stage | Description | Gene Ratio | Bg Ratio | pvalue | p.adjust | Count |
| GO:004677710 | Esophagus | ESCC | protein autophosphorylation | 138/8552 | 227/18723 | 2.98e-06 | 3.38e-05 | 138 |
| GO:003367420 | Esophagus | ESCC | positive regulation of kinase activity | 260/8552 | 467/18723 | 7.26e-06 | 7.22e-05 | 260 |
| GO:006156415 | Esophagus | ESCC | axon development | 251/8552 | 467/18723 | 2.41e-04 | 1.49e-03 | 251 |
| GO:000166720 | Esophagus | ESCC | ameboidal-type cell migration | 250/8552 | 475/18723 | 1.22e-03 | 5.97e-03 | 250 |
| GO:00182124 | Esophagus | ESCC | peptidyl-tyrosine modification | 202/8552 | 378/18723 | 1.34e-03 | 6.39e-03 | 202 |
| GO:00181084 | Esophagus | ESCC | peptidyl-tyrosine phosphorylation | 200/8552 | 375/18723 | 1.60e-03 | 7.45e-03 | 200 |
| GO:000740915 | Esophagus | ESCC | axonogenesis | 219/8552 | 418/18723 | 3.14e-03 | 1.31e-02 | 219 |
| GO:00480133 | Esophagus | ESCC | ephrin receptor signaling pathway | 33/8552 | 51/18723 | 4.77e-03 | 1.85e-02 | 33 |
| GO:001063120 | Esophagus | ESCC | epithelial cell migration | 187/8552 | 357/18723 | 6.05e-03 | 2.23e-02 | 187 |
| GO:009013220 | Esophagus | ESCC | epithelium migration | 188/8552 | 360/18723 | 6.96e-03 | 2.54e-02 | 188 |
| GO:009013020 | Esophagus | ESCC | tissue migration | 190/8552 | 365/18723 | 7.91e-03 | 2.82e-02 | 190 |
| GO:00467775 | Liver | HCC | protein autophosphorylation | 123/7958 | 227/18723 | 2.40e-04 | 1.80e-03 | 123 |
| GO:003367411 | Liver | HCC | positive regulation of kinase activity | 230/7958 | 467/18723 | 1.72e-03 | 8.95e-03 | 230 |
| GO:000166721 | Liver | HCC | ameboidal-type cell migration | 226/7958 | 475/18723 | 1.35e-02 | 4.81e-02 | 226 |
| GO:00467779 | Oral cavity | OSCC | protein autophosphorylation | 123/7305 | 227/18723 | 2.31e-06 | 2.93e-05 | 123 |
| GO:003367418 | Oral cavity | OSCC | positive regulation of kinase activity | 228/7305 | 467/18723 | 8.31e-06 | 8.90e-05 | 228 |
| GO:000166719 | Oral cavity | OSCC | ameboidal-type cell migration | 228/7305 | 475/18723 | 3.46e-05 | 3.10e-04 | 228 |
| GO:001063118 | Oral cavity | OSCC | epithelial cell migration | 174/7305 | 357/18723 | 1.04e-04 | 7.70e-04 | 174 |
| GO:009013218 | Oral cavity | OSCC | epithelium migration | 175/7305 | 360/18723 | 1.18e-04 | 8.54e-04 | 175 |
| GO:009013018 | Oral cavity | OSCC | tissue migration | 176/7305 | 365/18723 | 1.92e-04 | 1.29e-03 | 176 |
| Page: 1 2 |
| Pathway ID | Tissue | Disease Stage | Description | Gene Ratio | Bg Ratio | pvalue | p.adjust | qvalue | Count |
| hsa0436016 | Esophagus | ESCC | Axon guidance | 108/4205 | 182/8465 | 5.13e-03 | 1.30e-02 | 6.67e-03 | 108 |
| hsa0436017 | Esophagus | ESCC | Axon guidance | 108/4205 | 182/8465 | 5.13e-03 | 1.30e-02 | 6.67e-03 | 108 |
| hsa0436014 | Oral cavity | OSCC | Axon guidance | 97/3704 | 182/8465 | 5.59e-03 | 1.33e-02 | 6.76e-03 | 97 |
| hsa0436015 | Oral cavity | OSCC | Axon guidance | 97/3704 | 182/8465 | 5.59e-03 | 1.33e-02 | 6.76e-03 | 97 |
| Page: 1 |
Top |
Cell-cell communication analysis |
| Identification of potential cell-cell interactions between two cell types and their ligand-receptor pairs for different disease states |
| Ligand | Receptor | LRpair | Pathway | Tissue | Disease Stage |
| EFNB1 | EPHB4 | EFNB1_EPHB4 | EPHB | CRC | AD |
| EFNB1 | EPHB4 | EFNB1_EPHB4 | EPHB | CRC | MSI-H |
| EFNB2 | EPHB4 | EFNB2_EPHB4 | EPHB | CRC | MSI-H |
| EFNB1 | EPHB4 | EFNB1_EPHB4 | EPHB | CRC | MSS |
| EFNB2 | EPHB4 | EFNB2_EPHB4 | EPHB | CRC | MSS |
| EFNB1 | EPHB4 | EFNB1_EPHB4 | EPHB | CRC | SER |
| EFNB2 | EPHB4 | EFNB2_EPHB4 | EPHB | CRC | SER |
| EFNB2 | EPHB4 | EFNB2_EPHB4 | EPHB | Endometrium | ADJ |
| EFNB1 | EPHB4 | EFNB1_EPHB4 | EPHB | Esophagus | ESCC |
| EFNB2 | EPHB4 | EFNB2_EPHB4 | EPHB | Esophagus | ESCC |
| EFNB3 | EPHB4 | EFNB3_EPHB4 | EPHB | Esophagus | ESCC |
| EFNB2 | EPHB4 | EFNB2_EPHB4 | EPHB | HNSCC | ADJ |
| EFNB2 | EPHB4 | EFNB2_EPHB4 | EPHB | HNSCC | Healthy |
| EFNB1 | EPHB4 | EFNB1_EPHB4 | EPHB | HNSCC | OSCC |
| EFNB2 | EPHB4 | EFNB2_EPHB4 | EPHB | HNSCC | OSCC |
| EFNB1 | EPHB4 | EFNB1_EPHB4 | EPHB | HNSCC | Precancer |
| EFNB2 | EPHB4 | EFNB2_EPHB4 | EPHB | HNSCC | Precancer |
| EFNB1 | EPHB4 | EFNB1_EPHB4 | EPHB | Liver | Precancer |
| EFNB2 | EPHB4 | EFNB2_EPHB4 | EPHB | Liver | Precancer |
| EFNB2 | EPHB4 | EFNB2_EPHB4 | EPHB | Lung | AAH |
| Page: 1 |
Top |
Single-cell gene regulatory network inference analysis |
| Find out the significant the regulons (TFs) and the target genes of each regulon across cell types for different disease states |
| TF | Cell Type | Tissue | Disease Stage | Target Gene | RSS | Regulon Activity |
| ∗The dot plots of a searched regulon are shown for all cell subpopulations in each disease state of each tissue based on the regulon specific score inferred using pySCENIC and by calculating the average expression. |
| Page: 1 |
Top |
Somatic mutation of malignant transformation related genes |
| Annotation of somatic variants for genes involved in malignant transformation |
| Hugo Symbol | Variant Class | Variant Classification | dbSNP RS | HGVSc | HGVSp | HGVSp Short | SWISSPROT | BIOTYPE | SIFT | PolyPhen | Tumor Sample Barcode | Tissue | Histology | Sex | Age | Stage | Therapy Types | Drugs | Outcome |
| EPHB4 | SNV | Missense_Mutation | rs146064780 | c.1331G>A | p.Arg444Gln | p.R444Q | P54760 | protein_coding | tolerated(0.41) | benign(0.213) | TCGA-A7-A56D-01 | Breast | breast invasive carcinoma | Female | >=65 | I/II | Hormone Therapy | arimidex | SD |
| EPHB4 | SNV | Missense_Mutation | c.1676N>T | p.Ala559Val | p.A559V | P54760 | protein_coding | tolerated(0.54) | possibly_damaging(0.89) | TCGA-AN-A0AK-01 | Breast | breast invasive carcinoma | Female | >=65 | I/II | Unknown | Unknown | SD | |
| EPHB4 | SNV | Missense_Mutation | c.1216N>A | p.Val406Ile | p.V406I | P54760 | protein_coding | tolerated(0.94) | benign(0.309) | TCGA-AO-A124-01 | Breast | breast invasive carcinoma | Female | <65 | I/II | Chemotherapy | doxorubicin | SD | |
| EPHB4 | SNV | Missense_Mutation | c.2272N>C | p.Asp758His | p.D758H | P54760 | protein_coding | deleterious(0) | probably_damaging(1) | TCGA-C8-A1HM-01 | Breast | breast invasive carcinoma | Female | >=65 | I/II | Chemotherapy | doxorubicin | CR | |
| EPHB4 | SNV | Missense_Mutation | novel | c.1926N>A | p.Ser642Arg | p.S642R | P54760 | protein_coding | deleterious(0.02) | benign(0.154) | TCGA-OL-A6VQ-01 | Breast | breast invasive carcinoma | Female | <65 | I/II | Unknown | Unknown | SD |
| EPHB4 | deletion | Frame_Shift_Del | novel | c.2029delN | p.Ile677SerfsTer14 | p.I677Sfs*14 | P54760 | protein_coding | TCGA-D8-A27V-01 | Breast | breast invasive carcinoma | Female | <65 | I/II | Hormone Therapy | tamoxiphen | SD | ||
| EPHB4 | deletion | Frame_Shift_Del | novel | c.1396delN | p.Asp466ThrfsTer20 | p.D466Tfs*20 | P54760 | protein_coding | TCGA-D8-A27V-01 | Breast | breast invasive carcinoma | Female | <65 | I/II | Hormone Therapy | tamoxiphen | SD | ||
| EPHB4 | deletion | Frame_Shift_Del | novel | c.2586delN | p.Asn862LysfsTer16 | p.N862Kfs*16 | P54760 | protein_coding | TCGA-EW-A2FV-01 | Breast | breast invasive carcinoma | Female | <65 | III/IV | Chemotherapy | docetaxel | SD | ||
| EPHB4 | SNV | Missense_Mutation | rs773050327 | c.2930C>T | p.Pro977Leu | p.P977L | P54760 | protein_coding | deleterious(0) | benign(0.015) | TCGA-2W-A8YY-01 | Cervix | cervical & endocervical cancer | Female | <65 | I/II | Chemotherapy | cisplatin | CR |
| EPHB4 | SNV | Missense_Mutation | novel | c.2347C>T | p.Pro783Ser | p.P783S | P54760 | protein_coding | deleterious(0.01) | probably_damaging(1) | TCGA-2W-A8YY-01 | Cervix | cervical & endocervical cancer | Female | <65 | I/II | Chemotherapy | cisplatin | CR |
| Page: 1 2 3 4 5 6 7 8 9 10 |
Top |
Related drugs of malignant transformation related genes |
| Identification of chemicals and drugs interact with genes involved in malignant transfromation |
| (DGIdb 4.0) |
| Entrez ID | Symbol | Category | Interaction Types | Drug Claim Name | Drug Name | PMIDs |
| 2050 | EPHB4 | KINASE, TYROSINE KINASE, DRUGGABLE GENOME, ENZYME, CLINICALLY ACTIONABLE | inhibitor | CHEMBL3544983 | TESEVATINIB | |
| 2050 | EPHB4 | KINASE, TYROSINE KINASE, DRUGGABLE GENOME, ENZYME, CLINICALLY ACTIONABLE | XL647 | TESEVATINIB | ||
| 2050 | EPHB4 | KINASE, TYROSINE KINASE, DRUGGABLE GENOME, ENZYME, CLINICALLY ACTIONABLE | inhibitor | XL647 | TESEVATINIB | |
| 2050 | EPHB4 | KINASE, TYROSINE KINASE, DRUGGABLE GENOME, ENZYME, CLINICALLY ACTIONABLE | inhibitor | CHEMBL24828 | VANDETANIB | |
| 2050 | EPHB4 | KINASE, TYROSINE KINASE, DRUGGABLE GENOME, ENZYME, CLINICALLY ACTIONABLE | inhibitor | CHEMBL403989 | TG100-801 | |
| 2050 | EPHB4 | KINASE, TYROSINE KINASE, DRUGGABLE GENOME, ENZYME, CLINICALLY ACTIONABLE | KD019 | TESEVATINIB | ||
| 2050 | EPHB4 | KINASE, TYROSINE KINASE, DRUGGABLE GENOME, ENZYME, CLINICALLY ACTIONABLE | inhibitor | XL647 | TESEVATINIB | |
| 2050 | EPHB4 | KINASE, TYROSINE KINASE, DRUGGABLE GENOME, ENZYME, CLINICALLY ACTIONABLE | inhibitor | 249565821 | ||
| 2050 | EPHB4 | KINASE, TYROSINE KINASE, DRUGGABLE GENOME, ENZYME, CLINICALLY ACTIONABLE | inhibitor | 249565627 | TESEVATINIB | |
| 2050 | EPHB4 | KINASE, TYROSINE KINASE, DRUGGABLE GENOME, ENZYME, CLINICALLY ACTIONABLE | inhibitor | CHEMBL3545155 | JI-101 |
| Page: 1 |

Copyright 2023-Present -The University of Texas Health Science Center at Houston |