
|
|||||
|
 | |
| |
| |
| |
| |
| |
|
Gene: EPHB3 |
Gene summary for EPHB3 |
| Gene information | Species | Human | Gene symbol | EPHB3 | Gene ID | 2049 |
| Gene name | EPH receptor B3 | |
| Gene Alias | EK2 | |
| Cytomap | 3q27.1 | |
| Gene Type | protein-coding | GO ID | GO:0000902 | UniProtAcc | P54753 |
Top |
Malignant transformation analysis |
| Identification of the aberrant gene expression in precancerous and cancerous lesions by comparing the gene expression of stem-like cells in diseased tissues with normal stem cells |
| Entrez ID | Symbol | Replicates | Species | Organ | Tissue | Adj P-value | Log2FC | Malignancy |
| 2049 | EPHB3 | HTA11_3410_2000001011 | Human | Colorectum | AD | 3.98e-14 | 3.97e-01 | 0.0155 |
| 2049 | EPHB3 | HTA11_2951_2000001011 | Human | Colorectum | AD | 1.10e-07 | 8.39e-01 | 0.0216 |
| 2049 | EPHB3 | HTA11_696_2000001011 | Human | Colorectum | AD | 6.84e-05 | 7.20e-01 | -0.1464 |
| 2049 | EPHB3 | HTA11_1391_2000001011 | Human | Colorectum | AD | 2.56e-12 | 7.87e-01 | -0.059 |
| 2049 | EPHB3 | HTA11_866_3004761011 | Human | Colorectum | AD | 4.57e-41 | 1.14e+00 | 0.096 |
| 2049 | EPHB3 | HTA11_4255_2000001011 | Human | Colorectum | SER | 8.53e-08 | 8.69e-01 | 0.0446 |
| 2049 | EPHB3 | HTA11_9408_2000001011 | Human | Colorectum | AD | 2.81e-10 | 1.28e+00 | 0.0451 |
| 2049 | EPHB3 | HTA11_8622_2000001021 | Human | Colorectum | SER | 3.08e-13 | 1.11e+00 | 0.0528 |
| 2049 | EPHB3 | HTA11_7663_2000001011 | Human | Colorectum | SER | 1.49e-04 | 8.81e-01 | 0.0131 |
| 2049 | EPHB3 | HTA11_10623_2000001011 | Human | Colorectum | AD | 9.82e-05 | 9.58e-01 | -0.0177 |
| 2049 | EPHB3 | HTA11_10711_2000001011 | Human | Colorectum | AD | 1.60e-30 | 1.20e+00 | 0.0338 |
| 2049 | EPHB3 | HTA11_7696_3000711011 | Human | Colorectum | AD | 1.55e-72 | 2.03e+00 | 0.0674 |
| 2049 | EPHB3 | HTA11_6818_2000001011 | Human | Colorectum | AD | 2.86e-09 | 9.59e-01 | 0.0112 |
| 2049 | EPHB3 | HTA11_11156_2000001011 | Human | Colorectum | AD | 3.11e-12 | 1.46e+00 | 0.0397 |
| 2049 | EPHB3 | HTA11_6818_2000001021 | Human | Colorectum | AD | 1.30e-30 | 1.25e+00 | 0.0588 |
| 2049 | EPHB3 | HTA11_99999970781_79442 | Human | Colorectum | MSS | 4.58e-59 | 1.81e+00 | 0.294 |
| 2049 | EPHB3 | HTA11_99999973899_84307 | Human | Colorectum | MSS | 2.73e-10 | 8.02e-01 | 0.2585 |
| 2049 | EPHB3 | HTA11_99999974143_84620 | Human | Colorectum | MSS | 1.03e-08 | 6.99e-01 | 0.3005 |
| 2049 | EPHB3 | A001-C-207 | Human | Colorectum | FAP | 3.54e-03 | 4.39e-01 | 0.1278 |
| 2049 | EPHB3 | A015-C-203 | Human | Colorectum | FAP | 1.01e-08 | 4.51e-01 | -0.1294 |
| Page: 1 2 3 4 5 |
| Tissue | Expression Dynamics | Abbreviation |
| Colorectum (GSE201348) | 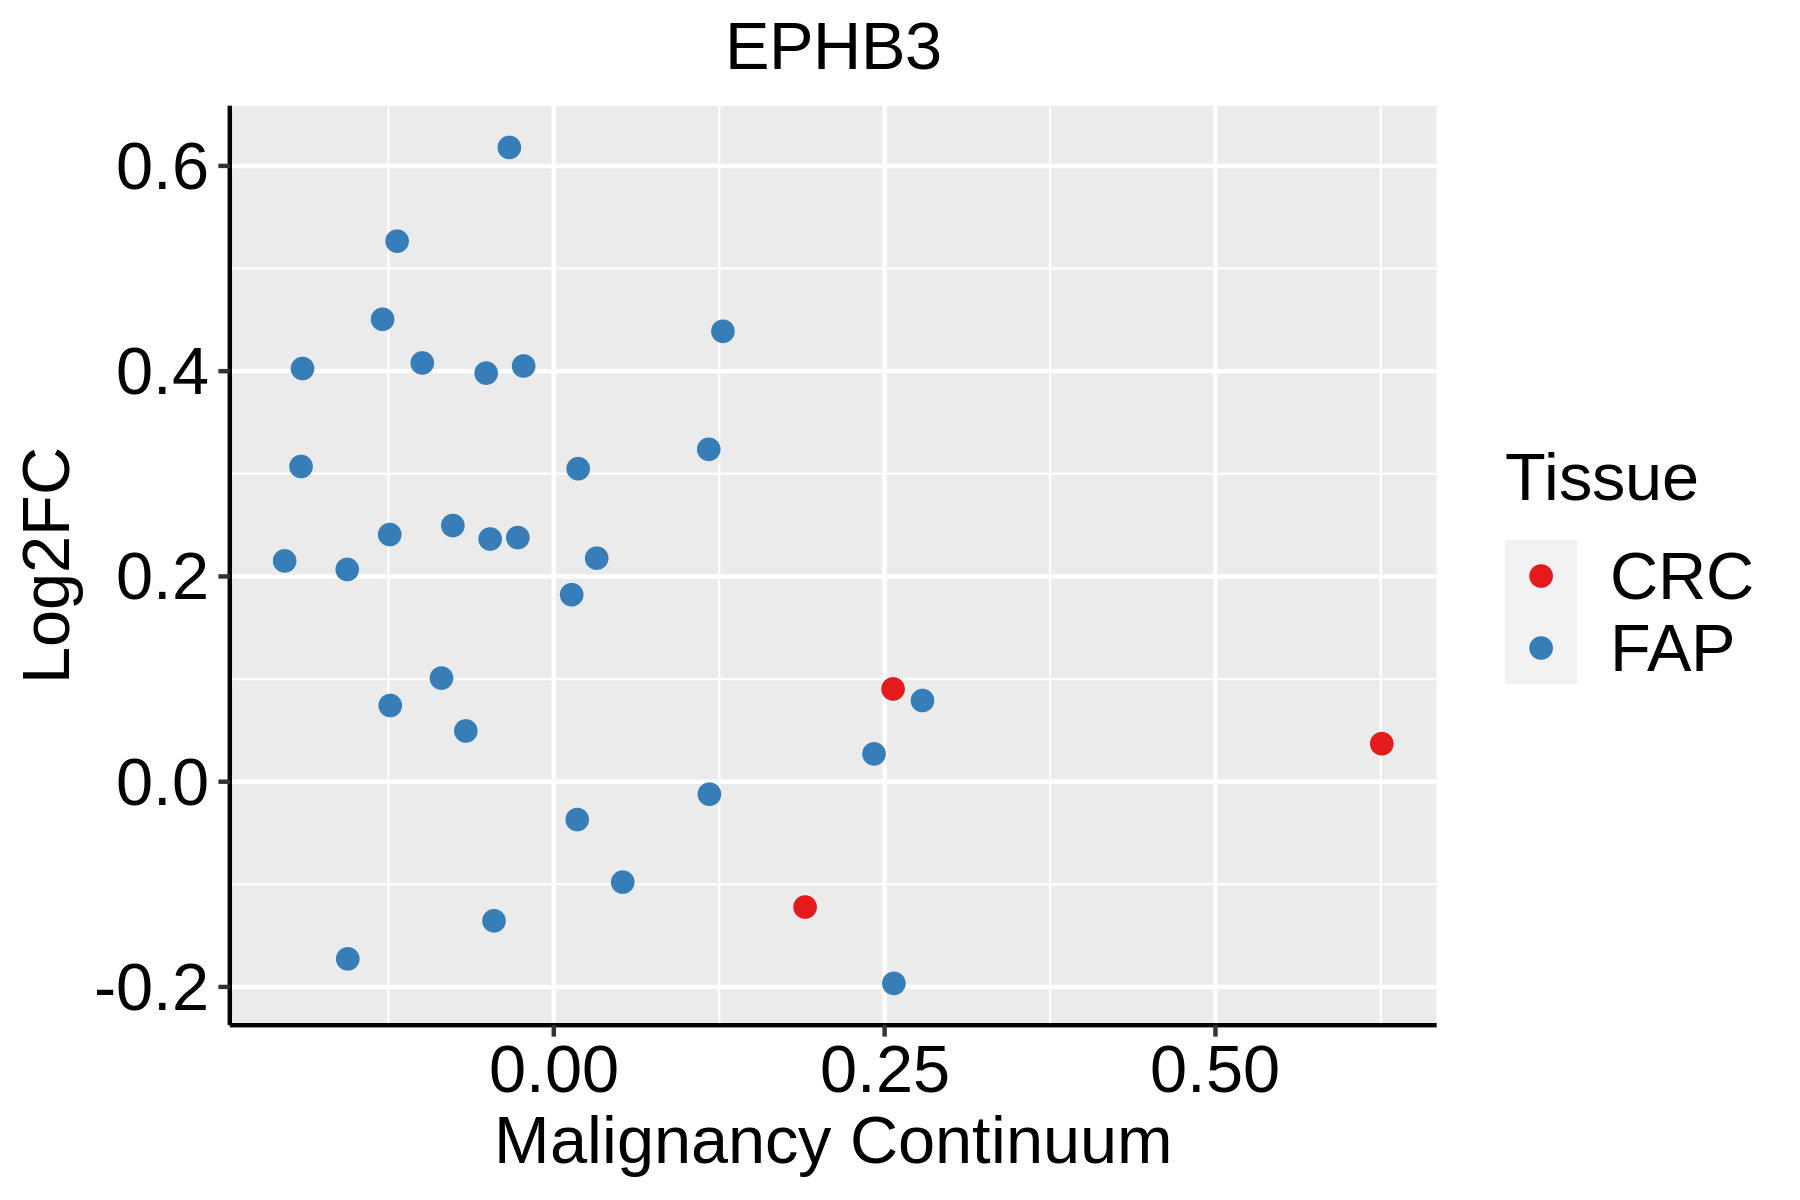 | FAP: Familial adenomatous polyposis |
| CRC: Colorectal cancer | ||
| Colorectum (HTA11) |  | AD: Adenomas |
| SER: Sessile serrated lesions | ||
| MSI-H: Microsatellite-high colorectal cancer | ||
| MSS: Microsatellite stable colorectal cancer | ||
| Esophagus | 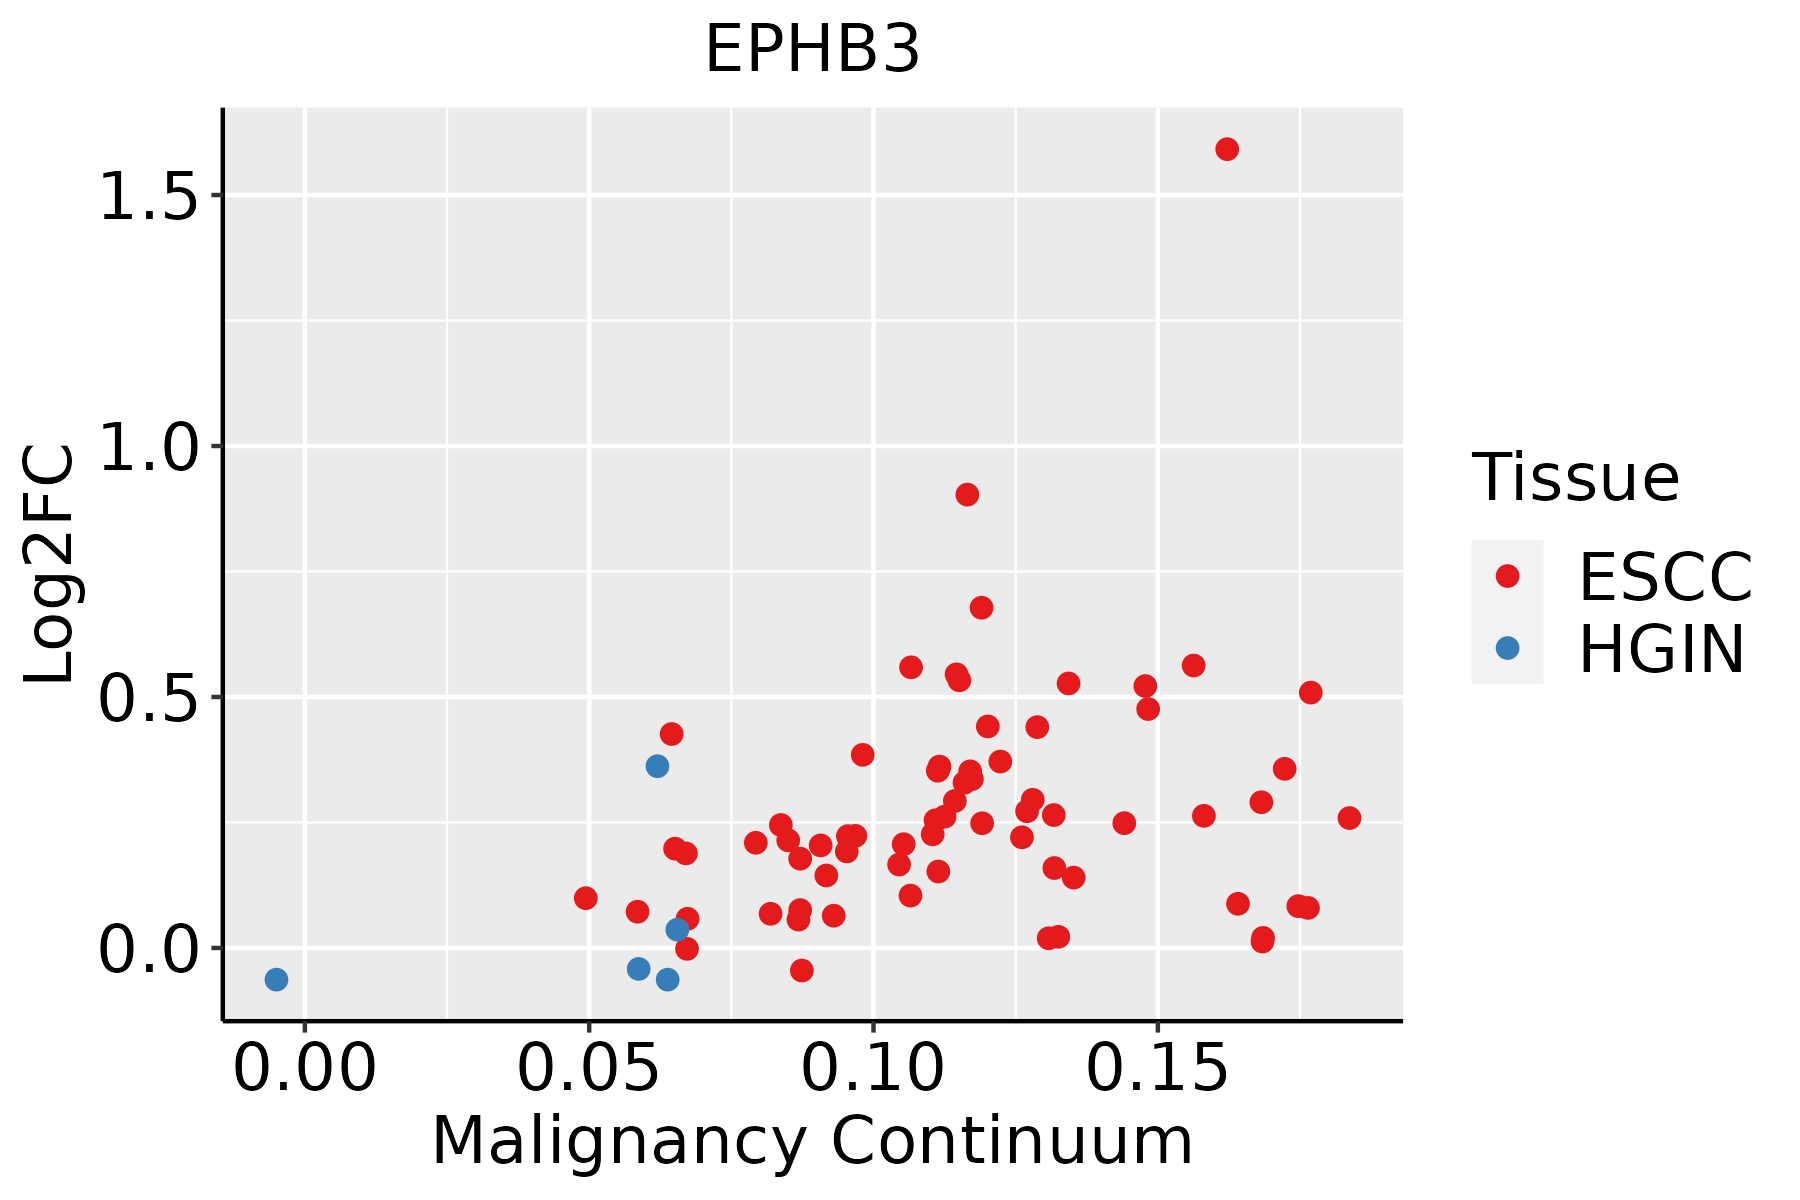 | ESCC: Esophageal squamous cell carcinoma |
| HGIN: High-grade intraepithelial neoplasias | ||
| LGIN: Low-grade intraepithelial neoplasias | ||
| Oral Cavity |  | EOLP: Erosive Oral lichen planus |
| LP: leukoplakia | ||
| NEOLP: Non-erosive oral lichen planus | ||
| OSCC: Oral squamous cell carcinoma | ||
| Thyroid | 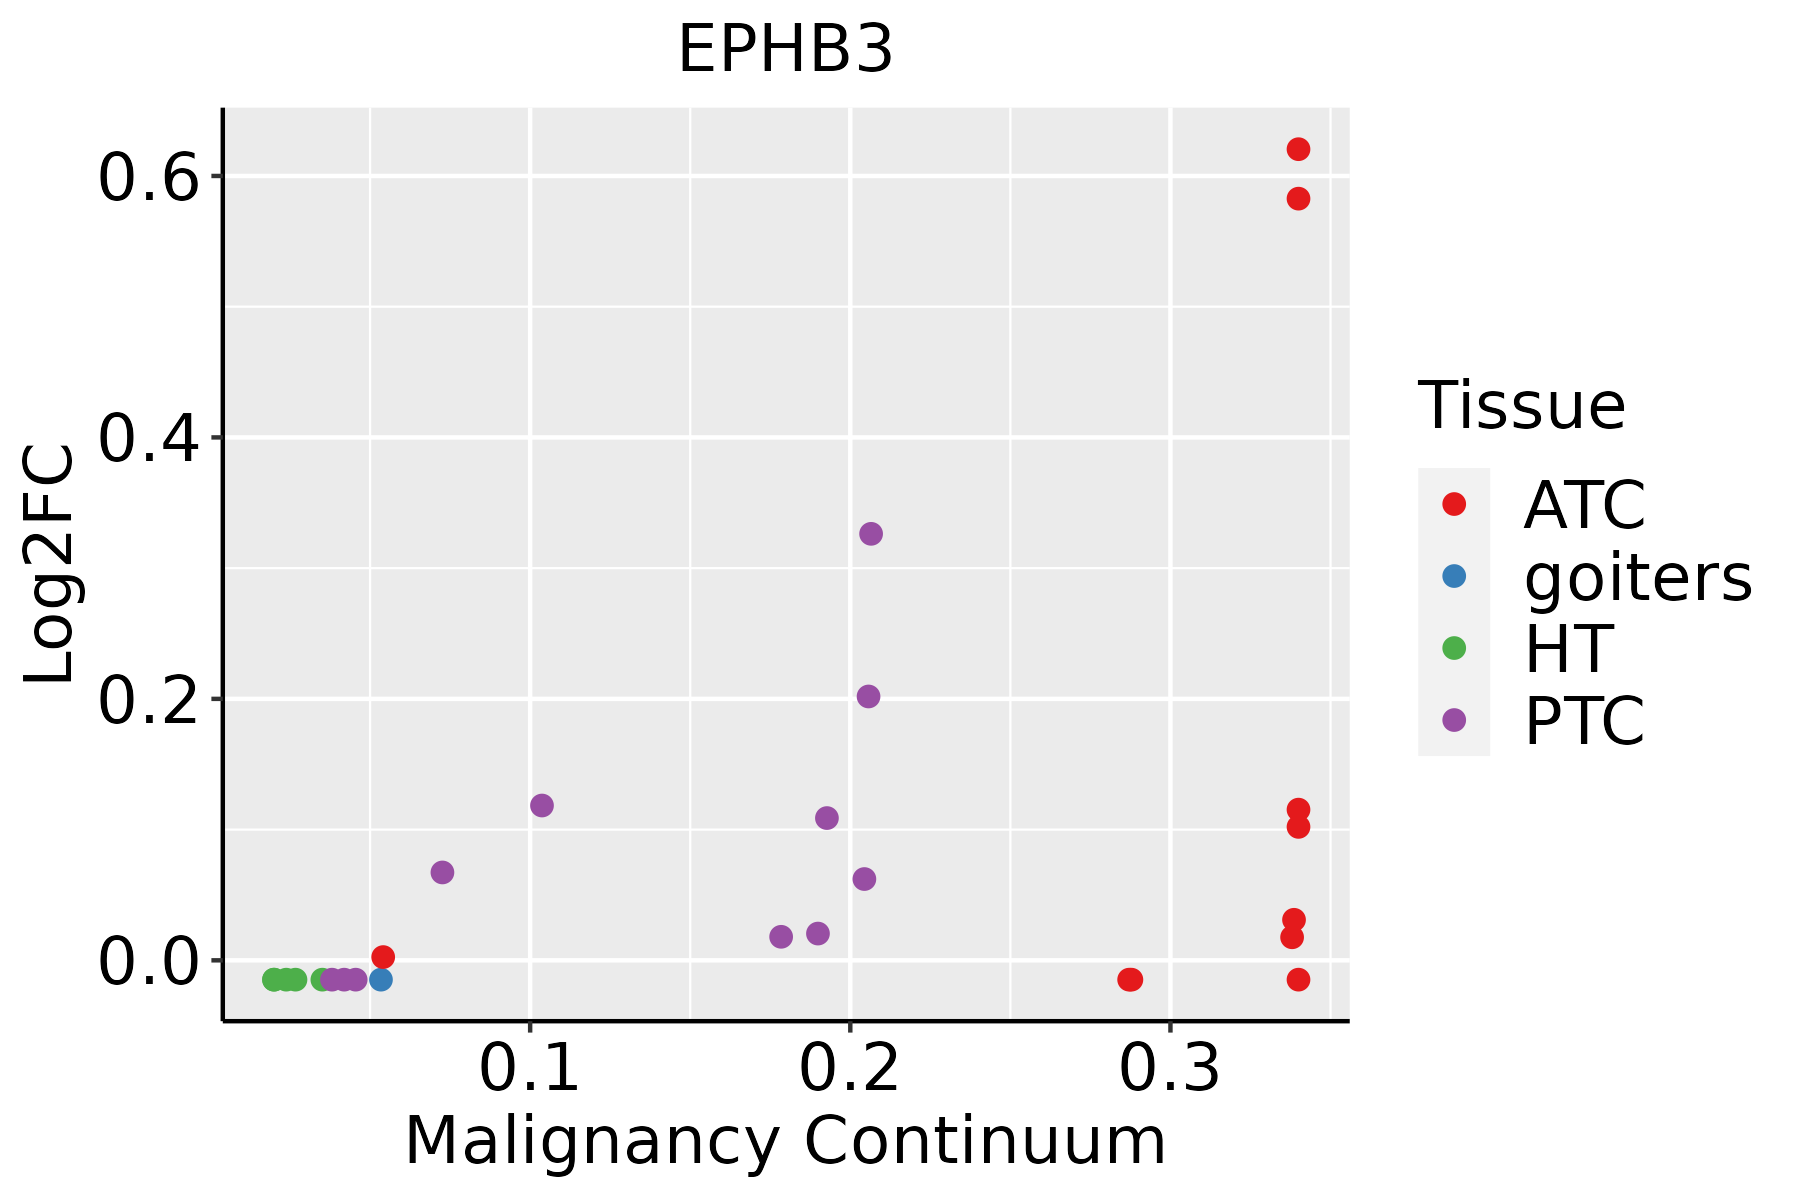 | ATC: Anaplastic thyroid cancer |
| HT: Hashimoto's thyroiditis | ||
| PTC: Papillary thyroid cancer |
| ∗log2FC in expression of this searched gene in stem-like cells from each diseased tissue sample relative to stem-like cells in normal samples in each tissue plotted against the malignancy continuum. Samples are colored based on if they are from different disease stage. |
Top |
Malignant transformation related pathway analysis |
| Find out the enriched GO biological processes and KEGG pathways involved in transition from healthy to precancer to cancer |
| Tissue | Disease Stage | Enriched GO biological Processes |
| Colorectum | AD |  |
| Colorectum | SER |  |
| Colorectum | MSS |  |
| Colorectum | MSI-H |  |
| Colorectum | FAP |  |
| ∗Top 15 enriched GO BP terms are showed in the bar plot of each disease state in each tissue. Each row represents a significant GO biological process which is colored according to the -log10(p.adjust). |
| Page: 1 2 3 4 5 6 7 8 9 |
| GO ID | Tissue | Disease Stage | Description | Gene Ratio | Bg Ratio | pvalue | p.adjust | Count |
| GO:0048732 | Colorectum | AD | gland development | 149/3918 | 436/18723 | 6.07e-11 | 6.33e-09 | 149 |
| GO:0034329 | Colorectum | AD | cell junction assembly | 136/3918 | 420/18723 | 2.02e-08 | 1.15e-06 | 136 |
| GO:0031589 | Colorectum | AD | cell-substrate adhesion | 116/3918 | 363/18723 | 4.68e-07 | 1.76e-05 | 116 |
| GO:0043087 | Colorectum | AD | regulation of GTPase activity | 110/3918 | 348/18723 | 1.64e-06 | 5.03e-05 | 110 |
| GO:0046777 | Colorectum | AD | protein autophosphorylation | 74/3918 | 227/18723 | 2.48e-05 | 4.76e-04 | 74 |
| GO:0010975 | Colorectum | AD | regulation of neuron projection development | 129/3918 | 445/18723 | 2.88e-05 | 5.37e-04 | 129 |
| GO:0007409 | Colorectum | AD | axonogenesis | 122/3918 | 418/18723 | 3.36e-05 | 6.15e-04 | 122 |
| GO:0106027 | Colorectum | AD | neuron projection organization | 36/3918 | 93/18723 | 6.58e-05 | 1.07e-03 | 36 |
| GO:0061564 | Colorectum | AD | axon development | 132/3918 | 467/18723 | 8.40e-05 | 1.31e-03 | 132 |
| GO:0034446 | Colorectum | AD | substrate adhesion-dependent cell spreading | 40/3918 | 108/18723 | 8.52e-05 | 1.32e-03 | 40 |
| GO:0033674 | Colorectum | AD | positive regulation of kinase activity | 131/3918 | 467/18723 | 1.28e-04 | 1.85e-03 | 131 |
| GO:0097061 | Colorectum | AD | dendritic spine organization | 31/3918 | 84/18723 | 5.48e-04 | 5.83e-03 | 31 |
| GO:0050770 | Colorectum | AD | regulation of axonogenesis | 49/3918 | 154/18723 | 9.88e-04 | 9.28e-03 | 49 |
| GO:1901888 | Colorectum | AD | regulation of cell junction assembly | 61/3918 | 204/18723 | 1.50e-03 | 1.27e-02 | 61 |
| GO:0099173 | Colorectum | AD | postsynapse organization | 51/3918 | 168/18723 | 2.47e-03 | 1.90e-02 | 51 |
| GO:0016358 | Colorectum | AD | dendrite development | 69/3918 | 243/18723 | 3.32e-03 | 2.42e-02 | 69 |
| GO:0050808 | Colorectum | AD | synapse organization | 112/3918 | 426/18723 | 4.25e-03 | 2.92e-02 | 112 |
| GO:0007411 | Colorectum | AD | axon guidance | 64/3918 | 227/18723 | 5.41e-03 | 3.55e-02 | 64 |
| GO:0050807 | Colorectum | AD | regulation of synapse organization | 60/3918 | 211/18723 | 5.67e-03 | 3.64e-02 | 60 |
| GO:0097485 | Colorectum | AD | neuron projection guidance | 64/3918 | 228/18723 | 6.02e-03 | 3.78e-02 | 64 |
| Page: 1 2 3 4 5 6 7 8 9 10 |
| Pathway ID | Tissue | Disease Stage | Description | Gene Ratio | Bg Ratio | pvalue | p.adjust | qvalue | Count |
| hsa04360 | Colorectum | AD | Axon guidance | 61/2092 | 182/8465 | 4.36e-03 | 2.17e-02 | 1.38e-02 | 61 |
| hsa043601 | Colorectum | AD | Axon guidance | 61/2092 | 182/8465 | 4.36e-03 | 2.17e-02 | 1.38e-02 | 61 |
| hsa043602 | Colorectum | MSS | Axon guidance | 54/1875 | 182/8465 | 1.03e-02 | 3.69e-02 | 2.26e-02 | 54 |
| hsa043603 | Colorectum | MSS | Axon guidance | 54/1875 | 182/8465 | 1.03e-02 | 3.69e-02 | 2.26e-02 | 54 |
| hsa043604 | Colorectum | FAP | Axon guidance | 47/1404 | 182/8465 | 9.09e-04 | 5.20e-03 | 3.16e-03 | 47 |
| hsa043605 | Colorectum | FAP | Axon guidance | 47/1404 | 182/8465 | 9.09e-04 | 5.20e-03 | 3.16e-03 | 47 |
| hsa0436016 | Esophagus | ESCC | Axon guidance | 108/4205 | 182/8465 | 5.13e-03 | 1.30e-02 | 6.67e-03 | 108 |
| hsa0436017 | Esophagus | ESCC | Axon guidance | 108/4205 | 182/8465 | 5.13e-03 | 1.30e-02 | 6.67e-03 | 108 |
| hsa0436014 | Oral cavity | OSCC | Axon guidance | 97/3704 | 182/8465 | 5.59e-03 | 1.33e-02 | 6.76e-03 | 97 |
| hsa0436015 | Oral cavity | OSCC | Axon guidance | 97/3704 | 182/8465 | 5.59e-03 | 1.33e-02 | 6.76e-03 | 97 |
| Page: 1 |
Top |
Cell-cell communication analysis |
| Identification of potential cell-cell interactions between two cell types and their ligand-receptor pairs for different disease states |
| Ligand | Receptor | LRpair | Pathway | Tissue | Disease Stage |
| EFNB1 | EPHB3 | EFNB1_EPHB3 | EPHB | CRC | MSI-H |
| EFNB2 | EPHB3 | EFNB2_EPHB3 | EPHB | CRC | MSI-H |
| EFNB1 | EPHB3 | EFNB1_EPHB3 | EPHB | CRC | MSS |
| EFNB2 | EPHB3 | EFNB2_EPHB3 | EPHB | CRC | MSS |
| EFNB1 | EPHB3 | EFNB1_EPHB3 | EPHB | CRC | SER |
| EFNB2 | EPHB3 | EFNB2_EPHB3 | EPHB | CRC | SER |
| EFNB1 | EPHB3 | EFNB1_EPHB3 | EPHB | Esophagus | ESCC |
| EFNB2 | EPHB3 | EFNB2_EPHB3 | EPHB | Esophagus | ESCC |
| EFNB3 | EPHB3 | EFNB3_EPHB3 | EPHB | Esophagus | ESCC |
| EFNB1 | EPHB3 | EFNB1_EPHB3 | EPHB | HNSCC | OSCC |
| EFNB2 | EPHB3 | EFNB2_EPHB3 | EPHB | HNSCC | OSCC |
| EFNB1 | EPHB3 | EFNB1_EPHB3 | EPHB | HNSCC | Precancer |
| EFNB2 | EPHB3 | EFNB2_EPHB3 | EPHB | HNSCC | Precancer |
| EFNB2 | EPHB3 | EFNB2_EPHB3 | EPHB | Lung | AAH |
| EFNB1 | EPHB3 | EFNB1_EPHB3 | EPHB | Skin | ADJ |
| EFNB1 | EPHB3 | EFNB1_EPHB3 | EPHB | THCA | Cancer |
| EFNB2 | EPHB3 | EFNB2_EPHB3 | EPHB | THCA | Cancer |
| Page: 1 |
Top |
Single-cell gene regulatory network inference analysis |
| Find out the significant the regulons (TFs) and the target genes of each regulon across cell types for different disease states |
| TF | Cell Type | Tissue | Disease Stage | Target Gene | RSS | Regulon Activity |
| ∗The dot plots of a searched regulon are shown for all cell subpopulations in each disease state of each tissue based on the regulon specific score inferred using pySCENIC and by calculating the average expression. |
| Page: 1 |
Top |
Somatic mutation of malignant transformation related genes |
| Annotation of somatic variants for genes involved in malignant transformation |
| Hugo Symbol | Variant Class | Variant Classification | dbSNP RS | HGVSc | HGVSp | HGVSp Short | SWISSPROT | BIOTYPE | SIFT | PolyPhen | Tumor Sample Barcode | Tissue | Histology | Sex | Age | Stage | Therapy Types | Drugs | Outcome |
| EPHB3 | SNV | Missense_Mutation | c.2456N>C | p.Ser819Thr | p.S819T | P54753 | protein_coding | deleterious(0) | probably_damaging(0.994) | TCGA-A1-A0SO-01 | Breast | breast invasive carcinoma | Female | >=65 | I/II | Chemotherapy | SD | ||
| EPHB3 | SNV | Missense_Mutation | c.2839N>T | p.Val947Phe | p.V947F | P54753 | protein_coding | deleterious(0.04) | benign(0.279) | TCGA-A1-A0SO-01 | Breast | breast invasive carcinoma | Female | >=65 | I/II | Chemotherapy | SD | ||
| EPHB3 | SNV | Missense_Mutation | c.2642N>A | p.Leu881His | p.L881H | P54753 | protein_coding | tolerated(0.22) | probably_damaging(0.985) | TCGA-A7-A26G-01 | Breast | breast invasive carcinoma | Female | <65 | I/II | Chemotherapy | taxotere | SD | |
| EPHB3 | SNV | Missense_Mutation | c.2983N>T | p.Pro995Ser | p.P995S | P54753 | protein_coding | tolerated(0.26) | probably_damaging(0.996) | TCGA-AO-A128-01 | Breast | breast invasive carcinoma | Female | <65 | I/II | Chemotherapy | doxorubicin | SD | |
| EPHB3 | SNV | Missense_Mutation | c.1946G>C | p.Arg649Pro | p.R649P | P54753 | protein_coding | deleterious(0.02) | probably_damaging(1) | TCGA-B6-A0X1-01 | Breast | breast invasive carcinoma | Female | <65 | I/II | Unknown | Unknown | PD | |
| EPHB3 | SNV | Missense_Mutation | novel | c.1202G>C | p.Arg401Pro | p.R401P | P54753 | protein_coding | tolerated(0.05) | probably_damaging(0.959) | TCGA-B6-A400-01 | Breast | breast invasive carcinoma | Female | <65 | III/IV | Unknown | Unknown | SD |
| EPHB3 | SNV | Missense_Mutation | c.151N>C | p.Glu51Gln | p.E51Q | P54753 | protein_coding | deleterious(0.01) | probably_damaging(0.998) | TCGA-D8-A1JA-01 | Breast | breast invasive carcinoma | Female | <65 | III/IV | Chemotherapy | adriamycin | PD | |
| EPHB3 | SNV | Missense_Mutation | c.2458G>A | p.Asp820Asn | p.D820N | P54753 | protein_coding | deleterious(0) | probably_damaging(0.999) | TCGA-EW-A1OV-01 | Breast | breast invasive carcinoma | Female | <65 | I/II | Chemotherapy | epirubicin | SD | |
| EPHB3 | SNV | Missense_Mutation | novel | c.175G>A | p.Glu59Lys | p.E59K | P54753 | protein_coding | tolerated(0.7) | benign(0.056) | TCGA-GM-A2D9-01 | Breast | breast invasive carcinoma | Female | >=65 | I/II | Hormone Therapy | arimidex | SD |
| EPHB3 | insertion | Nonsense_Mutation | novel | c.2045_2046insCGTGCCCGCACAGTAGCTGGCTAT | p.Glu682delinsAspValProAlaGlnTerLeuAlaMet | p.E682delinsDVPAQ*LAM | P54753 | protein_coding | TCGA-A2-A0EY-01 | Breast | breast invasive carcinoma | Female | <65 | I/II | Chemotherapy | adriamycin | SD |
| Page: 1 2 3 4 5 6 7 8 9 10 11 12 13 |
Top |
Related drugs of malignant transformation related genes |
| Identification of chemicals and drugs interact with genes involved in malignant transfromation |
| (DGIdb 4.0) |
| Entrez ID | Symbol | Category | Interaction Types | Drug Claim Name | Drug Name | PMIDs |
| 2049 | EPHB3 | DRUGGABLE GENOME, TYROSINE KINASE, KINASE | inhibitor | CHEMBL24828 | VANDETANIB | |
| 2049 | EPHB3 | DRUGGABLE GENOME, TYROSINE KINASE, KINASE | inhibitor | 249565821 |
| Page: 1 |

Copyright 2023-Present -The University of Texas Health Science Center at Houston |