
|
|||||
|
 | |
| |
| |
| |
| |
| |
|
Gene: EPHA2 |
Gene summary for EPHA2 |
| Gene information | Species | Human | Gene symbol | EPHA2 | Gene ID | 1969 |
| Gene name | EPH receptor A2 | |
| Gene Alias | ARCC2 | |
| Cytomap | 1p36.13 | |
| Gene Type | protein-coding | GO ID | GO:0000165 | UniProtAcc | A0A024QZA8 |
Top |
Malignant transformation analysis |
| Identification of the aberrant gene expression in precancerous and cancerous lesions by comparing the gene expression of stem-like cells in diseased tissues with normal stem cells |
| Entrez ID | Symbol | Replicates | Species | Organ | Tissue | Adj P-value | Log2FC | Malignancy |
| 1969 | EPHA2 | CCI_3 | Human | Cervix | CC | 3.74e-08 | 6.26e-01 | 0.516 |
| 1969 | EPHA2 | CCII_1 | Human | Cervix | CC | 4.01e-02 | 3.04e-01 | 0.3249 |
| 1969 | EPHA2 | Tumor | Human | Cervix | CC | 1.35e-09 | 3.19e-01 | 0.1241 |
| 1969 | EPHA2 | sample1 | Human | Cervix | CC | 9.70e-06 | 4.61e-01 | 0.0959 |
| 1969 | EPHA2 | sample3 | Human | Cervix | CC | 4.29e-32 | 6.01e-01 | 0.1387 |
| 1969 | EPHA2 | H2 | Human | Cervix | HSIL_HPV | 2.02e-10 | 4.53e-01 | 0.0632 |
| 1969 | EPHA2 | L1 | Human | Cervix | CC | 1.49e-02 | 3.19e-01 | 0.0802 |
| 1969 | EPHA2 | T1 | Human | Cervix | CC | 1.81e-15 | 5.07e-01 | 0.0918 |
| 1969 | EPHA2 | T2 | Human | Cervix | CC | 9.80e-08 | 6.21e-01 | 0.0709 |
| 1969 | EPHA2 | T3 | Human | Cervix | CC | 1.49e-25 | 6.07e-01 | 0.1389 |
| 1969 | EPHA2 | HTA11_2487_2000001011 | Human | Colorectum | SER | 3.67e-07 | 2.55e-01 | -0.1808 |
| 1969 | EPHA2 | HTA11_411_2000001011 | Human | Colorectum | SER | 1.05e-04 | 8.84e-01 | -0.2602 |
| 1969 | EPHA2 | HTA11_2112_2000001011 | Human | Colorectum | SER | 1.47e-03 | 5.66e-01 | -0.2196 |
| 1969 | EPHA2 | HTA11_1391_2000001011 | Human | Colorectum | AD | 1.43e-04 | 2.29e-01 | -0.059 |
| 1969 | EPHA2 | HTA11_99999970781_79442 | Human | Colorectum | MSS | 1.77e-07 | 3.51e-01 | 0.294 |
| 1969 | EPHA2 | HTA11_99999971662_82457 | Human | Colorectum | MSS | 5.09e-09 | 4.66e-01 | 0.3859 |
| 1969 | EPHA2 | HTA11_99999973899_84307 | Human | Colorectum | MSS | 1.33e-03 | 3.18e-01 | 0.2585 |
| 1969 | EPHA2 | HTA11_99999974143_84620 | Human | Colorectum | MSS | 5.34e-37 | 8.69e-01 | 0.3005 |
| 1969 | EPHA2 | LZE4T | Human | Esophagus | ESCC | 1.29e-07 | -4.89e-01 | 0.0811 |
| 1969 | EPHA2 | LZE7T | Human | Esophagus | ESCC | 2.77e-06 | -5.12e-01 | 0.0667 |
| Page: 1 2 3 4 5 |
| Tissue | Expression Dynamics | Abbreviation |
| Cervix | 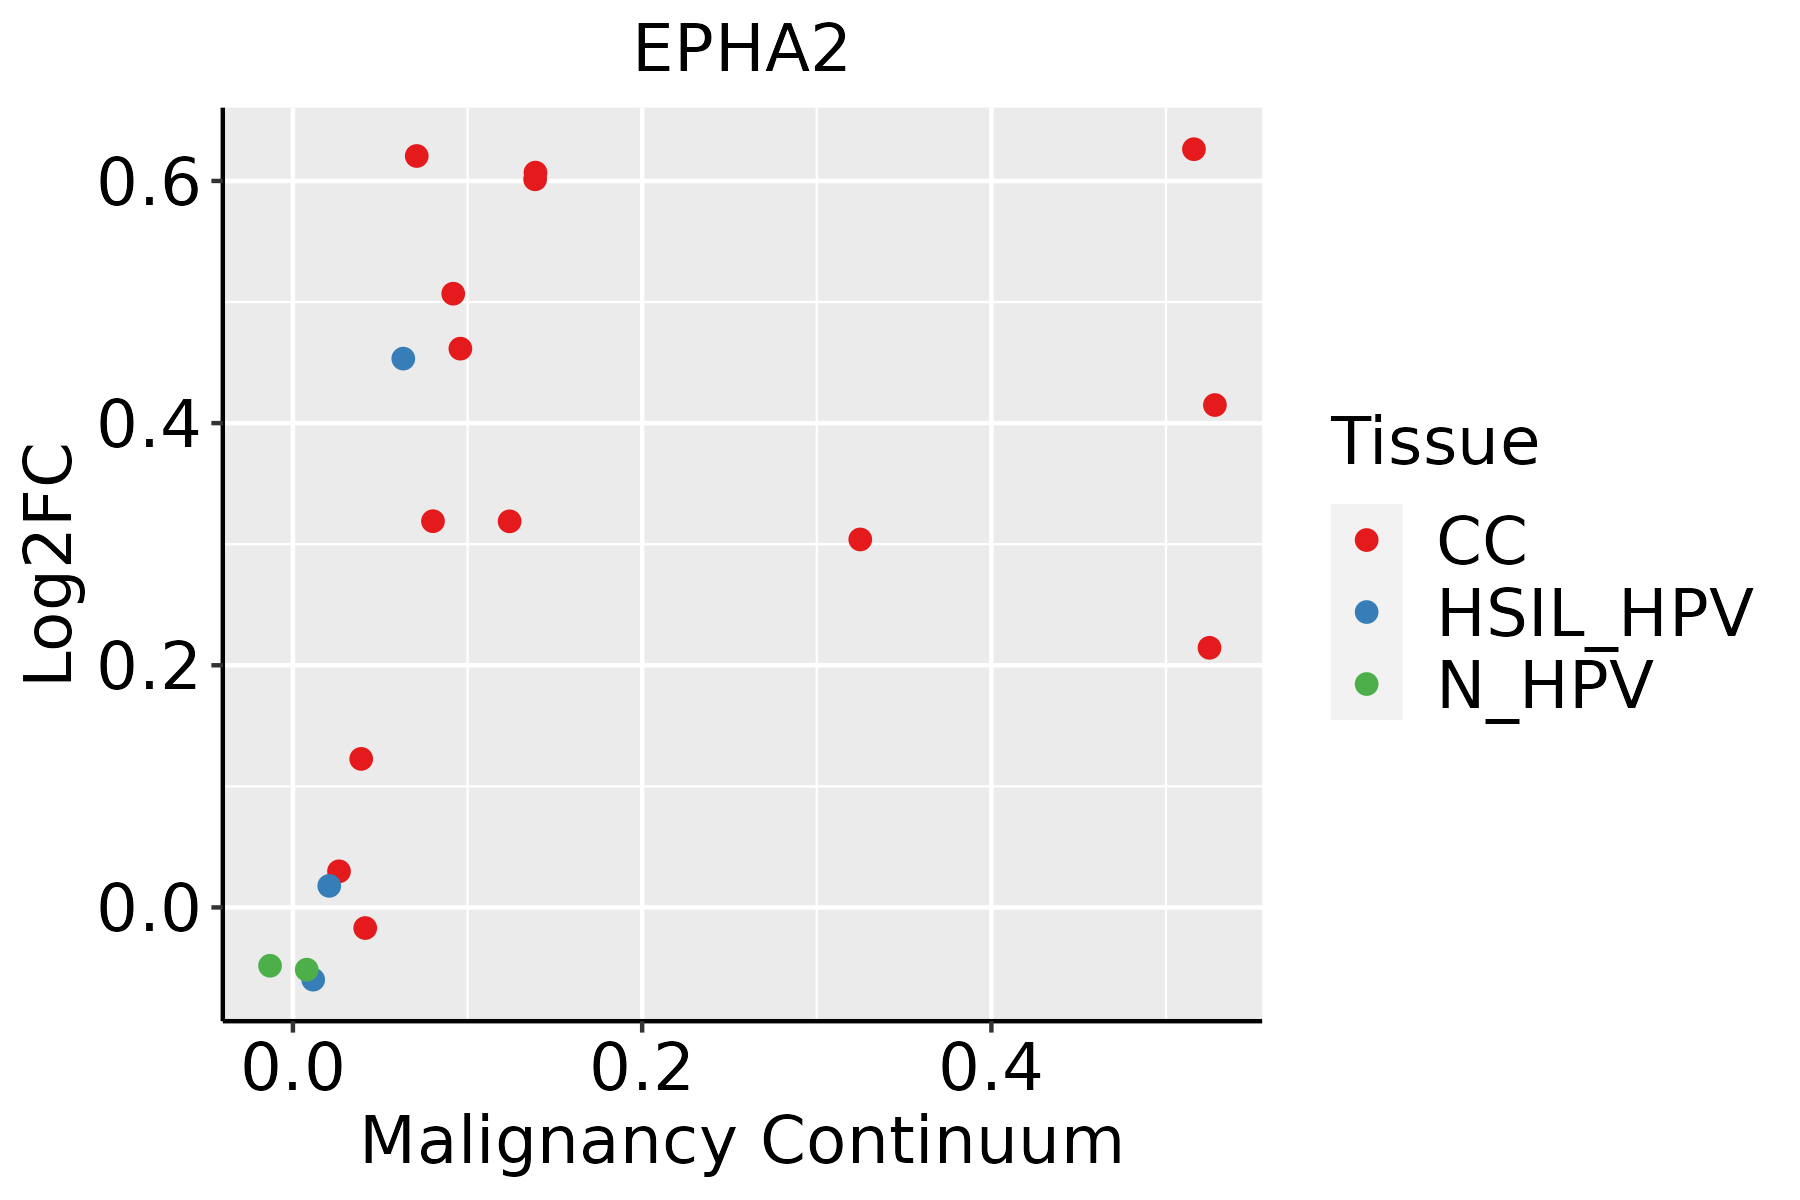 | CC: Cervix cancer |
| HSIL_HPV: HPV-infected high-grade squamous intraepithelial lesions | ||
| N_HPV: HPV-infected normal cervix | ||
| Colorectum (GSE201348) |  | FAP: Familial adenomatous polyposis |
| CRC: Colorectal cancer | ||
| Colorectum (HTA11) |  | AD: Adenomas |
| SER: Sessile serrated lesions | ||
| MSI-H: Microsatellite-high colorectal cancer | ||
| MSS: Microsatellite stable colorectal cancer | ||
| Esophagus |  | ESCC: Esophageal squamous cell carcinoma |
| HGIN: High-grade intraepithelial neoplasias | ||
| LGIN: Low-grade intraepithelial neoplasias | ||
| Oral Cavity | 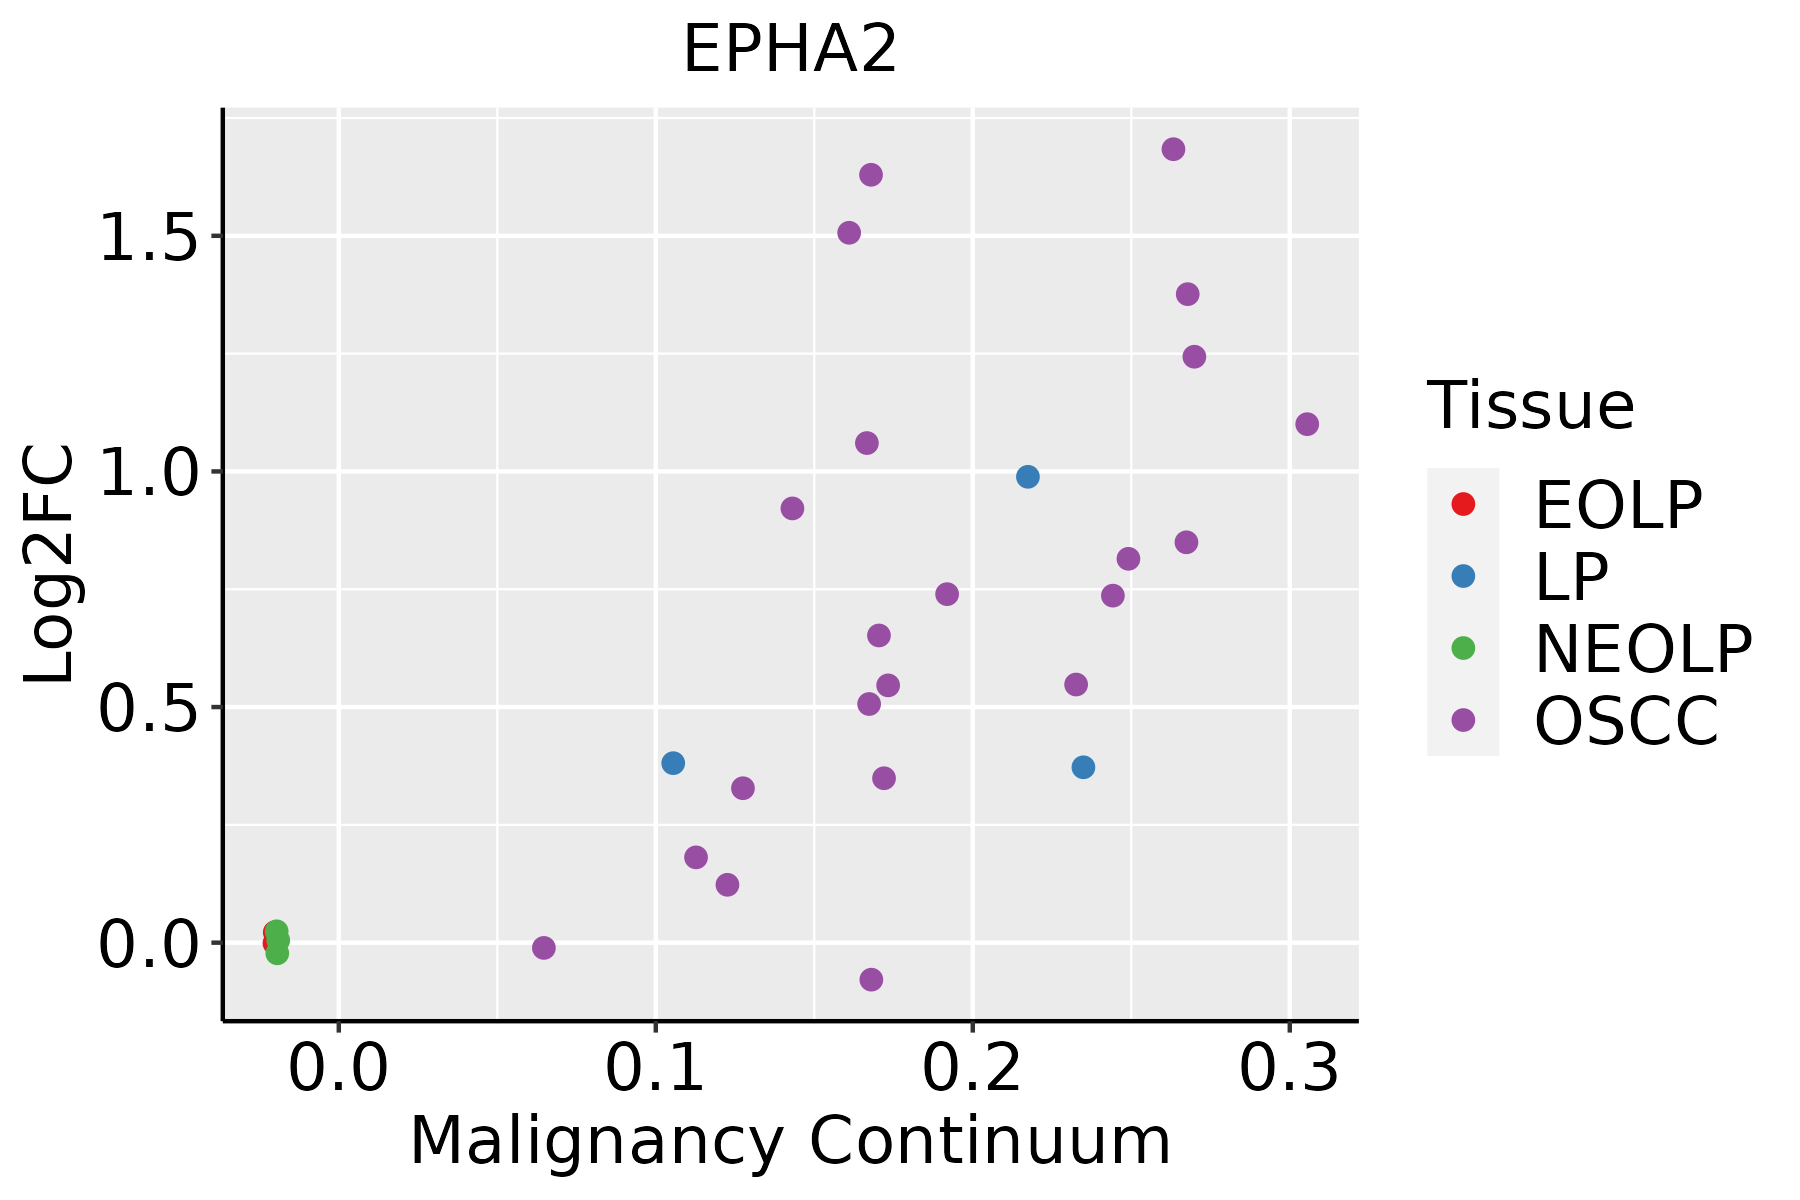 | EOLP: Erosive Oral lichen planus |
| LP: leukoplakia | ||
| NEOLP: Non-erosive oral lichen planus | ||
| OSCC: Oral squamous cell carcinoma | ||
| Prostate | 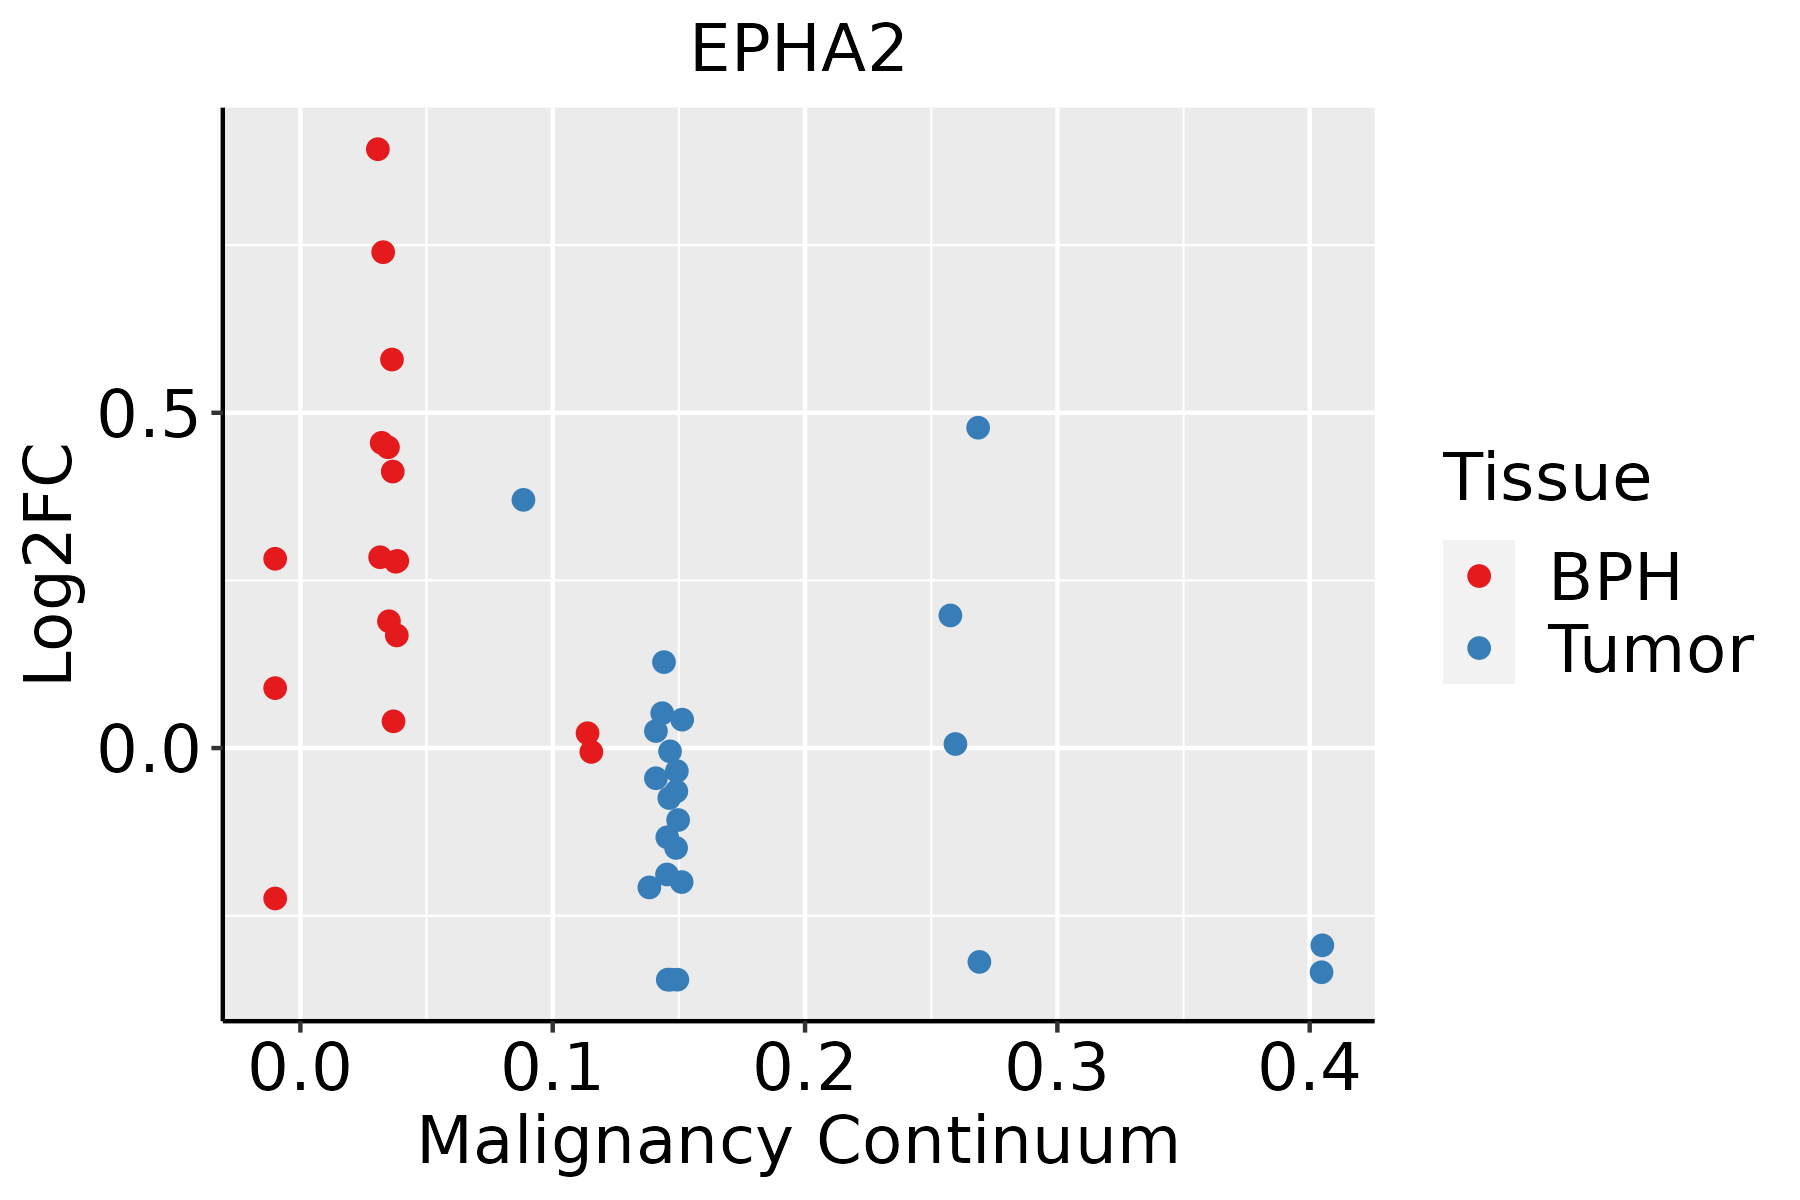 | BPH: Benign Prostatic Hyperplasia |
| Skin | 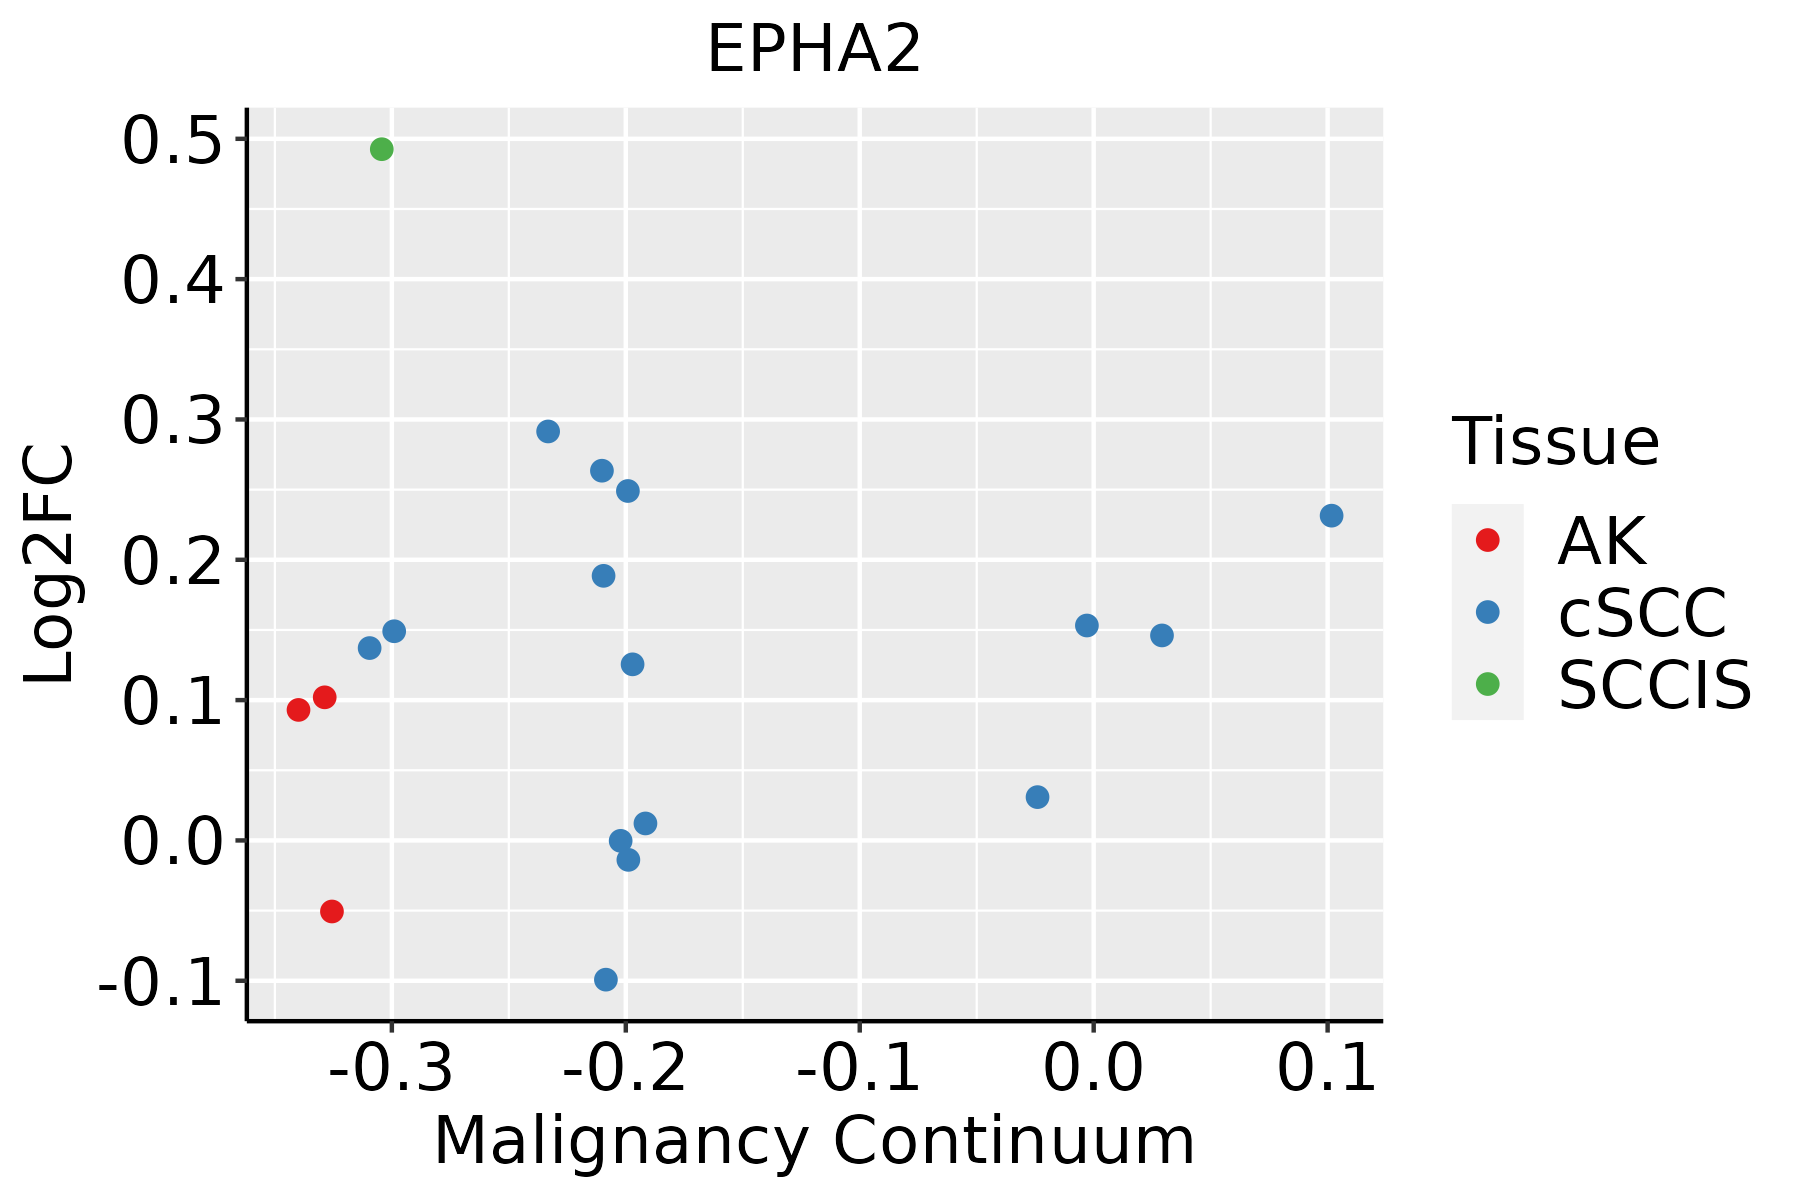 | AK: Actinic keratosis |
| cSCC: Cutaneous squamous cell carcinoma | ||
| SCCIS:squamous cell carcinoma in situ |
| ∗log2FC in expression of this searched gene in stem-like cells from each diseased tissue sample relative to stem-like cells in normal samples in each tissue plotted against the malignancy continuum. Samples are colored based on if they are from different disease stage. |
Top |
Malignant transformation related pathway analysis |
| Find out the enriched GO biological processes and KEGG pathways involved in transition from healthy to precancer to cancer |
| Tissue | Disease Stage | Enriched GO biological Processes |
| Colorectum | AD |  |
| Colorectum | SER |  |
| Colorectum | MSS |  |
| Colorectum | MSI-H |  |
| Colorectum | FAP |  |
| ∗Top 15 enriched GO BP terms are showed in the bar plot of each disease state in each tissue. Each row represents a significant GO biological process which is colored according to the -log10(p.adjust). |
| Page: 1 2 3 4 5 6 7 8 9 |
| GO ID | Tissue | Disease Stage | Description | Gene Ratio | Bg Ratio | pvalue | p.adjust | Count |
| GO:009719310 | Cervix | CC | intrinsic apoptotic signaling pathway | 85/2311 | 288/18723 | 4.56e-15 | 6.46e-12 | 85 |
| GO:001603210 | Cervix | CC | viral process | 109/2311 | 415/18723 | 5.40e-15 | 6.46e-12 | 109 |
| GO:001905810 | Cervix | CC | viral life cycle | 87/2311 | 317/18723 | 2.20e-13 | 1.20e-10 | 87 |
| GO:009013210 | Cervix | CC | epithelium migration | 90/2311 | 360/18723 | 2.45e-11 | 6.11e-09 | 90 |
| GO:00016679 | Cervix | CC | ameboidal-type cell migration | 110/2311 | 475/18723 | 2.66e-11 | 6.36e-09 | 110 |
| GO:001063110 | Cervix | CC | epithelial cell migration | 89/2311 | 357/18723 | 3.72e-11 | 8.54e-09 | 89 |
| GO:00085446 | Cervix | CC | epidermis development | 83/2311 | 324/18723 | 3.91e-11 | 8.54e-09 | 83 |
| GO:009013010 | Cervix | CC | tissue migration | 90/2311 | 365/18723 | 5.42e-11 | 1.05e-08 | 90 |
| GO:00435884 | Cervix | CC | skin development | 71/2311 | 263/18723 | 8.04e-11 | 1.46e-08 | 71 |
| GO:190382910 | Cervix | CC | positive regulation of cellular protein localization | 72/2311 | 276/18723 | 3.20e-10 | 4.46e-08 | 72 |
| GO:007265910 | Cervix | CC | protein localization to plasma membrane | 73/2311 | 284/18723 | 4.95e-10 | 6.73e-08 | 73 |
| GO:005212610 | Cervix | CC | movement in host environment | 52/2311 | 175/18723 | 7.03e-10 | 8.76e-08 | 52 |
| GO:004440910 | Cervix | CC | entry into host | 47/2311 | 151/18723 | 8.45e-10 | 1.03e-07 | 47 |
| GO:005170110 | Cervix | CC | biological process involved in interaction with host | 57/2311 | 203/18723 | 1.18e-09 | 1.41e-07 | 57 |
| GO:00506737 | Cervix | CC | epithelial cell proliferation | 98/2311 | 437/18723 | 2.01e-09 | 2.15e-07 | 98 |
| GO:001063210 | Cervix | CC | regulation of epithelial cell migration | 72/2311 | 292/18723 | 4.52e-09 | 4.43e-07 | 72 |
| GO:004671810 | Cervix | CC | viral entry into host cell | 44/2311 | 144/18723 | 5.47e-09 | 5.03e-07 | 44 |
| GO:004440310 | Cervix | CC | biological process involved in symbiotic interaction | 71/2311 | 290/18723 | 7.94e-09 | 6.98e-07 | 71 |
| GO:003367410 | Cervix | CC | positive regulation of kinase activity | 101/2311 | 467/18723 | 8.66e-09 | 7.22e-07 | 101 |
| GO:19907788 | Cervix | CC | protein localization to cell periphery | 78/2311 | 333/18723 | 1.22e-08 | 9.73e-07 | 78 |
| Page: 1 2 3 4 5 6 7 8 9 10 11 12 13 14 15 16 17 18 19 20 21 22 23 24 25 26 27 28 29 30 31 32 33 34 35 36 37 38 39 40 41 |
| Pathway ID | Tissue | Disease Stage | Description | Gene Ratio | Bg Ratio | pvalue | p.adjust | qvalue | Count |
| hsa0401512 | Cervix | CC | Rap1 signaling pathway | 56/1267 | 210/8465 | 6.23e-06 | 5.61e-05 | 3.32e-05 | 56 |
| hsa043609 | Cervix | CC | Axon guidance | 47/1267 | 182/8465 | 8.13e-05 | 5.38e-04 | 3.18e-04 | 47 |
| hsa040142 | Cervix | CC | Ras signaling pathway | 51/1267 | 236/8465 | 3.55e-03 | 1.34e-02 | 7.91e-03 | 51 |
| hsa040109 | Cervix | CC | MAPK signaling pathway | 62/1267 | 302/8465 | 4.89e-03 | 1.67e-02 | 9.86e-03 | 62 |
| hsa0401513 | Cervix | CC | Rap1 signaling pathway | 56/1267 | 210/8465 | 6.23e-06 | 5.61e-05 | 3.32e-05 | 56 |
| hsa0436012 | Cervix | CC | Axon guidance | 47/1267 | 182/8465 | 8.13e-05 | 5.38e-04 | 3.18e-04 | 47 |
| hsa0401411 | Cervix | CC | Ras signaling pathway | 51/1267 | 236/8465 | 3.55e-03 | 1.34e-02 | 7.91e-03 | 51 |
| hsa0401012 | Cervix | CC | MAPK signaling pathway | 62/1267 | 302/8465 | 4.89e-03 | 1.67e-02 | 9.86e-03 | 62 |
| hsa040152 | Colorectum | SER | Rap1 signaling pathway | 54/1580 | 210/8465 | 6.55e-03 | 3.68e-02 | 2.67e-02 | 54 |
| hsa040153 | Colorectum | SER | Rap1 signaling pathway | 54/1580 | 210/8465 | 6.55e-03 | 3.68e-02 | 2.67e-02 | 54 |
| hsa040154 | Colorectum | MSS | Rap1 signaling pathway | 66/1875 | 210/8465 | 1.03e-03 | 5.94e-03 | 3.64e-03 | 66 |
| hsa043602 | Colorectum | MSS | Axon guidance | 54/1875 | 182/8465 | 1.03e-02 | 3.69e-02 | 2.26e-02 | 54 |
| hsa040155 | Colorectum | MSS | Rap1 signaling pathway | 66/1875 | 210/8465 | 1.03e-03 | 5.94e-03 | 3.64e-03 | 66 |
| hsa043603 | Colorectum | MSS | Axon guidance | 54/1875 | 182/8465 | 1.03e-02 | 3.69e-02 | 2.26e-02 | 54 |
| hsa0436016 | Esophagus | ESCC | Axon guidance | 108/4205 | 182/8465 | 5.13e-03 | 1.30e-02 | 6.67e-03 | 108 |
| hsa041517 | Esophagus | ESCC | PI3K-Akt signaling pathway | 197/4205 | 354/8465 | 1.24e-02 | 2.83e-02 | 1.45e-02 | 197 |
| hsa0436017 | Esophagus | ESCC | Axon guidance | 108/4205 | 182/8465 | 5.13e-03 | 1.30e-02 | 6.67e-03 | 108 |
| hsa0415114 | Esophagus | ESCC | PI3K-Akt signaling pathway | 197/4205 | 354/8465 | 1.24e-02 | 2.83e-02 | 1.45e-02 | 197 |
| hsa0401014 | Oral cavity | OSCC | MAPK signaling pathway | 165/3704 | 302/8465 | 7.11e-05 | 2.74e-04 | 1.40e-04 | 165 |
| hsa041516 | Oral cavity | OSCC | PI3K-Akt signaling pathway | 185/3704 | 354/8465 | 6.26e-04 | 1.86e-03 | 9.49e-04 | 185 |
| Page: 1 2 |
Top |
Cell-cell communication analysis |
| Identification of potential cell-cell interactions between two cell types and their ligand-receptor pairs for different disease states |
| Ligand | Receptor | LRpair | Pathway | Tissue | Disease Stage |
| EFNA1 | EPHA2 | EFNA1_EPHA2 | EPHA | Breast | DCIS |
| EFNA5 | EPHA2 | EFNA5_EPHA2 | EPHA | Breast | DCIS |
| EFNA1 | EPHA2 | EFNA1_EPHA2 | EPHA | Cervix | ADJ |
| EFNA1 | EPHA2 | EFNA1_EPHA2 | EPHA | Cervix | CC |
| EFNA5 | EPHA2 | EFNA5_EPHA2 | EPHA | Cervix | CC |
| EFNA1 | EPHA2 | EFNA1_EPHA2 | EPHA | CRC | FAP |
| EFNA5 | EPHA2 | EFNA5_EPHA2 | EPHA | CRC | FAP |
| EFNA1 | EPHA2 | EFNA1_EPHA2 | EPHA | CRC | MSI-H |
| EFNA3 | EPHA2 | EFNA3_EPHA2 | EPHA | CRC | MSI-H |
| EFNA5 | EPHA2 | EFNA5_EPHA2 | EPHA | CRC | MSI-H |
| EFNA1 | EPHA2 | EFNA1_EPHA2 | EPHA | CRC | MSS |
| EFNA5 | EPHA2 | EFNA5_EPHA2 | EPHA | CRC | SER |
| EFNA1 | EPHA2 | EFNA1_EPHA2 | EPHA | Endometrium | ADJ |
| EFNA5 | EPHA2 | EFNA5_EPHA2 | EPHA | Endometrium | ADJ |
| EFNA1 | EPHA2 | EFNA1_EPHA2 | EPHA | Endometrium | AEH |
| EFNA5 | EPHA2 | EFNA5_EPHA2 | EPHA | Endometrium | AEH |
| EFNA1 | EPHA2 | EFNA1_EPHA2 | EPHA | Endometrium | Healthy |
| EFNA1 | EPHA2 | EFNA1_EPHA2 | EPHA | Esophagus | ADJ |
| EFNA1 | EPHA2 | EFNA1_EPHA2 | EPHA | Esophagus | ESCC |
| EFNA3 | EPHA2 | EFNA3_EPHA2 | EPHA | Esophagus | ESCC |
| Page: 1 |
Top |
Single-cell gene regulatory network inference analysis |
| Find out the significant the regulons (TFs) and the target genes of each regulon across cell types for different disease states |
| TF | Cell Type | Tissue | Disease Stage | Target Gene | RSS | Regulon Activity |
| ∗The dot plots of a searched regulon are shown for all cell subpopulations in each disease state of each tissue based on the regulon specific score inferred using pySCENIC and by calculating the average expression. |
| Page: 1 |
Top |
Somatic mutation of malignant transformation related genes |
| Annotation of somatic variants for genes involved in malignant transformation |
| Hugo Symbol | Variant Class | Variant Classification | dbSNP RS | HGVSc | HGVSp | HGVSp Short | SWISSPROT | BIOTYPE | SIFT | PolyPhen | Tumor Sample Barcode | Tissue | Histology | Sex | Age | Stage | Therapy Types | Drugs | Outcome |
| EPHA2 | SNV | Missense_Mutation | novel | c.689G>A | p.Cys230Tyr | p.C230Y | P29317 | protein_coding | deleterious(0) | benign(0.336) | TCGA-AN-A0FS-01 | Breast | breast invasive carcinoma | Female | <65 | I/II | Unknown | Unknown | SD |
| EPHA2 | SNV | Missense_Mutation | rs754656950 | c.1012N>A | p.Val338Met | p.V338M | P29317 | protein_coding | tolerated(0.13) | benign(0.056) | TCGA-AR-A2LL-01 | Breast | breast invasive carcinoma | Female | >=65 | I/II | Hormone Therapy | tamoxiphen | SD |
| EPHA2 | SNV | Missense_Mutation | c.625G>A | p.Ala209Thr | p.A209T | P29317 | protein_coding | deleterious(0) | benign(0.142) | TCGA-BH-A0AV-01 | Breast | breast invasive carcinoma | Female | <65 | I/II | Chemotherapy | taxotere | CR | |
| EPHA2 | SNV | Missense_Mutation | c.2928N>G | p.Ile976Met | p.I976M | P29317 | protein_coding | deleterious_low_confidence(0.05) | probably_damaging(0.986) | TCGA-BH-A0B7-01 | Breast | breast invasive carcinoma | Female | <65 | I/II | Chemotherapy | adriamycin | CR | |
| EPHA2 | SNV | Missense_Mutation | novel | c.638N>T | p.Glu213Val | p.E213V | P29317 | protein_coding | deleterious(0) | benign(0.054) | TCGA-BH-A0H7-01 | Breast | breast invasive carcinoma | Female | >=65 | III/IV | Chemotherapy | doxorubicin | SD |
| EPHA2 | insertion | Nonsense_Mutation | novel | c.331_332insTTAAGGAATTGGAGGTTTAGT | p.Gly111delinsValLysGluLeuGluValTerCys | p.G111delinsVKELEV*C | P29317 | protein_coding | TCGA-A8-A08H-01 | Breast | breast invasive carcinoma | Female | >=65 | I/II | Unknown | Unknown | SD | ||
| EPHA2 | insertion | Nonsense_Mutation | novel | c.690_691insTGATTTTCCACTGGGGCCTCTATAGATGACACAC | p.Val231Ter | p.V231* | P29317 | protein_coding | TCGA-AN-A0FS-01 | Breast | breast invasive carcinoma | Female | <65 | I/II | Unknown | Unknown | SD | ||
| EPHA2 | insertion | Frame_Shift_Ins | novel | c.636_637insACATTTTTAGCTGT | p.Glu213ThrfsTer185 | p.E213Tfs*185 | P29317 | protein_coding | TCGA-BH-A0H7-01 | Breast | breast invasive carcinoma | Female | >=65 | III/IV | Chemotherapy | doxorubicin | SD | ||
| EPHA2 | deletion | Frame_Shift_Del | novel | c.2352delC | p.Ala785ProfsTer26 | p.A785Pfs*26 | P29317 | protein_coding | TCGA-D8-A27V-01 | Breast | breast invasive carcinoma | Female | <65 | I/II | Hormone Therapy | tamoxiphen | SD | ||
| EPHA2 | SNV | Missense_Mutation | c.2581C>T | p.Arg861Cys | p.R861C | P29317 | protein_coding | deleterious(0) | probably_damaging(1) | TCGA-2W-A8YY-01 | Cervix | cervical & endocervical cancer | Female | <65 | I/II | Chemotherapy | cisplatin | CR |
| Page: 1 2 3 4 5 6 7 8 9 10 11 12 13 14 15 16 17 |
Top |
Related drugs of malignant transformation related genes |
| Identification of chemicals and drugs interact with genes involved in malignant transfromation |
| (DGIdb 4.0) |
| Entrez ID | Symbol | Category | Interaction Types | Drug Claim Name | Drug Name | PMIDs |
| 1969 | EPHA2 | DRUGGABLE GENOME, CELL SURFACE, KINASE, TYROSINE KINASE, CLINICALLY ACTIONABLE | DASATINIB | DASATINIB | 20360610 | |
| 1969 | EPHA2 | DRUGGABLE GENOME, CELL SURFACE, KINASE, TYROSINE KINASE, CLINICALLY ACTIONABLE | TOZASERTIB | TOZASERTIB | ||
| 1969 | EPHA2 | DRUGGABLE GENOME, CELL SURFACE, KINASE, TYROSINE KINASE, CLINICALLY ACTIONABLE | LITHOGLYCOCHOLATE | LITHOGLYCOCHOLATE | 23489211 | |
| 1969 | EPHA2 | DRUGGABLE GENOME, CELL SURFACE, KINASE, TYROSINE KINASE, CLINICALLY ACTIONABLE | MLN-8054 | MLN-8054 | ||
| 1969 | EPHA2 | DRUGGABLE GENOME, CELL SURFACE, KINASE, TYROSINE KINASE, CLINICALLY ACTIONABLE | OSI-632 | OSI-632 | ||
| 1969 | EPHA2 | DRUGGABLE GENOME, CELL SURFACE, KINASE, TYROSINE KINASE, CLINICALLY ACTIONABLE | inhibitor | 249565850 | ||
| 1969 | EPHA2 | DRUGGABLE GENOME, CELL SURFACE, KINASE, TYROSINE KINASE, CLINICALLY ACTIONABLE | DS-8895 | |||
| 1969 | EPHA2 | DRUGGABLE GENOME, CELL SURFACE, KINASE, TYROSINE KINASE, CLINICALLY ACTIONABLE | DASATINIB | DASATINIB | ||
| 1969 | EPHA2 | DRUGGABLE GENOME, CELL SURFACE, KINASE, TYROSINE KINASE, CLINICALLY ACTIONABLE | MEDI-547 | |||
| 1969 | EPHA2 | DRUGGABLE GENOME, CELL SURFACE, KINASE, TYROSINE KINASE, CLINICALLY ACTIONABLE | N/A |
| Page: 1 2 3 4 |

Copyright 2023-Present -The University of Texas Health Science Center at Houston |